 MetaTrader 5
 Experts
 Indicadores
 Bibliotecas
 Utilitários
 Widgets
 Regras
Conheça o Mercado MQL5 no YouTube, assista aos vídeos tutoriais
Como comprar um robô de negociação ou indicador?
Execute seu EA na
hospedagem virtual
hospedagem virtual
Teste indicadores/robôs de negociação antes de comprá-los
Quer ganhar dinheiro no Mercado?
Como apresentar um produto para o consumidor final?
Novos Indicadores Técnicos para MetaTrader 4 - 173
 É com base nos sinais de indicadores técnicos listados abaixo que você pode aplicar as decisões para abertura ou fechamento de uma transação na plataforma MetaTrader 4.
O funcionamento dos indicadores reside na previsão de mudanças de preço, com base na conversão matemática de preço e/ou volumes de um instrumento financeiro.
É com base nos sinais de indicadores técnicos listados abaixo que você pode aplicar as decisões para abertura ou fechamento de uma transação na plataforma MetaTrader 4.
O funcionamento dos indicadores reside na previsão de mudanças de preço, com base na conversão matemática de preço e/ou volumes de um instrumento financeiro. 
FFx PinBar Setup Alerter gives trade suggestions with Entry, Target 1, Target 2 and StopLoss. Below are the different options available: Entry suggestion - pips to be added over the break for the entry Minimum candle size - to avoid too small candles
3 different options to calculate the SL - by pips, by ATR multiplier or at the pattern High/Low 3 different options to calculate the 2 TPs - by pips, by ATR multiplier or at Risk/Reward Offset the dashboard - any place on the chart Remove the sugges

O indicador Four Moving Averages ( consulte a descrição e o video ) é uma versão de Four Moving Averages Message , onde exibe simultaneamente quatro médias móveis com configurações padrão na janela do gráfico principal: Verde e e vermelho representam uma tendência de curto prazo, vermelho e azul - tendência médio prazo, enquanto azul e o amarelo - tendência de longo prazo. Você pode alterar as configurações e cores das médias móveis. Esses parâmetros foram configurados de modo a permitir a negoc

O indicador Display Stochastic System para a plataforma de negociação MetaTrader 4 ( veja a descrição em Russo ) é compacto e dimensionado para uma janela do gráfico, a exibição do indicador estocástico é para todos os timeframes uma única janela. Parâmetros para cada timeframe são definidos separadamente. Tamanho da letra, canto e cor podem ser ajustadod de acordo com as suas preferências. Por padrão, o sinal de compra é verde e o sinal de venda é vermelho. O mercado sobrecomprado é vermelho es
O indicador Display System ADX para a plataforma de negociação MetaTrader 4 ( veja descrição (em russo) ) é exibido de forma compacta em uma janela do gráfico, durante a exibição de resultados dos indicadores ADX para todos os intervalos de tempo em uma única janela. Parâmetros para cada período de tempo são definidas separadamente. Tamanho da letra, o canto e a cor pode ser ajustada de acordo com as suas preferências. Por padrão, as cores dos nomes do período de tempo são as seguintes: nenhuma

The Level S Moving Averages indicator ( see the description and video ) does not draw the Moving Average line in the chart window but marks multiple levels (such as close, highs and lows of any bar on the time frames from M1 to D1, W1, MN - strong levels) of the Moving Average on all time frames in accordance with the specified parameters. The level move frequency corresponds to the TimeFrame parameter value specified. The advantage of this indicator lies in the fact that it offers the possibili

The Four Moving Averages Message indicator ( please see the description and video ), a version of Four Moving Averages , concurrently displays four Moving Averages with default settings in the main chart window: Green and Red ones represent a short-term trend, Red and Blue ones - mid-term trend, while Blue and Yellow ones - long-term trend. You can change the moving average settings and colors. However, these parameters have been configured so that to allow trading on all time frames. The built-

The Level Moving Averages indicator ( see the description and video ) does not draw the Moving Average line in the chart window but marks the Moving Average level on all time frames in accordance with the specified parameters. The level move frequency corresponds to the TimeFrame parameter value specified. The advantage of this indicator lies in the fact that it offers the possibility of monitoring the interaction between the price and the MA of a higher time frame on a lower one (e.g., the MA l
This is an indicator that helps you to see what symbols have the best SCORE of SWAP and SPREAD. The SCORE is calculated as follows: SWAP/SPREAD. So, the higher SCORE/SPREAD symbols have, the better (because everyone wants their orders to have positive swap, while keeping spread small). This indicator will help traders have an advantage in swap when choosing symbols and type (buy or sell) to make an order. You can see (in the picture) that this indicator shows a list of symbols with their score b

Fibonacci Ratio is useful to measure the target of a wave's move within an Elliott Wave structure. Different waves in an Elliott Wave structure relates to one another with Fibonacci Ratio. For example, in impulse wave: • Wave 2 is typically 50%, 61.8%, 76.4%, or 85.4% of wave 1. Fibonacci Waves could be used by traders to determine areas where they will wish to take profits in the next leg of an Up or Down trend.

IceFX VelocityMeter é um indicador muito único na plataforma MetaTrader 4, que mede a velocidade do mercado forex. Ele não é um indicador de volume normal ou de outra medida pois o IceFX VelocityMeter é capaz de entender os movimentos de velocidade do mercado, que estão escondidos em ticks e estas valiosas informações não podem ser lidas de forma ordinária nas velas. O software monitora os ticks recebidos (freqüência, magnitude da mudança) dentro de um intervalo de tempo especificado, analisa e
FREE

MACD Color ( por favor, veja a descrição e o vídeo ) é um indicador para a plataforma de negociação MetaTrader 4 semelhante ao MACD Mensagem . Ao contrário do indicador padrão, ele altera a cor da borda da barra quando ocorre uma alteração na situação do mercado - uma mudança na força da tendência ou uma mudança na inclinação da EMA principal que representa o nível zero, ele muda a cor do nível zero (este parâmetro pode ser desativado nas configurações). Dê uma olhada em Trading Strategy para ve

Este é um indicador para MetaTrader 4. Ele é pequeno, agradável e dimensionado de forma compacta para uma janela do gráfico, enquanto ele exibe convenientemente todas as informações necessárias: volume da posições em aberto e o lucro total sobre eles. Tamanho da letra, o canto e a cor pode ser ajustada de acordo com as suas preferências. Por padrão, uma posição positiva é exibida em verde e uma negativo é mostrado em vermelho. Boa sorte na negociação!

The indicator is based on pair trading methods. It is not redrawn unlike similar indicators. Shows correlation between two selected instruments in percent for a predetermined period, and the positions of the instruments relative to each other. Has a function for reverse display of any of the analyzed symbols - for instruments with negative correlation. Can be drawn as a line or as a histogram. Settings: Symb1 - first symbol name. Revers1 - reverse display of the first symbol. Symb2 - second symb

Unlike the standard indicator, Stochastic Oscillator Message ( please see the description and video ) features an alert system that informs you of changes in the market situation using twenty signals: the Main line and Signal line cross in the area above/below the levels of extremum (below 20%; above 80%); the Main line and Signal line cross within the range of 20% to 80%; the Main line crosses the levels of extremum; the Main line crosses the 50-level; divergence on the last bar. Parameters of

RSI TrendLine Divergency Message is an indicator for the MetaTrader 4 trading platform. Unlike the original indicator, this three in one version has a system of alerts that inform on market situation changes. It consists of the following signals: when the Main line crosses the levels of extreme zones and 50% level; when the Main line crosses the Trend line in the indicator window; divergence on the last bar. Parameters of levels of extremum, 50-level and divergence are adjustable.
Parameters La

This indicator is based on the classical Alligator indicator. The proposed indicator has the ability to increase a smooth-effect in Alligator Indicator. This indicator could play an important role in determining support and resistance lines. Support occurs when falling prices stop, change direction, and begin to rise. Support is often viewed as a “floor” which is supporting , or holding up, prices. Resistance is a price level where rising prices stop, change direction, and begin to fall.
An indicator of patterns #45 and #46 (Three Falling Peaks and Three Rising Valleys) from Encyclopedia of Chart Patterns by Thomas N. Bulkowski. Parameters: Alerts - show alert when an arrow appears Push - send a push notification when an arrow appears (requires configuration in the terminal) PeriodBars - indicator period K - an additional parameter that influences the accuracy of pattern shape recognition. The smaller the value is, the smoother the row of peaks/valleys should be, so fewer patt

MACD Message is an analogue of the MACD Alert for the MetaTrader 4 terminal with more advanced functionality: Parameters 'Averaging Method' and 'Price Type' ( MA method and Apply to ) are displayed in the settings window. It gives an advantage of monitoring convergence/divergence of all types of Moving Average (Simple Averaging, Exponential, Smoothed and Linear Weighted) and by any price (Closing Price, Opening Price, the Maximum Price for the Period, the Minimum Price for the Period, Median Pri
Auto ZZ SR Indicator
This indicator automatically draws trend lines using ZigZag top and bottom points. The more ZigZag tops/bottoms that are used, the greater the number of possible combinations. Therefore, the more possible trend lines can be drawn. And vice versa too. The fewer ZigZag tops/bottoms that are used, the lower the number of possible combinations. And therefore, the fewer the possible trend lines can be drawn. The indicator constantly updates the trend lines on the chart as the mar
FREE

The indicator draws trend lines based on Thomas Demark algorithm. It draws lines from different timeframes on one chart. The timeframes can be higher than or equal to the timeframe of the chart, on which the indicator is used. The indicator considers breakthrough qualifiers (if the conditions are met, an additional symbol appears in the place of the breakthrough) and draws approximate targets (target line above/below the current prices) according to Demark algorithm. Recommended timeframes for t
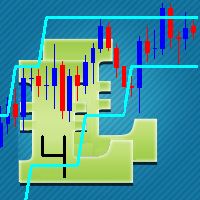
This indicator is based on the classical Envelopes indicator. The proposed indicator has the ability to increase a smooth-effect in the Envelopes Indicator. This indicator could play an important role in determining support and resistance. nPeriod input parameter determines the number of Bars for Moving Above Envelopes calculation.

The indicator calculates critical price levels. If the level is red, the price has passed it downwards; if the level is blue, the price has passed it upwards. If the price is approaching the blue level from below, that level will most probably be broken through. If the price is approaching it from above, there will most probably be a rollback. Similarly, if the price is approaching the red level from above, the level will most probably be broken through. If the price is approaching it from below

Awesome oscillator with overbought and oversold zones. A series of OBS indicators (overbought and oversold) - these are indicators enhanced with overbought and oversold zones. This makes it possible to determine when the instrument is trending, as well as when it is flat. Works on all timeframes, all currency pairs, metals and cryptocurrencies. Can be used with binary options. Settings
OBS Period - period of overbought and oversold calculation
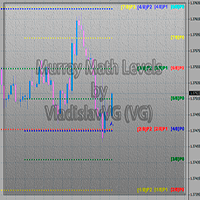
This indicator calculates and displays Murrey Math Lines on the chart. The differences from the free version: It allows you to plot up to 4 octaves, inclusive (this restriction has to do with the limit imposed on the number of indicator buffers in МТ4), using data from different time frames, which enables you to assess the correlation between trends and investment horizons of different lengths. It produces the results on historical data. A publicly available free version with modifications intr
Smart Trend Line Alert, Linha Profissional de Alerta para Linha de Tendência, Suporte e Resistência
Características: Modos Auto e Clique para converter qualquer linha traçada em linha de alerta (linha de Tendência ou linha Horizontal); Separando linhas de diferentes timeframes, escondendo as linhas traçadas nos timeframes menores em relação aos timeframes maiores para evitar que muitas linhas no gráfico causem confusão a partir de diferentes intervalos de tempo; Interruptor automático de timefr
FREE
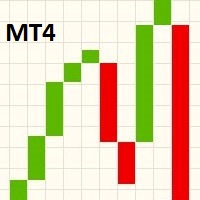
Este indicador mostra um gráfico de Ruptura de Linha no gráfico principal. Para visualizar o gráfico de Ruptura de Linha, você deve alterar o gráfico principal para exibição em linha, em seguida, mudar nas Propriedade (F8), a configuração da cor do "gráfico de linhas" para "None". Em relação a rolagem, zoom +/- ou alterar o par/período do gráfico, o indicador irá redimensionar os blocos na próxima escala para atender a área principal de visualização do gráfico. Gráficos de Ruptura de Linhas foi
FREE

Accelerator indicator with overbought and oversold zones. A series of OBS indicators (overbought and oversold) - these are indicators enhanced with overbought and oversold zones. This is the standard indicator, but it provides additional possibilities for the analysis of any market. Thanks to a special algorithm, this indicator has overbought zones =70 and =100, as well as oversold zones -70 and -100, which allows you to use it to determine the possible reversal or pullback of the price, as well

The Bears indicator with overbought and oversold zones. Two display options - as a line and as a histogram. A series of OBS indicators (overbought and oversold) - these are indicators enhanced with overbought and oversold zones. This is the standard indicator, but it provides additional possibilities for the analysis of any market. Thanks to a special algorithm, this indicator has overbought zones =70 and =100, as well as oversold zones -70 and -100, which allows you to use it to determine the
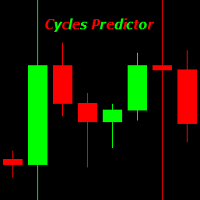
Cycles Predictor Indicator This indicator uses past market cycles to predict future price movements. The indicator scans through past data and considers combinations of cycles. When cycles coincide at the same future date/time then it is considered a valid future prediction. The predictions are drawn as vertical lines on the right side of the chart in the future. A prediction will often result in type of candle (ex. bull or bear) and/or a reversal point (ex. bottom or top) forming at this ex

The indicator identifies the direction and strength of the trend. Bearish trend areas are marked with red color, bullish areas are marked with blue color. A thin blue line indicates that a bearish trend is about to end, and it is necessary to prepare for a bullish one. The strongest signals are at the points when the filled areas start expanding. The indicator has only two parameters: period - period; offset - offset. The greater the period, the more accurate the trend identification, but with a
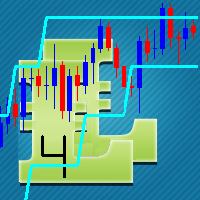
The concept of bands, or two lines that surround price, is that you will see overbought and oversold conditions. The proposed indicator has the ability to increase a smooth-effect in the bands Indicator. This indicator could play an important role in determining support and resistance. nPeriod input parameter determines number of Bars for Moving Above Bands calculation.
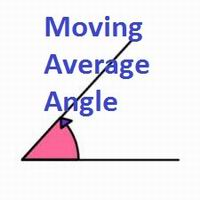
This indicator shows you the angle of the moving average according to your settings in a separate window. It also shows the angle written on the chart, which can also be adjusted. The main features and input variables provided include: MAPeriod: This is the period for your moving average. The default MAPeriod is 5. LookBack: This is a very important variable. It allows you to set the look back bar, from which the angle will be measured. For example, if your LookBack is 5, then indicator will cal
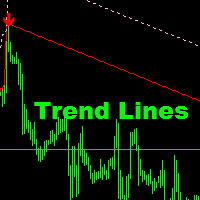
This indicator is suitable for seeing trends and determining the time to open a position. It is equipped with a Stop Loss position. Easy to use. Just watch the arrows provided.
Indicator parameters Shift - the number of bars used for the indicator shift to Right." Step Point per Period - the number of pips for down or Up trend lines" Time Frame - Calculate @ this Time Frame." Max_Bar - the number of bars used for calcuulate indicators (if '0' then All bars to calcuulate)." Alert_On - On or Off

O indicador desenha duas médias móveis simples utilizando preços máximos e mínimos A linha de MA_High é exibido quando a média móvel é direcionada para baixo. Ele pode ser usado para definir uma ordem de stop para uma posição de venda. A linha de MA_Low é exibido quando a média móvel é dirigida para cima. Ela pode ser usado para definir uma ordem de stop para uma posição comprada. O indicador é usado no Expert Advisor TrailingStop . Parâmetros Period - Período de cálculo da média móvel. Deviatio
FREE

Indicator Fibonacci SR Este indicador cria linhas de suporte e resistência. É baseado nos níveis de Retração e Extensão Fibonacci. Baseado nos níveis Fibonacci, verifica as combinações possíveis e desenha linhas de suporte/resistência. Este indicador também utiliza topos e fundos desenhados pelo indicador ZigZag em seus cálculos. O ZigZag também pode ser desenhado no gráfico, se necessário. O indicador considera muitas combinações de pontos de reversão anteriores e a proporção dos níveis Fibonac
FREE

Prevê o mais provável movimento de preços a curto prazo baseado em cálculos matemáticos avançados.
Características Estimativa do movimento imediato de preços; Cálculo da tendência real do mercado; Cálculo dos níveis de suporte e resistência mais importantes; Algoritmos otimizados para fazer cálculos matemáticos complexos com um dreno mínimo dos recursos de sistema; Auto-ajuste para um melhor desempenho, por isso funciona corretamente em qualquer ativo (não importa o quanto seja exótico) e qualq
FREE

The indicator gives signals on trend reversal or the possible direction of price movement when leaving the flat movement.
Features and settings: Sensitivity = 3 - sensitivity from 1 to 5; the higher the value, the more signals (example displayed in the screenshot below). DeepBars = 3000 - indicator display depth.
ZeroBarCalc = false - use a zero bar in the calculations; if yes, the signal will appear earlier, but it may disappear before the current candlestick is closed.
UseAlert = false - enab
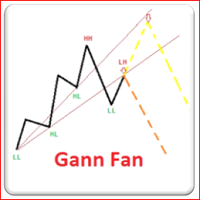
Forma de análise técnica baseada na idéia de que o mercado é geométrico e de natureza cíclica. A Gann Fan consiste em uma série de nove linhas diagonais chamadas ângulos de Gann. Estes ângulos são sobrepostos sobre uma tabela de preços a apresentam níveis de suporte e resistência de segurança. A imagem resultante tem o objetivo de ajudar os analistas técnicos a preverem as mudanças de preços. Embora inicialmente desenhada na mão, hoje Gann Fans podem ser desenhadas com programas de software. Est

Description Indicator for MT5 is here. It displays alternative (mathematically calculated) support and resistance levels, as well as the levels the price is most likely to achieve in the near future. The calculation is based on history data, and the quality of quotes is critical when generating lines. The lines built by Magneto Pro and Magneto Weekly Pro do not change on the entire calculation period.
Application Magneto Pro can be used both in conjunction with an existing strategy and as a sel

A moving average is commonly used with time series data to smooth out short-term fluctuations and determine longer-term trends. The proposed indicator has an ability to increasing a smooth-effect. This indicator could play an important role in determining support and resistance. An input parameter nPeriod determines number of Bars for Moving AboveAverage calculation.

Индикатор Magneto Weekly Pro отображает: Недельные важные линии поддержки и сопротивления (выделены желтым, красным и синим цветами). Основные недельные цели (выделены белым цветом). Недельные паттерны возврата цены (обозначаются красными флажками). Применение индикатора Magneto Pro можно использовать и как дополнение к существующей стратегии, и как самодостаточную торговую стратегию. Данный продукт состоит из двух индикаторов, работающих на разных временных промежутках, и предназначен для скаль

MTF Moving Averages indicator with overbought and oversold zones. Two display options - as a line and as a histogram. A series of OBS (overbought and oversold) indicators - these are indicators that have been enhanced with overbought and oversold zones. Another feature of this indicator is that the lines of the indicator s (when analyzing several indicator s in a single window) are not redrawn relative to each other when scrolling the chart. Settings
OBS Period - period of overbought/oversold

Bulls indicator with overbought and oversold zones. Two display options - as a line and as a histogram. OBS (overbought and oversold) indicator series - are indicators that have been provided with overbought and oversold zones. This is the standard indicator, but it provides additional possibilities for the analysis of any market. Thanks to a special algorithm, this indicator has overbought zones =70 and =100, as well as oversold zones -70 and -100, which allows you to use it to determine the p

The Force Index indicator with overbought and oversold zones. Two display options - as a line and as a histogram. A series of OBS indicators (overbought and oversold) - these are indicators enhanced with overbought and oversold zones.
Settings OBS Period - overbought/oversold calculation period Force Period - period of Force Price MA - prices for MA calculation Method MA - MA calculation method Line or Histo - display by line or histogram
The indicator allows determining the strength and direction of the trend precisely. The histogram displayed in a separate window shows changes of the slope of the regression line. A signal for entering a deal is crossing the zero line and/or a divergence. The indicator is also useful for wave analysis. Input Parameters: Period - period of calculation, 10 on default; Angle threshold - slope at which a flat is displayed, 6.0 on default (within the range from -6.0 to 6.0); Filter by volume - volume

The Accumulation indicator with overbought and oversold zones. Two display options - as a line and as a histogram. A series of OBS indicators (overbought and oversold) - these are indicators enhanced with overbought and oversold zones. Simple and straightforward settings that are easy to match to the right tool
In the indicator, you can adjust: Display depth of the indicator Color of indicator levels
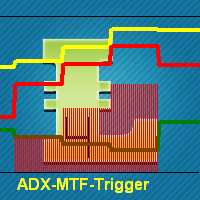
This indicator is using classical indicators: Average Directional Movement Index from the higher TF (which you can set up using input parameter TimeFrame). Yellow line represents the Main Average Directional Index from the senior TF. Green line represents the Plus Directional Indicator (+DI) from the senior TF. Red line represents the Minus Directional Indicator (-DI) from the senior TF. Green histogram represents Up trend. Red histogram represents Down trend.

Multicurrency indicator Any chart obs is a price chart with a percentage scale. Can be displayed as a line and as a histogram. There is also a reverse function available, it mirrors the chart. The name of an instrument to be displayed is specified in the input parameters, the current symbol is used on default. The indicator doesn't have lags as it is not smoothed with any formulas, but bound to a percentage scale, what allows detecting the price equilibrium, the overbought and oversold state. Th
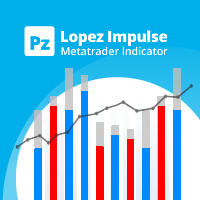
Este indicador avalia a volatilidade e a direcionalidade dos preços simultaneamente, que encontra os seguintes eventos. [ Guia de instalação | Guia de atualização | Solução de problemas | FAQ | Todos os produtos ] Movimentos de preços decisivos e repentinos Grandes martelos / padrões de estrelas cadentes Fortes crises apoiadas pela maioria dos participantes do mercado Situações de mercado indecisas, mas voláteis É um indicador extremamente fácil de usar ... O histograma azul representa o impuls
FREE

Prevê o mais provável movimento de preços a curto prazo baseado em cálculos matemáticos avançados.
Características Estimativa imediata do movimento de preços; Cálculo da tendência real do mercado; Cálculo dos níveis de suporte e resistência mais importantes; Algoritmos otimizados para fazer cálculos matemáticos complexos com um dreno mínimo de recursos do sistema; Auto-ajustável para um melhor desempenho, por isso é capaz de funcionar corretamente em qualquer símbolo (não importa o quão exótica
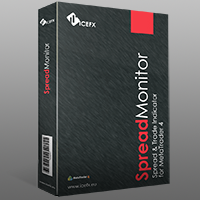
IceFX SpreadMonitor é um indicador especial de registro de spread que exibe o spread atual, valores mínimos / médio e máximo. Estes valores são ajustados para ser visível, mesmo após uma reinicialização. Além disso, o SpreadMonitor pode salvar todos os valores de spread desejados para os arquivos do tipo .csv para analisar os resultados mais tarde.
FREE

This highly informative indicator applies overbought/oversold levels for more accurate representation of the market situation. It is also possible to change the appearance of the indicator - line or histogram. Additional parameters enable more fine-tuning, while trading can be inside the channel and along a trend.
Distinctive features Oversold/overbought levels; Does not redraw. Displayed as a line or a histogram; Works on all timeframes and symbols. Suitable for manual trading and development

MACD indicator with overbought and oversold zones. Two display options - classic lines and a histogram. Can be used to detect a possible reversal or pullback in price, as well as for channel strategies All settings are simple and straightforward - all like a standard indicator, but with additional support and resistance levels Can be used both separately and together with other indicators

This indicator is a combination of 2 classical indicators: MA and CCI. Two moving averages form Upper and Lower bands. The input parameter counted_bars determines on how many bars the indicator's lines will be visible. The input parameter barsNum is used for MA and CCI calculation.

This indicator is using 2 classical indicators: Commodity Channel Index from the higher TF (which you may change using input parameter TimeFrame ) and Average True Range from the current TF. The Green ribbon indicates the upper trend and the Red ribbon indicates the down trend. Buy when the Yellow line crosses the Upper bound (Aqua line). Sell when the Yellow line crossover the Lower bound (Aqua line).
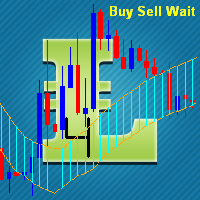
The input parameter counted_bars determines on how many bars the indicator lines will be visible. The input parameter barsNum is the period for bands calculation. When PriceClose for previous bar is above upper band a Long position may be opened. When PriceClose for previous bar is under lower band a Short position may be opened. If the current Price is between bands it is time to wait.

Este é um ZiGZag muito rápido e não redesenha; suporta a virada dos segmentos em ruptura de níveis de preços localizados a uma distância especifica (parâmetro H) a partir do extremo atual. O parâmetro MinBars define a profundidade do histórico para desenhar o indicador; 0 significa plotar o indicador sobre a histórico total. O parâmetro SaveData permite escrever as coordenadas dos extremos para arquivo (em formato de datahora e preço). Algumas estatísticas calculadas com base no ZigZag são apres
FREE

Ultimate MTF Support & Resistance - 5 Star Best Seller New Year Sale - Save $20 (normal price $79) Beginner or Professional our best selling multi-timeframe Pivot Prof will enhance your trading and bring you great trade opportunities with the Support and Resistance levels that professionals use. Pivot trading is a simple effective method for entering and exiting the market at key levels and has been used by professionals for decades and works on all symbols: Forex, Crypto, Stocks, Indicies et

This indicator is a combination of 2 classical indicators MA and RVI. The Relative Vigor Index (RVI) is a momentum indicator used in technical analysis that measures the strength of a trend by comparing a security's closing price to its trading range while smoothing the results using a simple moving average The input parameter counted_bars determines how many bars the indicator's lines will be visible. The input parameter MaRviPeriod is used for MA and RVI calculation.

This indicator is a combination of 2 classical indicators: MA and Force Index. The input parameter counted_bars determines on how many bars the indicator lines will be visible. The input parameter MaForcePeriod is used for MA and Force calculation. You may go Long if the current price crossed Up the Ribbon (HISTOGRAM) and you may go Short if the current price crossed Down the Ribbon (HISTOGRAM)

This is a self-explanatory indicator - do nothing when the current price in the "fence" (flat) mode. Definition of a flat market: A market price that is neither Up nor Down. The input parameter counted_bars determines on how many bars the indicator's lines will be visible starting from the current Bar backward. The input parameter barsNum is used as a Period for aqua "fence" calculation.
Since a flat price stays within the same range and hardly moves, a horizontal or sideways trend can negatively affect the trade position A flat can also refer to a trade in which the currency pair has not moved significantly up or down and, therefore, has no large gain or loss attributed to the forex trading position. This Indicator is created for a M15 time frame.
The Zero-Line means a flat market.
The positive and negative impulses indicate the Long and Short movements accordingly.
Fibonacci sequence is defined by integer sequence: 0, 1, 1, 2, 3, 5, 8, 13, 21, 34, 55, 89, 144, ... By definition, it starts from 0 and 1, the next number is calculated as a sum of two previous numbers. Instead of the standard moving average, the indicator uses the following calculation of average price: Bar0 + Bar1 + Bar2 + Bar3 + Bar5 + Bar8 + Bar13 + Bar21 + ...
Input parameters FiboNumPeriod_1 - numbers in the following integer sequence for Fibo Moving Average 1. nAppliedPrice_1 - Close pr

Description Heiken Ashi Pivot is a universal color multicurrency/multisymbol indicator of the Pivot Points levels systems on Heiken Ashi candlesticks. You can select one of its three versions: Standard Old Standard New and Fibo . It plots pivot levels in a separate window. The system will automatically calculate the Pivot Point on the basis of market data for the previous day ( PERIOD_D1 ) and the system of support and resistance levels, three in each. It can also display price tags for

This indicator is based on the same idea as https://www.mql5.com/en/market/product/2406 , but instead of Average Bars it uses series or Fibonacci sequence. When the previous Price Close is above the previous indicator Bar, the probability to go Long is very high. When the previous Price Close is under the previous indicator Bar, the probability to go Short is very high.

This indicator is based on two ideas: Correlations between 5 main currency pairs: EURUSD, GBPUSD, USDCHF, USDJPY, USDCAD; US Dollar Index = the value of the United States dollar relative to a basket of foreign currencies. The use of the indicator is the same as classical Commodity Channel Index (CCI) indicator. CCI is calculated with the following formula: (Typical Price - Simple Moving Average) / (0.015 x Mean Deviation) (Typical Price - Simple Moving Average) / (0.015 x Mean Deviation)

A tick is a measure of the minimum upward or downward movement in the price of a security. A tick can also refer to the change in the price of a security from one trade to the next trade. This indicator will show amounts of ticks when the price goes up and down. This indicator is designed for M1 time frame and shows: Sum of points when the price goes up (Green Histogram). Sum of points when the price goes down (Red Histogram).
This indicator is based on the Fibonacci sequence. The input parameters fiboNum is responsible for the number in the integer sequence. The input parameter counted_bars determines on how many bars the indicator's lines will be visible. When the previous Price Close is above the previous indicator Bar, the probability to go Long is very high. When the previous Price Close is under the previous indicator Bar, the probability to go Short is very high.
Description The indicator is intended for labeling the chart using horizontal levels and/or half-round prices on Heiken Ashi chart in a separate window. The indicator may be used with any broker, irrespective of the name of the financial instrument since it is necessary to manually enter the name as an input parameter. If you enter a non-existent or incorrect name of a financial instrument, you will receive an error message that this financial instrument is unknown (does not exist). A user can c
Description Heiken Ashi Multicurrency is a colored well-known multicurrency/multy-symbol indicator. It shows a financial instrument as a smoothed candlestick chart in a separate window below the chart of the main financial symbol. The indicator may be used with any broker, irrespective of the name of the financial instrument since it is necessary to manually enter the name as an input parameter. If you enter a non-existent or incorrect name of a financial instrument, you will receive an error m
O Mercado MetaTrader contém robôs de negociação e indicadores técnicos para traders, disponíveis diretamente no terminal.
O sistema de pagamento MQL5.community está disponível para todos os usuários registrados do site do MQL5.com para transações em todos os Serviços MetaTrader. Você pode depositar e sacar dinheiro usando WebMoney, PayPal ou um cartão de banco.

Você está perdendo oportunidades de negociação:
- Aplicativos de negociação gratuitos
- 8 000+ sinais para cópia
- Notícias econômicas para análise dos mercados financeiros
Registro
Login
Você concorda com a política do site e com os termos de uso
Se você não tem uma conta, por favor registre-se