 MetaTrader 5
 Experts
 Indicadores
 Bibliotecas
 Utilitários
 Widgets
 Regras
Conheça o Mercado MQL5 no YouTube, assista aos vídeos tutoriais
Como comprar um robô de negociação ou indicador?
Execute seu EA na
hospedagem virtual
hospedagem virtual
Teste indicadores/robôs de negociação antes de comprá-los
Quer ganhar dinheiro no Mercado?
Como apresentar um produto para o consumidor final?
Novos Indicadores Técnicos para MetaTrader 4 - 169
 É com base nos sinais de indicadores técnicos listados abaixo que você pode aplicar as decisões para abertura ou fechamento de uma transação na plataforma MetaTrader 4.
O funcionamento dos indicadores reside na previsão de mudanças de preço, com base na conversão matemática de preço e/ou volumes de um instrumento financeiro.
É com base nos sinais de indicadores técnicos listados abaixo que você pode aplicar as decisões para abertura ou fechamento de uma transação na plataforma MetaTrader 4.
O funcionamento dos indicadores reside na previsão de mudanças de preço, com base na conversão matemática de preço e/ou volumes de um instrumento financeiro. 
This is a special edition of the On-Balance Volume indicator based on pseudo-real volumes emulated from tick volumes. It calculates a near to real estimation of trade volumes distribution for Forex instruments (where only tick volumes are available) and then applies conventional OBV formula to them. Volumes are calculated by the same algorithm that's used in the indicator TrueVolumeSurrogate . The indicator itself is not required but can be used for reference.
Parameters MAfast - fast moving av
Advanced ADX indicator that allows operating on many timeframes simultaneously! Unique indicator with the ability to display ADX charts not only on the current timeframe, but also on higher ones. The example attached shows how it is possible to see 3 ADX chart on M5, M15 and M30 timeframes respectively. This functionality allows to significantly improve the accuracy of determining the trend. The Timeframe Delta parameter specifies how much the indicator’s timeframe should be different from the t
Pipfinite creates unique, high quality and affordable trading tools. Our tools may or may not work for you, so we strongly suggest to try the Demo Version for MT4 first. Please test the indicator prior to purchasing to determine if it works for you. We want your good reviews, so hurry up and test it for free...we hope you will find it useful.
Combo Energy Beam with Swing Control Strategy: Confirm swing pullback signals Watch Video: (Click Here) Energy Beam with Trend Laser Strategy: Confirm Tre

Description Shows whether market is trending or not, to what extent, which direction, and if the trend is increasing. The indicator is very useful for trend following strategies. The indicator can also alert when the market transitions from being flat to trending, which can serve as a great entry point. The alert is controllable directly from the chart, with an on-chart tick box to enable the alert. Also includes bonus indicators of current spread and ask/bid prices in large text, color coded as
New indicator Impostol is based on the relative strength index (RSI) and trend indicator ADX. With it, you can identify a trend for your trade. Its signals are easy ti interpret, because it shows the recommended entries using up and down arrows. The indicator has a minimum of settings and is easy to use.
Impostol Expert for MetaTrader 4 — HERE
Main features Uses arrows to show market entry points. The indicator is not redrawing. Recommended timeframe is H1 and higher (lower timeframes can sh

The indicator for presenting current spread in real time. It is a very simple still useful indicator for manual trading and market analysis. The indicator shows current spread (in 4-digit format) for the selected instrument. You can specify the place on the chart where indicator shall print the output as well as output color. Please contact the author if any changes are required.

Japanese Candlesticks Monitor scans Japanese candlesticks. It shows a vertical line and a name of a probable candlestick pattern. The indicator is constantly updated, and new patterns are added. Your feedback is most welcome. I have just started working on the indicator, and your opinions are highly appreciated . The indicator does not work on history data . If the indicator has not been launched at a candle opening, that candle is not considered. This means that the indicator works in real time

This indicator is based on the classical indicators: RSI (Relative Strength Index) and PSAR (Parabolic Stop and Reverse) and will be helpful for those who love and know how to use not a visual but digital representation of the indicators. The indicator shows values from 9 currency pairs. You will be able to change the main input parameters for RSI: OverboughtLevel = 70; OversoldLevel = 30; Period = 14; Price = PRICE_CLOSE; and PSAR: step = 0.02; maximum = 0.2; Also you may change Symb1 - Symb9 t
Volume Gives Depth To Price Action! Volume Critical can accurately locate the cheapest areas to place trades. Enter reversals as early as possible to get the best Risk Reward setups!
Features Aggressive algorithm that anticipates reversals Volume Classifications Gray Histograms - Normal Volume, average market activity Orange Histogram - Trending Volume, increased market activity Pink Histograms - Overbought Volume, we can wait for further confirmation to sell Blue Histograms - Oversold Conditio

AD Trend line draws trend lines on the basis of A/D indicator (Accumulation/Distribution). When A/D indicator breaks a trend line, the probability of the trend reversal is very high. This is a multitimeframe indicator which can display values from higher timeframes. Parameters Time-frame — Select a timeframe; zero is the current timeframe of the chart; Trend Line — Display lines on the chart; Apply to — Apply lines to close the candle's highest/lowest value; Width line — Width of the line; Style
FREE
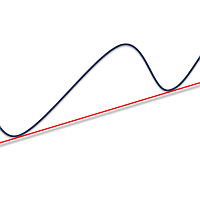
Simply drop the indicator to the graph and support and resistance levels will be shown automatically! The indicator for automatic drawing of support and resistance levels based on THREE points. Identified points are marked on the chart Indicator shows break through price for both bullish and bearish trends (if found) You can specify on how many bars the indicator shall look in order to identify supporting points. In addition, you can select on which time frame the indicator will work. That means

The indicator for automatic drawing of Fibonacci-based Moving Averages on the chart. It supports up to eight lines at a time. The user can configure the period of each line. The indicator also provides options to configure color and style of every line. In addition, it is possible to show indicator only on specific time frames. Please contact the author for providing additional levels or if you have any other suggestions.

VR MultiPrice Analysis é um indicador que determina a força de uma moeda num par cambial. Por exemplo, vamos dar uma olhada no par EUR/USD. Como descobrir qual moeda nesse par atualmente é fraca, e qual é forte? A maneira mais simples e confiável de fazer isso é comparar a moeda EUR (euro) em relação a outras moedas, excluindo a moeda USD (dólar americano). Distribuição de forças: Se o euro (EUR) está crescendo em comparação com outras moedas, então isso significa que essa moeda se tornou mais a

The Currency Barometer indicator is a unique tool that measures the strength of two currencies represented in the pair and compares the difference between them. The result is shown as a histogram where you can simply identify which currency is the strongest. This indicator is designed to measure the strengths and weaknesses of eight major currencies (USD, EUR, GBP, CHF, CAD, JPY, AUD, and NZD) and works on 28 currency pairs. The indicator uses the CI method (Commodity Channel Index) to calc
The Volume Spread Analysis indicator is based on the original Volume Spread Analysis method. It was designed for quick and easy recognition of VSA patterns. Even though this indicator looks very simple, it is the most sophisticated tool we've ever made. It is a really powerful analytical tool that generates very reliable trading signals. Because it is very user-friendly and understandable, it is suitable for every type of trader, regardless of his experience.
What is VSA? VSA - Volume Spre

The Volume Weighted ATR indicator is a helpful tool for measuring market activity. It is based on the idea of the Volume-Weighted ATR. Combining these two elements helps identify potential turning points or breakout opportunities. The indicator for the classification of the activity of the market uses the moving average and its multiples. Accordingly, where the VWATR bar is located (relative to the moving average), it is labelled as ultra-low, low, average, high, very high or ultra high. Th
FREE

Overbought describes a period of time where there has been a significant and consistent upward move in price over a period of time without much pullback. Oversold describes a period of time where there has been a significant and consistent downward move in price over a period of time without much pullback. This indicator will show the Overbought conditions (Green Bars) and Oversold conditions (Red Bars). The value of Green/Red Bars represents a power of the price movement. Input parameters numBa

Pipfinite creates unique, high quality and affordable trading tools. Our tools may or may not work for you, so we strongly suggest to try the Demo Version for MT4 first. Please test the indicator prior to purchasing to determine if it works for you. We want your good reviews, so hurry up and test it for free...we hope you will find it useful.
Combo Razor Scalper with Trend Laser Strategy: Scalp in the direction of the trend Watch Video: (Click Here)
Features Scalping indicator using a confirme
Did You Have A Profitable Trade But Suddenly Reversed? Exiting a trade is equally important as entering! Exit Scope helps maximize your current trade profit and avoid turning winning trades to losers.
Attention Exit Signals are NOT to be used in entering a trade! Exit means closing your trades to avoid correction/reversal which can wipe out existing profit or haunt break-even orders. Please watch presentation (Click Here)
Features Generates instant exit signals based on price action, volatili
When the price is moving Up/Down rapidly majority of brokers are increasing the Spread. This indicator will show the Spread for 9 currency pairs by your choice ( Yellow digits ) - you allow to change all input parameters, including changing the name of the currency pairs. This indicator also shows classical indicator RSI (Relative Strength Index) for defined currency pairs and will be helpful for those who love and know how to use not a visual but digital representation of the indicator.

The VWAP indicator is our version of the popular Volume-Weighted Average Price indicator. The VWAP is the ratio between the value traded (price multiplied by the number of volume traded) and the total volume traded over a specific time period. As a result, it measures the average price of the instrument much better than the simple moving average. Although there are many ways to use the VWAP, most investors use it to calculate the daily average.
The indicator works in five modes: Moving -

The EA in the form of histogram displays up and down trends. This tool is recommended to be used as a filter. Its readings will help to detect beginning, end, and continuation of a trend. This additional tool will suit any trading system. Parameters Period — indicator period; Bars — number of bars on the history.
FREE
X-Lines 2.0 Pro I want to present for your attention a new and completely updated and expanded version of X-Lines indicator. Version 2.0 Pro has many new features and can make your analysis more productive.
Please read full instructions here .
Please before purchasing try free version.
Free and limited version (you can set only one alert): here
1) Multi-timeframe settings and user-friendly control panel. You can dynamically select and save indicator settings not only for each currency pairs
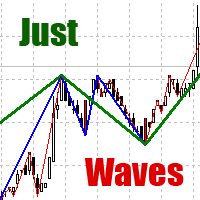
Among various methods of technical analysis of the Forex market, wave analysis used to be the basic one. Anyway, when it comes to the price change over a period of time, we are dealing with waves. According to Elliott's theory, waves are formed in a fractal way. On the same principle MT4 indicator "Just Waves" marks up waves of different levels (up to 8) and creates graphic lines that indicate the beginning and ending points of the waves. "Just Waves" offers an objective criterion of a wave, the
The indicator displays trend reversal in the form of arrows. The indicator does not change its values (is not redrawn) after a signal. The program notifies about arrows by means of a pop-up window, or sending notification to e-mail. This is a multitimeframe instrument. Values of the indicator may be displayed from higher timeframes.
Parameters Time-frame - select time session; zero is the current timeframe (Time-frame cannot be lower than the current time interval). Bars - number of bars on the
This indicator displays each bar's volume in points as a histogram. The second version of the indicator. Now it is represented as an oscillator. It is more informative and functional. At that it does not load the main chart. GitHub It displays: bar's volume in points as a histogram (buffer 0) average value of the volume for the whole period (buffer 1) bars upper than the client average value with another color (buffer 2) average value of the amount of bars set by a user (buffer 3) Also: setting
FREE

The indicator determines overbought/oversold zones on various timeframes. Arrows show market trend in various time sessions: if the market leaves the overbought zone, the arrow will indicate an ascending trend (arrow up), if the market leaves the oversold zone, the arrow will indicate a descending trend (arrow down). Situation on the timeframe, where the indicator is located, is displayed in the lower right window. Information on the market location (overbought or oversold zone), as well as the
FREE
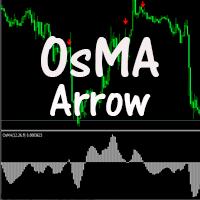
The indicator displays crossing zero level by Moving Average of Oscillator (OsMA) in the form of arrows. The indicator notifies about a signal by means of a pop-up Alert window, or sending notification to e-mail.
Parameters Fast EMA Period - fast EMA. This is an exponential moving average from a price with a short period. Slow EMA Period - slow EMA. This is also an exponential moving average of a market price but with a longer period. Signal SMA Period - MACD SMA. This is a signal line which is
FREE

N Money Management With this adviser, you won't loose your daily drawdown. Show the account actual leverage. Show the whole entry history on the chart. Calculate the moneymanagement (Risk Management to minimize the drawdown). Settings ShowEntryHistory: show all history entry line. ShowOpenArrow: show order open price. ShowAccountInfo: show the display text. calcLotPerEquity (e.g: 50) with equity of 100$ >> 100/50 = 2 >> 2x0.01 Lot = 0.02 Lot advised. priceOnePipInOneLot: input your broker price
The indicator builds levels from beginning of a week or a month, or according to local Highs and Lows. These levels are meant for detection of strong support and resistance levels on a chart. Most big players of the market are guided by particularly these data: opening of the week or opening of the month. Breakout of one or several Highs and price consolidation on these levels suggest that market intends to grow. Breakout of Lows and price consolidation bears evidence of market's intention to mo

Any chart has patterns of consolidation which are also called accumulation patterns. These are sections where the market has been on the same price level during significant amount of time, and thus it was accumulating positions. After such accumulation, positions are distributing, and the market passes from flat into trend. The Consolidation Levels indicator is a professional tool which identifies these sections and builds levels according to the price of the market at the moment of consolidatio
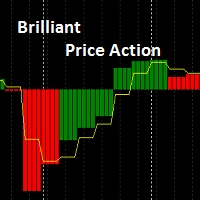
Brilliant Price Action Brilliant Price Action Indicator is a leading Indicator that does not repaint . It can be calculated on a time frame and represented on another time frame. It can be used in trend identification from higher time frames OR for Entry on lower time frames. Moving average modes are: 0 = Simple moving Average. 1 = Exponential moving Average. 2 = Smoothed moving Average. 3 = Linear Weighted moving Average.
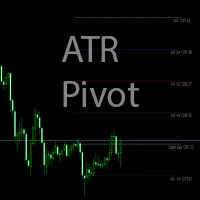
The indicator calculates the levels by ATR daily range using the equations: 1AR = Open + ATR -1AS = Open - ATR AR 1/2 = Open + (ATR / 2) AS -1/2 = Open - (ATR / 2) AR 1/4 = Open + (ATR / 4) AS -1/4 = Open - (ATR / 4) AR 3/4 = Open + ((ATR*3) / 4) AS -3/4 = Open - ((ATR*3) / 4) AR 2 = Open + (ATR*2) AS -2 = Open - (ATR*2) Parameters Period ATR - ATR period
Shift time - shift by time for Open Color opening of day - Open line color
Color 1AR, -1AS - 1AR, -1AS line color
Color AR 1/2, AS -1/2 - AR 1
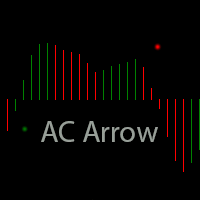
The indicator displays zero level Accelerator Oscillator (AC) crossover in the form of dots on the chart. In indicator settings one can specify number of bars in the history to display signals, as well as shift of dots with respect to a bar. Parameters Bars — number of bars in the history to display indicator's signals; Shift — shift of dots with respect to bars.
FREE
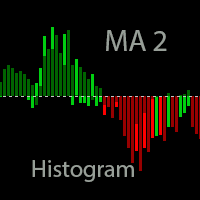
The indicator is based on two Moving Averages. Its only difference from traditional indicators is that it is presented as a histogram. The histogram has four colors; each color represents a MA with its own period. In case of a descending trend, if a price is lower than a moving average, the indicator displays a value lower than the red zero level. In case of ascending trend, the indicator value is higher than the green zero level. Parameters: Period MA 1 - Period of the first moving average. MA
FREE
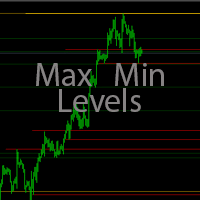
The indicator makes levels according to local maximums and minimums of a week, a month, or a year. Parameters: Week number - number of weeks for lines display Week level color - Week line color Month number - number of months for lines display Month level color - Month line color Year number - number of years for lines display Year level color - Year line color Width line - Width of lines Style line - Style of lines
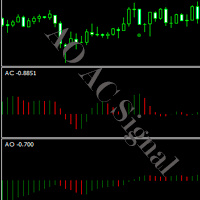
The indicator displays signals of different indicators (which can be selected in parameters) on a chart when zero level is crossed. AO, AC or AO+AC if signals of two indicators coincide. The indicator shows an Alert message (pop-up window) when a signal appears. Parameters: Indicators - Selection of the indicator AO, AC, AO+AC. Bars - Number of bars in history for display of signals. Alert - Pop-up window in case of a signal.
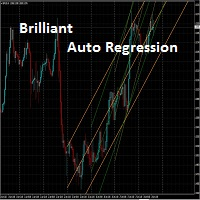
The indicator automatically draws up to five different regression channels. The product draws the channels for the previous major periods. For example : Indicator Chart Drawing Period
M1
D1
M5 D1
M15 D1 M30 D1 H1 D1 H4 W1 It updates itself at the beginning of the major period (ex.: D1 or W1). The periods are in the major period domain. For example : if the indicator is put on H1 chart, the period of 1 means 1 day on the chart.
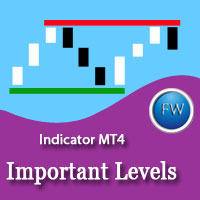
The main rule of the profitable trading is opening trades in the direction of a trend. You can define the current trend using fractal analysis. Important Levels ResSup displays important price levels on the chart. The breakthrough of those levels shows the price direction. The data panel allows you to track the current trends on all timeframes. The current timeframe's important level values are shown in the comments. The indicator can be useful for traders working by levels. It can also be a par

The Volume indicator is an excellent tool for measuring tick volume or real volume activity. It quickly and easily helps traders evaluate the volume's current size. The indicator for classification of the volume size uses the moving average and its multiples. Accordingly, the area where the volume is located (relative to the moving average) is labeled as ultra-low, low, average, high, very high, or ultra-high. This indicator can calculate the moving average by four methods: SMA - Simple Mov

The ATR indicator is a helpful tool for measuring the range of bars. It quickly and easily helps evaluate the ATR's current spread (range), which is especially useful for VSA traders. The indicator for classifying the range of bars (candles) uses the moving average and its multiples. Accordingly, the area where the volume is located (relative to the moving average) is labeled as ultra-low, low, average, high, very high, or ultra-high. Our ATR indicator is rendered as a histogram. This indicator
This indicator shows the lateral movement of the price when the indicator line corresponds to zero and Up/Down trend when indicator line is higher / lower than and parallel to zero-line. Of course, the moment when the indicator line is crossing the zero-line is the best moment to enter the market. This indicator has no input parameters... So, the results will be always the same for every time frame and currency pairs.
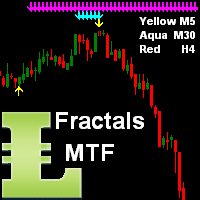
This indicator shows arrows as Support and Resistance from current time frame (Yellow arrows) and 2 higher TF by your choice (TF2 = Aqua arrows, TF3 = Magenta arrows and TF4 = Blue arrows). When all 3 color arrows are appearing in the same place then this is a good time to enter a new position.
Inputs NumOfBars - number of Bars where the indicator will show all arrows; DistanceArrow - you can increase the distance (vertically) between arrows especially on higher TF.
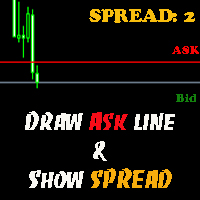
The indicator helps you to draw Ask line on the current chart and show the current spread. So, it helps you to do scalping trade easier. See the video below. It shows you how it works. Parameters line_color – Ask line color
text_size – text size of spread value text_color – color of spread value Thank you! If you have any question, please contact me via Skype: cuongph149, or email: hungcuongkhmt51@gmail.com

The [GRAFF] III manual trading system is based on multiple MetaTrader (MT4) indicators. Together, the entire PACK of GRAFF III indicators makes an advanced trading tool. The system consists of over 20 different custom-built indicators which have been carefully selected and tested in the long term to produce strong and efficient trading signals. The particular indicators are based on different mathematical formulas, so the entire system is calibrated to remove false signals from its own indicator

This indicator is based on the classical indicator RSI (Relative Strangth Index) and will be helpful for those who love and know how to use not a visual but digital representation of the indicator. All TimeFrames RSI MT4 indicator shows values from each timeframe. You will be able to change the main input parameters for each RSI for every TF. Example for M1: sTF1_____ = "M1"; Period1 = 14; Price1 = PRICE_CLOSE.
XP Moving Average – Your All-in-One Trading Powerhouse Master the markets with XP Moving Average , the ultimate moving average indicator for MetaTrader 4. Whether you’re scalping , swing trading , or investing long-term , this versatile tool combines 9 advanced moving averages in one—enhanced with a modern graphical dashboard and real-time alerts . With AI-powered insights coming soon , XP Moving Average is your key to smarter, more profitable trades . Why Choose XP Moving Average? 9-in-1

Knowledge of the strength and weakness of each currency is vital for every forex trader. Our Currency Strength Meter indicator measures the strength of eight major currencies (USD, EUR, GBP, CHF, JPY, CAD, AUD, NZD) by using the Relative Strength Index indicator, also known as RSI. The Currency Strength Meter indicator shows you, simply and quickly, when a currency is oversold, overbought, or in "normal area". This way, you can identify which currency is the strongest and the weakest.
Our
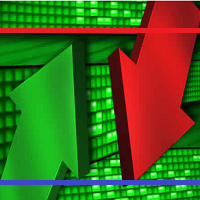
Waddah Attar Binary Support and Resistance Indicator. This indicator draws on chart very powerful Support and Resistance levels. It calculate these levels based on price binary values. Stronger levels are drawn in Blue Color and Red Color in more width. You can change the color and width for these levels from the indicator properties window. This indicator works only on five-digit symbols.

This indicator will be very useful for a research of a trading strategy system. The MACD Control Panel is based on the very popular Relative Strength Index indicator. You will be able to change the indicator parameters FastPeriod , SlowPeriod , SignalPeriod and Apply Price by clicking on the Up ( /\ ) and Down ( \/ ) buttons. Sometimes, when you will open a rarely used currency pair or timeframe the indicator will not show its value. In this case you should use button " 0 ".

ATR on Prices is simply an ATR indicator that plot a line for Resistance and Support using the Average True Range calculation. You can set the ATR daily periods, to be calculated. As well you can set the reference price to add and subtract the ATR measure to obtain the ATR Top and ATR Bottom lines, using the Open Price (that is fixed) or the Middle (HL/2) price (that will vary on the day) Or adding the ATR to the daily low and subtracting it from the daily high . You can use full ATR measure or
FREE

"Make it Horizontal" will convert any trendline to horizontal by just selecting it and then pressing the H key. This tool must be included in your charts as an indicator. It has no inputs, just drag it to your charts and that's it! I created this tool because the MT4 doesn't have any built-in feature like this. How many times have you drawn a line and you need to double click it in order to configure the start and end price level so you can make it horizontal? Well, that's not an issue anymore!
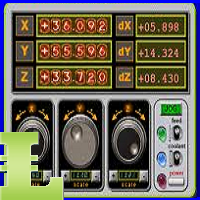
This is a Control Panel for major indicators: ATR, CCI, RSI, RVI, Stochastic and MACD. You have the ability to change any input parameters for each indicator. For example: ATR atrPeriod = 13; atrColor = Yellow; CCI cciPeriod = 13; cciPrice = PRICE_CLOSE; cciColor = Aqua; This indicator will be helpful for those who like to use many indicators before any decision making.
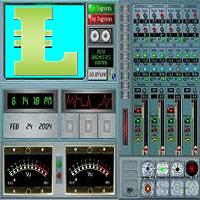
This is a Control Panel for major chart indicators: Moving Averages, Bollinger Bands, Envelopes, PSAR and Fractals. You have the ability to change any input parameters for each indicator. For example:
MA maPeriod = 13; ma_method = MODE_SMA; app_price = PRICE_CLOSE; maColor = Yellow; Bands bbPeriod = 20; bb_dev = 2; bb_Price = PRICE_CLOSE; bbColor = Aqua; This indicator will be helpful for those who like to use many indicators before any decision making.
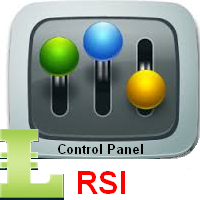
This indicator will be very useful for a research of a trading strategy system. The RSI-ControlPanel is based on the very popular Relative Strength Index indicator. You will be able to change the indicator parameters Period , Apply Price, HighLevel and LowLevel by clicking on the Up ( /\ ) and Down ( \/ ) buttons. Sometimes, when you will open a rarely used currency pair or timeframe the indicator will not show its value. In this case you should use button " 0 ".
Description The product draws lines on the chart to show daily support, resistance and pivot plus weekly and monthly pivot. An alert can be set when the price reaches one of the lines or the price closes above/below it. This can be useful for both entry and exit. The alerts can be controlled interactively directly from the chart.
The product also includes bonus indicators of Average Daily Range (or Average True Range - configurable), current spread and ask/bid prices in large text, color coded a
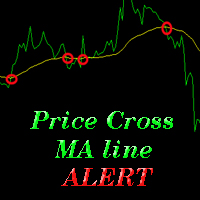
The indicator alerts you when the market price crosses MA line. You can choose any MA line to use via the parameter input tab (see the screenshot below). Parameters (the same as the four parameters you have to choose when you add MA line on a chart): ma_period ma_shift ma_method (0=Simple; 1=Exponential...) ma_apply (0=Close; 1=Open; 2=High; 3=Low...) When the price crosses MA line, it will alert you with a message looking as follows: "Price crossing DOWN MA line, pair: EURUSD Period: 60" or "
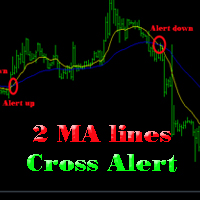
The indicator help you to do alert when two MA lines cross action You can choose all parameters for two these MA lines to use via parameter input tab (see screenshot below).
Parameters Same as 4 parameters you have to choose when you add MA line on chart. Fast MA: ma1_period ma1_shift ma1_method (0=Simple; 1=Exponential...) ma1_apply (0=Close; 1=Open; 2=High; 3=Low...) Slow MA: ma2_period ma2_shift ma2_method (0=Simple; 1=Exponential...) ma2_apply (0=Close; 1=Open; 2=High; 3=Low...) When f
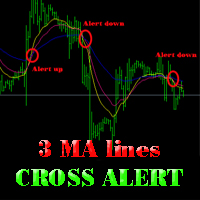
The indicator alerts you when 3 MA lines cross UP/DOWN (see the screenshot below). You can choose all parameters for these 3 MA lines to use via parameter input tab.
Parameters Same as 4 parameters you have to choose when you add MA line on the chart. Fast MA: ma1_period ma1_shift ma1_method (0=Simple; 1=Exponential...) ma1_apply (0=Close; 1=Open; 2=High; 3=Low...) Medium MA: ma2_period ma2_shift ma2_method (0=Simple; 1=Exponential...) ma2_apply (0=Close; 1=Open; 2=High; 3=Low...) Slow MA:
This panel will be very useful for a research of a trading strategy system. The MA-ControlPanel is based on the very popular Moving Averages indicator. You will be able to change the indicator parameters: Period , Shift , Method and Apply Price by clicking on the Up ( /\ ) and Down ( \/ ) buttons. You may choose your favorite colors using parameters BackGround, maColor1 and maColor2. Sometimes, when you will open a rarely used currency pair or timeframe the indicator will not show its value. In

Description Shows Heikin-Ashi candles (often misspelled Heiken-Ashi) on the chart and can alert when candles change color. The alert is useful for both entry and exit. The number of candles of the new color before an alert is raised can be set. The alert can be controlled interactively, directly from the chart. Also includes bonus indicators of current spread and ask/bid prices in large text, color coded as price changes. Usage Heikin-Ashi candles give a much better insight to the underlying tre

Pivots is an indicator to show pivots for relevant time frames. Besides the pivots the indicator can also show daly open line, the resistance and support levels, the ADR Fibonacci levels and the order of the pivots. Pivots includes an intelligent algorithm to eliminate Sunday candles, but only if your broker provides those. Pivots are significant price levels that may serve as support, resistance or breakout levels Settings textFont - font to use for the labels. textSize - font size. textColor -

O indicador "Two Moving Average Crossover" para MetaTrader 4 (MT4 é uma ferramenta de análise técnica que apresenta duas médias móveis e notifica quando as médias móveis se cruzam. O indicador calcula e traça duas médias móveis, uma das quais é mais rápida e a outra é mais lenta. Quando a média móvel mais rápida se cruza acima da média móvel mais lenta, é considerada um sinal de alta, indicando uma potencial inversão de tendência ou o início de uma nova tendência de alta. Pelo contrário, quando

Crossing of market price and moving average with all kinds of alerts and features to improve visualization on the chart.
Features Crossing of market price and Moving Average (MA) at current bar or at closing of last bar; It can avoid same signals in a row, so it can allow only a buy signal followed by a sell signal and vice versa; MA can be set for any of the following averaging methods: Simple Moving Average (SMA), Exponential Moving Average (EMA), Smoothed Moving Average (SMMA), Linear-weigh
The indicator shows you time remaining till completion of the current candlestick of any timeframe you chose, showing struct (see details). Minute: second. The indicator has 3 parameters: TF - this parameter will help you choose timeframe you want, for example, if you want to show remaining time for M30, set TF=30. If you want to show remaining time of the current period you are seeing on chart, set TF=0 (like in default). Local - this parameter will help you choose location on the chart where t

The indicator of a Professional Trader is an arrow indicator for predicting the direction of price movement. I have been working on this indicator since 2014.
You can use this indicator as your main indicator, use its entry signals, and use it as your only indicator to find entry points.
About the product: Recommended TF [H4-D1-W1] . The indicator predicts the direction of the next candle. Fits a variety of tools; Flexibility in settings for different instruments and intervals through the MO

Zig Zag Swing Detector is a talking indicator tool, that let you track new highs and lows using Zig Zag patterns and allows you to react to new highs and lows. For example for uptrend each time there is higher hi spotted, the strength of the trend is increased. Trend is ended with lower low than the previous one. Be notified by Alerts, Speech and Notifications and be alerted about new highs/lows! You can also setup conditions to open trades automatically on new heights. Speech synthesis allows y

The indicator shows you buy/sell signals and does not repaint. It works well with almost all pairs, while the best ones are GBPUSD, XAUUSD and EURUSD. The product works better on H1 and H4. You can change the parameters in the inputs tab to get the best signals and the best trade results on each pair. You can enable/disable alerts when signal appears. The indicator is easy to use.
Parameters barstrip & Sensitive: amount of bars to process the highest and lowest prices (relates to the internal l

This indicator is based on the classical indicator Parabolic SAR and will be helpful for those who love and know how to use not a visual, but digital representation of the indicator. All TimeFrames PSAR MT5 indicator shows values from each timeframe (M1, M5, M15, M30, H1, H4, D1, W1 and MN1). You will be able to change the main input parameters for each Stochastic from every TF. Example for M1: sTF1 = M1 pStep1 = 0.02 pMax1 = 0.2

TMA Currency Meter is the ultimate currency meter. Based on the Triangular Moving Average of all available symbols, this indicator shows which currencies are strong, strengthening, weak or weakening. Experienced as well as novice traders will see the strong and weak currencies in the blink of an eye, and know which trade possibilities to explore further. TMA Currency Meter is a true Multi Timeframe indicator. It is easy to show the currency strengths for a higher timeframe than the chart timefra
O Mercado MetaTrader contém robôs de negociação e indicadores técnicos para traders, disponíveis diretamente no terminal.
O sistema de pagamento MQL5.community está disponível para todos os usuários registrados do site do MQL5.com para transações em todos os Serviços MetaTrader. Você pode depositar e sacar dinheiro usando WebMoney, PayPal ou um cartão de banco.

Você está perdendo oportunidades de negociação:
- Aplicativos de negociação gratuitos
- 8 000+ sinais para cópia
- Notícias econômicas para análise dos mercados financeiros
Registro
Login
Você concorda com a política do site e com os termos de uso
Se você não tem uma conta, por favor registre-se