Conheça o Mercado MQL5 no YouTube, assista aos vídeos tutoriais
Como comprar um robô de negociação ou indicador?
Execute seu EA na
hospedagem virtual
hospedagem virtual
Teste indicadores/robôs de negociação antes de comprá-los
Quer ganhar dinheiro no Mercado?
Como apresentar um produto para o consumidor final?
Novos Indicadores Técnicos para MetaTrader 4 - 83

As you know, the main invariable indicator of all traders is the moving average; it is used in some way in most strategies. It is also obvious that this indicator is capable of showing good entries in every local area. For which it usually needs to be optimized or just visually adjusted. This development is intended for automatic optimization of the indicator. Once placed on the chart, the indicator will automatically re-optimize itself with the specified period ( PeriodReOptimization ) and dis
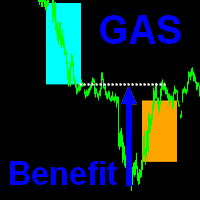
The indicator is based on the principle of closing the Gap of the American trading Session ( GAS ).
How is the Intersession Gap formed? A time interval is formed between the closing of a trading session and the opening of a new one (the next day) about 15 hours, during this time the price may deviate from the closing price in any direction. It is noticed that such deviations in 95% of cases are temporary and the price returns to the closing point of thesession. What does the indicator do? The

The King of Forex Trend Cloud Indicator is a trend following indicator based on moving averages. The Indicator is meant to Capture both the beginning and the end of a trend. This indicator can be used to predict both short and long terms market trends. The king of Forex Trend Cloud if paired together with the King of Forex Trend Indicator can give a broad picture in market analysis and forecasts. I have attached images for both the The king of Forex Trend Cloud on its own and The king of Fore

Idea: RSI ( Relative Strength Index) and CCI ( Commodity Channel Index ) are powerfull to solved the market. This indicator has Smoothed Algorithmic signal of RSI and CCI. So that, it separates the market into buy and sell zones, these areas are marked with arrows, red for downtrend, green for uptrend. This algorithm has the effect of predicting the next trend based on the historical trend, so users need to be cautious when the trend has gone many candles. Please visit screenshots

The Extremum Average signal indicator works on all timeframes and any markets. Analyzes the smoothed data of extremums and gives signals to sell or buy.
The indicator has only two settings: Number of Bars - the number of last bars to search for an extremum Period Average - Period (number of last bars) for data smoothing For each timeframe and market, you need to select its own values. Additionally, in the indicator settings, you can set your own style of signal display: Size Arrow Code Arrow B

The QRSI indicator is one of the most important and well-known indicators used by traders around the world. All signals are generated at the opening of the bar. Any closing price or zero bar prices are replaced with the corresponding price of the previous bar in order to avoid false results. This indicator is suitable for those who are interested in the classic calculation method but with improved functionality. There is a version for both MT4 and MT5.
By its nature, the QRSI indicator is

The Dictator indicator is based on the process of detecting the rate of change in price growth and allows you to find points of entry and exit from the market. a fundamental technical indicator that allows you to assess the current market situation in order to enter the market of the selected currency pair in a trend and with minimal risk. It was created on the basis of the original indicators of the search for extremes, the indicator is well suited for detecting a reversal or a large sharp jer

"Capture the sleeping and waking alligator." Detect trend entrance/exit conditions - this indicator can also be tuned according to your trading style. You can adjust a confidence parameter to reduce false positives (but capture less of the trend). This is based on a modification of the Alligator indicator by Bill Williams, an early pioneer of market psychology. 2 main strategies: either the " conservative" approach to more frequently make profitable trades (at a lower profit), or the " high r
FREE

The indicator displays 4 current levels between which the price is located. The levels are calculated based on the range of the previous day. The number and value of levels is arbitrary and expressed as a percentage. The position of the levels is calculated from the minimum of the previous day (an example can be found in the description of the parameters). It is advisable to place the levels in the settings line in order, nevertheless, the indicator will sort them by itself and if levels are fou

Powerful Trading Tool for Your Desired Results This tool can help you achieve the trading results you want. It's a 2-in-1 solution, suitable for both Binary Options and Forex trading. Key Features: Versatility: It serves as a versatile tool for trading both Binary Options and Forex markets. Consistent Performance: The indicator demonstrates excellent performance on both Binary Options and Forex markets. Continuous Improvement: The tool will continue to be enhanced to meet evolving trading
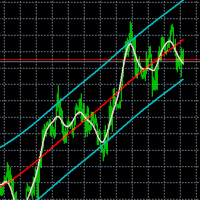
Flex channel - indicator plots channel using Hodrick-Prescott filter. Hodrick-Prescott filter is the method of avreaging time series to remove its cycling componets and shows trend. Settings HP Fast Period - number of bars to calculate fast moving average
HP Slow Period - number of bars to calculate slow moving average
Additional information in the indicator Channel width - channel width in pips at first bar MA position - fast moving average position in the channel in persentage
Close position -

Catch major price movements, early in the trend. Alerts you to enter at the likely beginning of a trend, and if it's incorrect, quickly alerts you to exit to limit any loss. Designed to capture large, profitable price movements, with early entrance to maximize your returns. As shown in screenshots, typical behavior is several quick entrance/exists with small loss , and then capture of a large trend with high profits . The Instantaneous Trend indicator is a lag-reduced method to detect pri

Artificial intelligence is a trend of the times and its power in decoding the market has been demonstrated in this indicator. Using a neural network to train the indicator to recognize trends and remove noise areas caused by price fluctuations, this indicator has obtained a reasonable smoothness for analyzing price trends. This indicator is none repaint. Suitable for day traders or longer traders *Non-Repainting (not redrawn) *For Metatrader4 Only *Great For Swing Trading *Histogram Up is Long,

Informative & optimized Zigzag, Accumulated volume, Price change A rewrite of the traditional zigzag tool with new additions. Features:- Optimized code Displays accumulated volume between peaks Displays price change between peaks Usage:- Identify trend swings Identify high volume swings Compare price changes between swings Drawing Fibonacci tool on strong price change or high volume swings
FREE

Whether trading stocks, futures, options, or FX, traders confront the single most important question: to trade trend or range? This tool helps you identify ranges to either trade within, or, wait for breakouts signaling trend onset.
Free download for a limited time! We hope you enjoy, with our very best wishes during this pandemic!
The issue with identifying ranges is some ranges and patterns are easy to miss, and subject to human error when calculated on the fly. The Automatic Range Identifi
FREE

The parabolic stop and reverse (PSAR) indicator was developed by J. Welles Wilder, Jr. as a tool to find price reversals which can be utilized as stop-loss levels as well as trade triggers. The notable difference about the PSAR indicator is the utilization of time decay. The PSAR indicator forms a parabola composed of small dots that are either above or below the trading price. When the parabola is below the stock price, it acts as a support and trail-stop area, while indicating bullish up t
FREE

"Drivers Road Bands" indicator that is designed to be used in the 1H, 4H and 1D timeframes in the most ideal way. If we compare timeframes to roads and streets; main streets and highways with high traffic volume are similar to high-time timeframes in technical analysis. If you can interpret the curvilinear and linear lines drawn by this indicator on the graphic screen with your geometric perspective and develop your own buy and sell strategies; you may have the key to being a successful trader.
FREE

Future prediction is something any trader would love to know, through this simple prediction algorithm can give a picture of the future. This algorithm is based on past data and the average prices of the data to simulate future candles. This is an indicator that will be redrawn. This indicator is completely free, can be used as a trend reference but absolutely do not use for trading.
FREE

Indicator showing the breakout after at least X candles of the same sign, followed by an opposite candle. PARAMETERS: BARS TO SHOW = Story of Indicators (0 = all bars) Consecutive Bars for Breakout = How many Bars of the same direction and after a Bar with opposite direction Minimu Point between H/L = To consider a bar valid, she must have a Minimun Hi/Lw value Minimu Point between O/C = To consider a bar valid, she must have a Minimun Open/Close value Graphics are self-explanatory
FREE

HLOC Trend Indicator This indicator helps you to determine trend direction on your trade. Default parameters for H1 time frame. You can use this indicator both bigger time frame and smaller time frame to open a trade. The calculation is based on high, low, opening and closing price values of each bar in the selected time period. When the values found in the Indicator custom formula are exceeded, the buy or sell signal falls on the screen. There are two extern inputs; RiskFactor: Early but risky
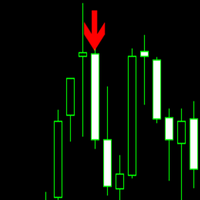
Trade trends with the Super Scalper Use on all time frames and assets it is designed for scalping trends. Works good on small time frames for day trading. The arrows are easy to follow. This is a simple no repaint/no recalculate arrow indicator to follow trends with. Use in conjunction with your own system or use moving averages. Always use stops just below or above the last swing point or your own money management system The indicator comes with push notifications, sound alerts and email
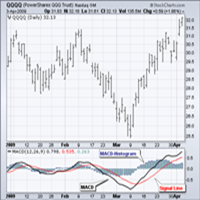
Standard MACD is the 12-day Exponential Moving Average (EMA) less the 26-day EMA. Closing prices are used to form the MACD's moving averages. A 9-day EMA of MACD is plotted along side to act as a signal line to identify turns in the indicator. The MACD-Histogram represents the difference between MACD and its 9-day EMA, the signal line. The histogram is positive when MACD is above its 9-day EMA and negative when MACD is below its 9-day EMA. Peak-Trough Divergence The MACD-Histogram anticipate

The breakout algorithm is a technique based on price, price features, to shape a breakout strategy. The strategy in this indicator will not be redrawn (none-repaint indicator), it is suitable for short or long term traders In the screenshot is the EURUSD pair, these currency pairs, commodities or stocks, it have similar strength *Non-Repainting (not redrawn) *For Metatrader4 Only *Great For Scalping *Great For Swing Trading *Arrow Entry, Green is Long, Red is Short *Works On Any Timeframe *Work

The resistance and support lines are the position where the price will have a change, be it a breakout to follow the trend or reverse. The price rule will go from support to resistance and Long's resistance can be Short's support and the opposite is true. Accurately identifying support and resistance lines is the key to being able to trade well and profitably. This indicator is based on the Fractals indicator, the indicator will be redrawn by 2 candles. *Great For Swing Trading *Blue is Support

Price breakouts, Levels, Multi-time frame Inside bars checks for price failure to break from the previous high/low and on breakout draws a breakout box on the chart. The choice of breakout price is given to the user i.e. close or high/low of bar. Alerts can be received on breakouts. Features:- Multi-time frame Alerts, notifications & emails Usage:- Breakout signals Check how price action is evolving with the help of boxes Get multi-time frame bias
Ferox Least Squares Regression is an algorithm that uses regression and is design by Ferox Quants-Labs to use method like typical quantitative algorithm, using statistics and use past data to predict the future. * None Repaint indicator * Quantitative algorithm *Great For Swing Trading * Histogram Up is Long, Down is Short *Works On ALL Timeframe *Works On Any MT4 Pair
This indicator is a simple stripped down version of any advanced support and resistance indicator. All the support and resistance indicators work from a number of bars that have developed over time. Get rid of clutter and confusing levels. Find levels according to a number of bars. Look at days, session, numbers of hours, periods of consolidation. Watch levels develop and use as breakout points, or areas of buyers and sellers. Features and things to consider This indicator is for a frame of

Please read the comment section for more introduction about indicator. ( i cant put all lines in here their is limit ) Entry conditions ---------------- Scalping - Long = Green over Red, Short = Red over Green Active - Long = Green over Red & Yellow lines Short = Red over Green & Yellow lines Moderate - Long = Green over Red, Yellow, & 50 lines
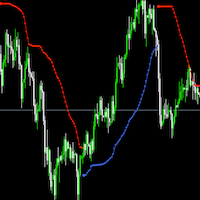
Bbandtrend 一款趋势指标,可以用来判断外汇、黄金等商品的趋势,用于辅助交易,提高交易的胜率。每个人都可以调整参数,适应不同的货币。 指标多空颜色可以自定义。 extern int Length=60; // Bollinger Bands Period extern int Deviation=1; // Deviation was 2 extern double MoneyRisk=1.00; // Offset Factor extern int Signal=1; // Display signals mode: 1-Signals & Stops; 0-only Stops; 2-only Signals; extern int Line=1; // Display line mode: 0-no,1-yes extern int Nbars=1000;
The sample on the right corner of the chart uses Font Size 20. The characters/numbers will start from the right side/corner of the chart, so that when increase the font size, the text will expand out to the left/top and won't goes to the right/bottom and get hidden. Able to change these Inputs. a. Other Symbol. Current chart symbol will always be displayed. b. Fonts. c. Font size. d. Text color (All the text label, local time, bid, ask, spread, lots, number of trades, Margin, Free Margin, Mar

O sistema PRO Renko é um sistema de negociação altamente preciso especialmente concebido para a negociação de gráficos RENKO.
Trata-se de um sistema universal que pode ser aplicado a vários instrumentos de negociação. O sistema neutraliza eficazmente o chamado ruído de mercado, dando-lhe acesso a sinais de inversão precisos.
O indicador é muito fácil de usar e tem apenas um parâmetro responsável pela geração de sinal. Você pode facilmente adaptar a ferramenta a qualquer instrumento de negocia
Indicador de Inversão de Tendência Normalizada Multi Time Frame Indicator (NTR MTF Indicator) MT4
O Indicador MTF NTR foi desenvolvido como o indicador de inversão de tendência excepcionalmente fiável. O Indicador NTR MTF adapta-se a todos os pares de moedas e metais do Forex e pode corresponder a todos os tipos de gráficos de prazos. O Indicador NTR MTF gera o sinal utilizando um cruzamento de dois sistemas de média móvel modificados, numa janela separada. Estes níveis médios são chamados Ind
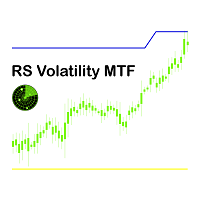
RS Indicador de Volatilidade Multi Time Frame (RS Volatilidade MTF) MT4 O Indicador de Volatilidade MTF RS foi desenvolvido como o indicador de tendência excepcionalmente fiável. O Indicador de Volatilidade do RS MTF adapta-se a todos os pares de moedas Forex e pode corresponder a todos os tipos de gráficos de prazos. O Indicador de Volatilidade RS MTF gera um sinal de tendência baseado no cruzamento de um sistema de média móvel e do preço. Considerando o ATR, o ponto de entrada exacto está a

As tendências que você vê nos gráficos nem sempre são tendências ou, mais precisamente, tendências com as quais você pode ganhar dinheiro. A questão é que existem dois tipos de tendências: 1) tendências verdadeiras que são causadas por razões econômicas fundamentais que são estáveis e, portanto, podem fornecer um lucro confiável para o comerciante; 2) e há seções de tendências falsas que apenas parecem uma tendência e surgem devido a cadeias de eventos aleatórios que desloc
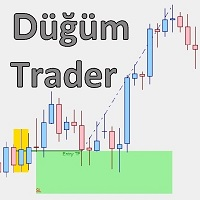
Düğüm Trader é um detector de Zona de Entrada e indicador de sugestão comercial desenvolvido e baseado em métodos progressivos de Ação de Preços de nossa equipe de P&D. Esta ferramenta ajudará o trader a ter uma visão mais profunda das áreas como potenciais Zonas de Suporte e Resistência.
O indicador tem cálculos especiais para encontrar áreas de Pedidos Pendentes de Alta Densidade como Zonas de Entrada e filtrá-las através das regras de Ação de Preço. Após a nova geração de Zona de Entrada, e

ALERTA PARA CIMA - PARA BAIXO PARA METATRADER 5
Este indicador gera um alerta quando o preço sai da zona entre as linhas UP e DOWN.
Você pode gerar alertas de vários tipos, como:
> Som
> Caixa de mensagem
> Mensagem na caixa do especialista
> Mail (previamente configurado)
> Notificações PUSH (previamente configuradas)
As linhas devem ser configuradas a partir das propriedades do indicador e não das propriedades das linhas, pois se for feito a partir das propriedades das linhas, o fin

A nova versão torna este indicador uma ferramenta completa para estudo, análise e operação de padrões probabilísticos. Suas funções incluem: Monitor de porcentagem de múltiplos ativos no gráfico. Martingales configuráveis. Vinte e um padrões pré-configurados. Um editor de padrões avançado para armazenar até 5 padrões personalizados. Modo Backtest para testar resultados com relatório de perdas. Filtro de tendência. Filtro de hits. Opção de Ciclos de Martingale. Vários tipos de estratégias e alert

The Driver trend technical indicator is used to analyze price movements in the Forex market. It is included in the so-called arrow indicators. And it is very practical in that it forms arrows in places where buy signals appear, or, conversely, sell signals.
The indicator helps to analyze the market at a selected time interval. He defines the mainstream. The Driver trend indicator makes it possible to classify the direction of price movement by determining its strength. Solving this problem hel

The Others indicator is a trend-type indicator. In those moments when you need to make a decision to enter a position and give the trader a direction. The indicator gives the trader the opportunity to visually determine which trend will be present at a particular time interval. These are auxiliary tools for technical analysis of the market. Recommended for use in conjunction with any of the oscillators.
The main application of the Others indicator is to generate buy and sell signals. Determini

The Spurts trend indicator is used to determine the strength and direction of a trend and to find price reversal points.
The trend can be ascending (bullish) and decreasing (bearish). In most cases, the trend grows for a long time and falls sharply, but there are exceptions in everything. The price movement can be influenced by economic and political news. A trend is a stable direction of price movement. To find it, the indicator uses calculations designed to smooth out sharp fluctuations that

Haine is a reversal indicator that is part of a special category of instruments. The indicator not only analyzes the price movement, but also indicates the points of possible reversals. This facilitates fast and optimal opening of buy or sell orders (depending on the current situation). In this case, the historical data of the analyzed asset must be taken into account. It is the correct execution of such actions that largely helps traders to make the right decision in time and get a profit.
Th

I suggest that everyone who is interested in the Smoking indicator try to trade.
Smoking is a technical analysis tool that uses mathematical calculations to determine various aspects of price movement and is based on historical data. Smoking reveals special aspects of price movement and allows traders to make the right decision. All trading indicators analyze the price from different angles based on historical data. Therefore, it is not entirely correct to say that they can predict the future.

Signal Alien is a handy tool if you are used to trading on a clean chart, but sometimes you need to take a look at this indicator. That is, everything is as simple as possible, positions are closed in the opposite way, that is, as soon as a signal is received to open an order in the direction opposite to your position. For example, you opened a long position (sell), close it when a red arrow appears pointing down.
If you are not sure how to determine the inflection point of the trend and are c

This indicator is good for small time frames like 1 and 5 minutes and made for day trading. The indicator never repaints or recalculates. The indicator works is for trading swing points in day trading, following bulls or bears. Its a simple to use, non cluttered indicator with a high success rate. This indicator works well to capture ranges. All indicators come with limitations and no indicator or system is always accurate. Use money management for long term trading success. Place in backte

Signal Finding is a trend indicator, a technical analysis tool that helps to determine the exact direction of a trend: either an upward or a downward movement of the price of a trading instrument. Although these indicators are a little late, they are still the most reliable signal that a trader can safely rely on. Determining the market trend is an important task for traders. With this indicator, you can predict future values. But the main application of the indicator is to generate buy and sel

RSI Scanner Plus Indicator scans RSI values in multiple symbols and timeframes. Plus trend line buffer on the chart. Features:
-Trend Line : We add trend line on the chart in the hope it help you to see current trend on the chart while following oversold and overbought from RSI. This is additional feature in the indicator. We consider that following the trend is very important in trading. -Changeable Panel Display : Change the value of Max.Symbols/Panel and the indicator will adjust the da
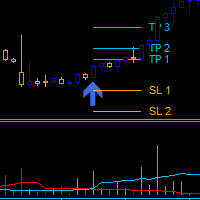
Dark Power is an Indicator for intraday trading. This Indicator is based on Trend Following strategy, also adopting the use of an histogram to determine the right power . We can enter in good price with this Indicator, in order to follow the strong trend on the current instrument. The histogram is calculated based on the size of the bars and two moving averages calculated on the histogram determine the direction of the signal
Key benefits
Easily visible take profit/stop loss lines Intui

This is a multi-timeframe multi-currency Fibo (Fibonacci levels) and Pivots scanner which also shows Missed Pivot count and Fibo Golden Ratio Zones. Features
Select separate Pivot Timeframes for each Dashboard Timeframe Check when price is near a Pivot point Check for Price Crossing Pivot Point Use Mid Pivots (Optional) Show Missed Pivots (Optional) Show High Volume Bar Use Fibo (Optional) Use Fibo Golden Ratio (Optional) Set your preferred Timeframe for Fibo or Pivots Detailed blog post:
https:
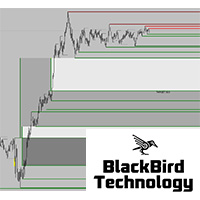
New market liquidity indicator, more accurate with two levels, will really unhide the "hidden agenda" of the price action in any timeframe. For more information about market liquidity, a manual on how to use this indicator please send me a message.
A lot of information can be found on the net. (search liquidity trading/ inner circle trader)
https://www.youtube.com/watch?v=yUpDZCbNBRI
https://www.youtube.com/watch?v=2LIad2etmY8& ;t=2054s
https://www.youtube.com/watch?v=wGsUoTCSitY& ;t=112
a tool for working with binary options well identifies the trend and possible market reversals
can be used for forex scalping
it works very well on binary options if used with oblique levels or wave analysis, it will be a good assistant in determining the entry point
recommended expiration time from 1-15 depending on the selected timeframe
the next update will add the ability to customize the tool.

Use Stochastic Oscillator (STO) Oversold and MACD < 0 show buy signal Use Stochastic Oscillator (STO) Overbought. and MACD > 0 show sell signal
Please check support resistance before opening an order. This indicator is only a helper. Can't tell you 100% right.
"Selling pigs" is a trivial matter. "Sticking on a mountain" is a challenge. Thanks you. welcome.
FREE

Master scalping with this indicator. Trade on any time frame for scalps on buy or sells. Follow trends using a 200 moving average and stops and targets. Use with your own system. This indicator can give pips if following it correctly. Stick to rules and pick up pips daily. Use as entries in a trend, scalp for a few pips or exit on opposite signal. Best to follow higher time frame trends. Indicator doesn't repaint or recalculate. Rules: Don't trade overnight, only trade during active sessi
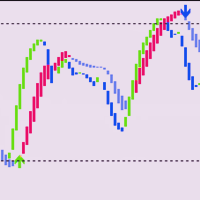
Necessary for traders: tools and indicators Waves automatically calculate indicators, channel trend trading Perfect trend-wave automatic calculation channel calculation , MT4 Perfect trend-wave automatic calculation channel calculation , MT5 Local Trading copying Easy And Fast Copy , MT4 Easy And Fast Copy , MT5 Local Trading copying For DEMO Easy And Fast Copy , MT4 DEMO Easy And Fast Copy , MT5 DEMO
Auxiliary indicators It wait s for the hunt, waits for the price limit to appear, waits for a

Smart ADR as an indicator displays the average daily range of 3 timeframes such as Daily, Weekly, and Monthly. Using the combination of 3 timeframes of ADR as a reference to shows fixed range and dynamic range targets as lines on your charts.
Inputs
Smart ADR Parameters Indicator Name - Display the indicator name Daily Periods - Display the Daily Periods of ADR Weekly Periods - Display the Weekly Periods of ADR Monthly Periods - Display the Monthly Periods of ADR Daily Line Show ON - Set T
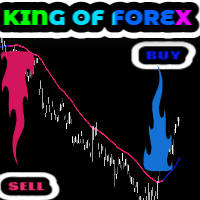
King of Forex trend indicator is a trend following indicator based on moving averages. This indicator doesn't repaint. The major function of this indicator is to show the major direction of the trend, the beginning and the end of the current trend. A bullish trend is when the indicator turns blue A bearish trend is when the indicator turns pink. This indicator is great for swing trading and day trading It works best on H1, H4, D and Weekly time-frames. It works on all pairs but it works best on

Moving Wizard indicator will guide you to work with Trend and give pure Entry point depending on crossing on the chart it work on all currency and all Timeframe you can use it daily or scalping or swing its good with all and This indicator you can make it your strategy i work on it on H1 Timframe and make a good money you can take alook on it and you see a great resault on chart .Gold moving is to Know the Trend of price other moving below it mean we looking to sell orders . if above it we loo

This is the DayTradeKing for gold on a 1 minute time frame. It is a different calculation for the range. Use a 200 period moving average as a filter. Always use stops and avoid news, wait for more conformation. This looks to capture intraday ranges. Put it in the back tester on 1 minute to see the price action and how it works. Trade with trend Use filter Use stops Alerts are added for pop ups and sound.

Breakout strategies are very popular among traders. They consist of buying an asset when it breaks above some level or selling it when the price breaks below some level. This level can be a t rend line, a previous high, a m oving average, or another indication. In the case of a box breakout, the indicator draws a box containing the highs and lows of the previous candles. LONDON BREAKOUT BOX indicator gives u alert when there is a box break out ONLY IN LONDON session when price breaks previo

with JR Trend you will able to enter and exit every trade with just a signals appear no need for any strategy just flow the indicator it work on all pairs and all Timeframe i usually take a look on higher timeframe and return to the lowest timeframe and make an order with indicator signals you can see the amazing result so you can depend only on it intraday or swing as you wish

Este indicador é apenas para gráficos XAU/USD de 1 minuto. Cada par tem características e movimentos de preços únicos.
Negocie reversões em forma de V com este indicador. O couro cabeludo compra usando stops móveis e evita notícias, pois elas são mais extremas e podem causar vendas repentinas.
Anexe a um período de tempo de 1 minuto no backtest e veja as compras de reversão. O indicador nunca redesenha ou recalcula.
NEGOCIAR APENAS DURANTE O HORÁRIO DE ATIVIDADE
Simple dashboard to view ATR value across multiple time frame, no need to click at any timeframe, we can see the overview of ATR quicker. Support changing value of ATR period. Download free! We already tested via Strategy Tester, nothing wrong. If you found something wrong just drop the comment below or contact me at site: https://youtube.com/@itwetrade
Email: itwetrade@gmail.com
--------------------------- Support for development: https://www.buymeacoffee.com/itwetrade
FREE
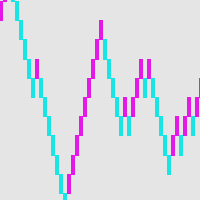
Diagrama de tijolo - uma forma alternativa de negociação Se você é um trader que está confuso com as velas em inúmeros gráficos, ou não sabe como desenhar linhas ou como desenhar linhas de suporte e resistência, você deve encontrar outro método de negociação que seja adequado para você neste momento. Assim como um driver pára para uma revisão completa depois de encontrar problemas repetidamente, o mesmo é válido para uma transação. O gráfico de blocos fornece um método de negociação simples para

SharpEntry version 2.3 - Adjust signals for each Timeframes structure.
- Allow to attach the indicator only Timeframes M1, H1, D1 for a better detection of the signal.
- Resolve a little repaint on a current price.
SharpEntry version 2.0 - Support trending mode.
- Increase arrow size.
- Fix arrow icon floating after switch Timeframe.
Como funciona?
- O indicador fornece um bom ponto de entrada.
- Está trabalhando com todos os prazos.
- O indicador desenhará o sinal de seta para compra e

BEHOLD!!!
One of the best Breakout Indicator of all time is here. Multi Breakout Pattern looks at the preceding candles and timeframes to help you recognize the breakouts in real time.
The In-built function of supply and demand can help you evaluate your take profits and Stop losses
SEE THE SCREENSHOTS TO WITNESS SOME OF THE BEST BREAKOUTS
INPUTS
MaxBarsback: The max bars to look back
Slow length 1: Period lookback
Slow length 2: Period lookback
Slow length 3: Period lookback
Slow

[ How to use the Demo version ] [ MT5 Version ] AO unpaid divergences MT4 AO unpaid divergences is the first indicator developed to detailed analyze Regular and Hidden Divergences. It uses this analysis to find out possible entry points and targets. Below some of the characteristics of this indicator: Time saving Highly customizable Working for all pairs (Crypto, Forex, Stocks, Indices, Commodities...) Suitable for Scalping or Swing trading Possible reversal swings Alerts and Notifications on

If you've not already learnt about The Strat trading strategy , go google it now. I promise it won't be a waste of your time, and you will likely learn some new tricks whether you use it or not. OK, so now you know what TheStrat is, you will be able to understand what this indicator can do for you. Key Features
In short, the Indicator will: Show Timeframe Continuity for all supported timeframes Supports two timeset views, Day trader and Swing trader Show when Full Timeframe Continuity is in pla

The indicator determines the trend and draws arrows in the direction of the transaction.
Non-repaint!
By default, the recommended parameters are set, provided that the H1 timeframe is used.
Period parameter is the main parameter that calculates the arrows.
Frequency parameter is responsible for the frequency of signals.
Bars of calculating parameter is responsible for the number of bars on which the arrows are displayed.
It is recommended to adjust the indicator for each pair and period
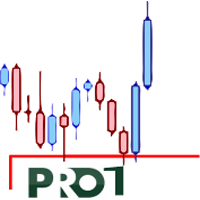
This indicator gives you a valid level The rules of trading with this indicator are like the rules of price action This level is broken only with a long bar candle or a pullback This level is valid in all time frames If you have a sharp downward or upward trend, the trend will end when the price reaches this level This is my first indicator that I put in the store and I will put some very professional indicators soon

Ing (inguz,ingwar) - the 23rd rune of the elder Futhark ᛝ, Unicode+16DD. Add some runic magic to your trading strategies. The correct marking of the daily chart will indicate to you the successful moments for counter-trend trading. Simple to use, has high efficiency in volatile areas. Be careful in lateral movements.
Signals ᛝ are generated when the main lines of construction intersect.
Red arrow down - recommended sales
Blue up arrow - recommended purchases
rare purple arrows indicate exce

Never miss a trend change again! This indicator uses various calculation methods based on price action to detect changes in the direction of the trend. It can be used on high timeframes (from H1 to D1) and is most suitable for H4 and Daily timeframe. This indicator is compatible with all broker symbols (forex, indices, CFD, commodities, crypto…). It is also possible to open the indicator on several charts to follow several symbols at the same time. In addition, you don't have to stand by your P
FREE
Você sabe por que o mercado MetaTrader é o melhor lugar para vender as estratégias de negociação e indicadores técnicos? Não há necessidade de propaganda ou software de proteção, muito menos problemas de pagamentos. Tudo é providenciado no mercado MetaTrader.
Você está perdendo oportunidades de negociação:
- Aplicativos de negociação gratuitos
- 8 000+ sinais para cópia
- Notícias econômicas para análise dos mercados financeiros
Registro
Login
Se você não tem uma conta, por favor registre-se
Para login e uso do site MQL5.com, você deve ativar o uso de cookies.
Ative esta opção no seu navegador, caso contrário você não poderá fazer login.