Conheça o Mercado MQL5 no YouTube, assista aos vídeos tutoriais
Como comprar um robô de negociação ou indicador?
Execute seu EA na
hospedagem virtual
hospedagem virtual
Teste indicadores/robôs de negociação antes de comprá-los
Quer ganhar dinheiro no Mercado?
Como apresentar um produto para o consumidor final?
Indicadores Técnicos Grátis para MetaTrader 4 - 29

O indicador exibe no gráfico a hora atual do servidor e a hora até o fechamento da barra atual. A informação pode ser muito útil nos momentos de lançamento de notícias, quando os traders esperam o fechamento do candle para iniciar a sessão de negociação. O tamanho e a cor da fonte podem ser ajustados ao seu modelo gráfico.
Sintonização: Text color -a cor do texto de exibição Text size - Tamanho do texto exibido Adicione-me como amigo para não perder as atualizações e lançamentos de novos robô
FREE

This is a trend following indicator that identifies optimal entry points in the direction of a trend with an objective stop loss to manage the trade. The indicator allows you to catch trend early and ride it. The Indicator draws resistance line as it detects an Uptrend and draws support line when it detects a Downtrend on the chart. When those levels are broken, that allows you to identify the Trend Direction and Momentum in the direction of prevailing trend which offers optimal entry points in
FREE

This indicator displays the moment when the TTF oscillator crosses the zero value, and the moment when the TTF oscillator crosses its smoothed value. Crossing the zero value by the TTF oscillator is a buy/sell signal. If the TTF oscillator crosses its smoothed value, it is a signal of a trend change. The signal is given after the end of the formation of the candle. The signal is confirmed when the price crosses the high/low of the bar on which the signal was given. The indicator does not redraw.
FREE

RCCMA is a general moving average indicator that works with ReviewCandleChart. Original is "Custom Moving Average" provided by MetaQuotes Software Corp. Based on that source code, I corresponded to ReviewCandleChart .
Advantages When ReviewCandleChart is ON, no line will be displayed on the right side from the vertical reference line. When ReviewCandleChart is ON and you press a key such as "Z" or "X" Following that, the MA is drawn. When ReviewCandleChart is OFF, the same drawing as the origi
FREE
This indicator is a combination of classic trend indicator and signals of the slow digital filter. The indicator has no configurable parameters. The signals are displayed on completed bars and are not redrawn. It shows high efficiency on periods less than 1 hour. The usage principle is intuitive - trade in the direction shown by the fan of moving averages. Enter once the price exceeds the High/Low of the bar where the signal was formed. Exit on the opposite conditions.
FREE

The Stock Exchange One Sessions Hours version 2.00
This indicator facilitates observing the currency pair's quotations during subsequent parts of the stock exchange session live. Before the session starts, a rectangle is drawn on the chart but not filled in with color. It means the extent of the session duration. Before the first bar enters the rectangle of the session, a sound signal or pop-up window will notify us that the session will just start. When the price graph crosses the edge of th
FREE
The indicator colors candlesticks of the price chart in accordance with the data of two CCI indicators from different timeframes. If both CCI indicators are above 0, the indicator paints the candle in the color that signals about price growth, and vice versa. The indicator allows to efficiently follow the trend, track short-term price rollbacks, and also to identify price reversals. The indicator does not redraw.
Settings CCI1_Period ( >1) - period of the fast CCI osc; CCI1_Price - price of th
FREE
The indicator allows you to trade binary options. The recommended time frame is М1 and the expiration time is 1 minutes. The indicator suitable for auto and manual trading. A possible signal is specified as a arrows above/under a candle. You should wait until the candle closes! Arrows are not re-painted Trade sessions: London and New York section Currency pairs: EUR/GRB Working time frame: M1 Expiration time: 1 minute The indicator also shows good results when using the martingale strategy - "
FREE

This indicator displays the moment when the TTF oscillator crosses the zero value, and the moment when the TTF oscillator crosses its smoothed value. Crossing the zero value by the TTF oscillator is a buy/sell signal. If the TTF oscillator crosses its smoothed value, it is a signal of a trend change. The signal is given after the end of the formation of the candle. The signal is confirmed when the price crosses the high/low of the bar on which the signal was given. The indicator does not redraw.
FREE
Binary Options Assistant (BOA) FLAME Signals Indicator provides signals based on the combination of: RSI, MACD & Stochastic Indicators
Stop missing trades, stop jumping from chart to chart looking for trade set-ups and get all the signals on 1 chart! U se any of the BOA Signals Indicator with the Binary Options Assistant (BOA) Multi Currency Dashboard .
All BOA Signal Indicator settings are adjustable to give you more strategy combinations. The signals can be seen visually and heard a
FREE

Features It is a demo version of All inOne indicator It works only on EURUSD, but the full version works on all currency pairs. All in One indicator is a simple indicator, it makes you know about 8 indicators in all timeframes simultaneously at a single glance. Stochastic RSI Moving Average (MA) Parabolic SAR ADX MACD CCI Last Candle (Candle) In all timeframes (M1, M5, M15, M30, H1, H4, D1, MN) at the same time.
Parameters Stochastic: PercentK : Period of the %K line. PercentD : Period of the
FREE

The indicator is based on the elements of Bill Williams' trading system. Sell signals are formed when MACD and OsMA values are falling simultaneously (Bill Williams calls these indicators АО and АС in his book), while buy signals appear when both indicators are rising. Thick and thin colored histograms match MACD and OsMA values. If the histogram is greater than 0, the indicator value is rising. Otherwise, it is falling. Positions should be opened when the price exceeds the bar's high or low, at
FREE
The presented indicator uses the Laguerre filter to build a classical type oscillator, similar in its appearance and method of application to the regular MACD. At the same time, this tool is much more flexible in settings compared to the usual MACD and, thanks to the Laguerre filter, is more sensitive to price movements. Laguerre Osc allows you to choose the parameters in such a way as to be effective for almost any market or time period. Both the crossing of its zero value by the oscillator and
FREE
The indicator marks control points on the price chart, overcoming which by the price is a signal to open a deal. At the points marked by the indicator, the maximum or minimum price values go beyond the price channel built on the basis of price values for a longer period. After overcoming such points, the price is likely to continue moving in the same direction. The indicator does not redraw and, despite its simplicity, can be quite an effective trading tool.
Adjustable parameters: i_Period
FREE
This indicator displays the moment when the TTF oscillator crosses the zero value, and the moment when the TTF oscillator crosses its smoothed value. Crossing the zero value by the TTF oscillator is a buy/sell signal. If the TTF oscillator crosses its smoothed value, it is a signal of a trend change. The signal is given after the end of the formation of the candle. The signal is confirmed when the price crosses the high/low of the bar on which the signal was given. The indicator does not redraw.
FREE
This indicator allows to hide moving average (on all MT4 timeframes) from a date define by the user with a vertical line (Alone) or a panel (with "Hidden Candles"). Indicator Inputs: MA Period MA Shift MA Method MA Apply To Information on "Moving Average" indicator is available here: https://www.metatrader4.com/en/trading-platform/help/analytics/tech_indicators/moving_average ************************************************************* Hey traders!! Give me your feeds! We are a community h
FREE

Not everyone can write an indicator. But anyone can have an idea. The indicator Universal Main Window Free , which takes as an input parameter the formula by which the indicator line will be drawn, will help to implement it. This indicator is intended for use in the main chart window.
All indicators of the series Universal :
Main window Separate window Free MT4 Universal Main Window Free MT5 Universal Main Window Free MT5 MT4 Universal Separate Window Free MT5 Universal Separate Window Free
FREE
The presented indicator is a joint application of the FATL digital filter and the Ehlers filter (J. F. Ehlers). This indicator gives reliable signals with a small delay, which makes trading based on it very effective. After receiving the signal, you should wait for its confirmation - overcoming the high/low of the bar on which the signal was given by the price.
It is recommended to pay attention to divergence or convergence signals (discrepancy in the ratio of new highs or lows on the oscillat
FREE
This indicator displays candle prices on the chart, colored in accordance with the data of the SATL digital filter built on closing prices. The indicator has no configurable parameters. Allows you to effectively follow a long-term trend. Usage: After the full formation of a candle colored in the opposite color to the previous candle, place a stop order at the high / low of such a candle. When the price overcomes such a high/low, a position will be opened. With the full formation of a candle pain
FREE
Digital filters are (simplified) a way to smooth data. Unlike traditional moving averages, a digital filter will be more effective in most cases. The presented indicator displays in a separate window in the form of a line the data of several (optional) digital filters built at different (optional) prices. The presented indicator is a simplified version of the Digital Filters AM indicator. The indicator does not redraw on fully formed bars. The indicator allows you to effectively follow the trend
FREE

CAD INDEX
The Currency Index Project is ONE part of a thorough Forex study. Many people do not know the theoretical basis that drives currency exchange rates to move on the market. With this set of tools you will be able to have a more complete view of the entire market by analyzing not only the single currency of an exchange, but all the exchange rates that make up that currency by looking at a single window!
The indicator faithfully represents the real index of a single currency present in
FREE

EUR INDEX
The Currency Index Project is ONE part of a thorough Forex study. Many people do not know the theoretical basis that drives currency exchange rates to move on the market. With this set of tools you will be able to have a more complete view of the entire market by analyzing not only the single currency of an exchange, but all the exchange rates that make up that currency by looking at a single window!
The indicator faithfully represents the real index of a single currency present in
FREE
MAS Indicator can be used in all currency pairs and at any timeframe, it is suitable for any trading speed. In addition, it's relatively easy to trade with the MAS Indicator. This indicator produces two signals: BUY Signal: arrow deep sky blue SELL Signal: arrow red
Indicator parameters MA Method – type of moving average MA Shift – shift moving average Fast - fast period moving average Slow – slow period moving average RSI – value rsi Confirm – value confirm Flat – value flat Colors - colors o
FREE

Not everyone can write an indicator. But anyone can have an idea. The indicator Universal Separate Window Free , which takes as an input parameter the formula by which the indicator line will be drawn, will help to implement it. This indicator is intended for use in the separate chart window.
All indicators of the series Universal :
Main window Separate window Free MT4 Universal Main Window Free MT5 Universal Main Window Free MT5 MT4 Universal Separate Window Free MT5 Universal Separate Wind
FREE
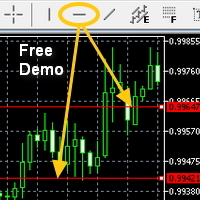
Attach the indicator on the chart and draw the red line from the button on MT4's built-in menu bar then the alert will be sent to you(push,email,popup and sound ) This demo version works only on USD/CHF
Please find the version here MT4 - https://www.mql5.com/en/market/product/43120
NT5 - https://www.mql5.com/en/market/product/43021 Hi You all know the red line (the MT4 built-in red line) drawn from the menu bar on MT5. It is often used
FREE

The Toronto Stock Exchange Session's Hours
This indicator facilitates observing the currency pair's quotations during subsequent parts of the stock exchange session live. Before the session starts, a rectangle is drawn on the chart but not filled in with color. It means the extent of the session duration. Before the first bar enters the rectangle of the session, a sound signal or pop-up window will notify us that the session will just start. When the price graph crosses the edge of the sessio
FREE
CoralPage is a simple little utility to add navigation controls to your chart. You can now easily step through the symbols in the Market Watch without having to click-and-drag a symbol from the Market Watch onto your chart. It's a simple but indispensable time-saver! Click move to the first, previous, next or last symbol in the Market Watch. Shift-click to go the the previous or next symbol that has an open order. CoralPage is completely free. If you like this, please check out my other prod
FREE

This indicator maps price crossover with Simple Moving Average (SMA) for each candle. Works like a SMA but has non-repaint characteristic. How to Use: As stated before, this indicator works like a SMA. Use this to determine trend. When price is above this line then the uptrend is expected (downtrend if price below the line). 2 of these indicator (with different periods) can also generate buy/sell signal like 2 SMAs. When the lower period SMA crosses higher period SMA from below, then buy signal
FREE

The Bombay Stock Exchange Session's Hours
This indicator facilitates observing the currency pair's quotations during subsequent parts of the stock exchange session live. Before the session starts, a rectangle is drawn on the chart but not filled in with color. It means the extent of the session duration. Before the first bar enters the rectangle of the session, a sound signal or pop-up window will notify us that the session will just start. When the price graph crosses the edge of the session
FREE
This indicator is based on the idea of a popular Trend Trigger Factor indicator (TTF). The indicator determines a price movement direction comparing high and low of the current candle with high and low of a price for a longer period.
The indicator parameters: Long_TTF_Bars - number of candles to calculate the price movement direction for a longer period of time (cannot be less than 2) Short_TTF_Bars - number of candles to calculate the price movement direction for a shorter period of time (can
FREE

This indicator is a combination of classic trend indicator and signals of the fast digital filter. The indicator has no configurable parameters. The signals are displayed on completed bars and are not redrawn. It shows high efficiency on periods greater than 1 hour. The usage principle is intuitive - trade in the direction shown by the fan of moving averages. Enter once the price exceeds the High/Low of the bar where the signal was formed. Exit on the opposite conditions.
FREE
The presented indicator marks signals on the price chart with arrows in accordance with the data of the FATL Momentum AM indicator. The indicator gives a signal and sends a notification to the mobile terminal and email. The FATL Momentum AM indicator is the difference between the current price and the price some number of periods ago. The difference from the classic indicator Momentum is the preliminary smoothing of prices by an adaptive digital filter - FATL. Confirmation of the indicator signa
FREE
The presented indicator allows you to visualize the direction of the trend while cutting off minor price fluctuations. The indicator's customizable parameter (Filter) determines the number of points for the current financial instrument that the indicator cuts off in the process of determining the trend. Despite its simplicity, the indicator can be useful for both beginners and experienced traders. The indicator marks trend reversal points and can send notifications of such signals to the termina
FREE
The indicator analyzes the difference between the current price and the standard MA data. The indicator is not redrawn on the formed bars. To confirm the signal of the indicator, it is necessary to wait for the price to overcome the high (for buying) or the low (for selling) of the bar where the indicator changed color. The indicator is easy to use and configure. The indicator is effective as an element of any trend trading strategy. Custom Parameters: MA_Period - MA period; MA_Shift - MA shift;
FREE
The indicator identifies the strength of the trend based on the points where the CCI indicator exceeds the overbought and oversold levels. This indicator: Suitable for all markets; Not redrawn; Intuitive and simple; It can be useful for both beginners and experienced traders; Allows you to identify market entry points where there is a high probability of a significant price movement sufficient for a successful transaction; Settings: Ind_Period (>1) - period of the indicator; Price - price f
FREE
The indicator identifies the strength of the trend based on the points where the RSI indicator exceeds the overbought and oversold levels. The indicator does not redraw. This indicator:
Suitable for all markets; Not redrawn; Intuitive and simple; It can be useful for both beginners and experienced traders; Allows you to identify market entry points where there is a high probability of a significant price movement sufficient for a successful transaction; Settings: Ind_Period (>1) - period of
FREE

This indicator is a combination of classic trend indicator and signals of the slow digital filter. The indicator has no configurable parameters. The signals are displayed on completed bars and are not redrawn. It shows high efficiency on periods less than 1 hour. The usage principle is intuitive - trade in the direction shown by the fan of moving averages. Enter once the price exceeds the High/Low of the bar where the signal was formed. Exit on the opposite conditions.
FREE
This indicator is a combination of classic trend indicator and signals of the fast digital filter. The indicator has no configurable parameters. The signals are displayed on completed bars and are not redrawn. It shows high efficiency on periods greater than 1 hour. The usage principle is intuitive - trade in the direction shown by the fan of moving averages. Enter once the price exceeds the High/Low of the bar where the signal was formed. Exit on the opposite conditions.
FREE
The indicator identifies the strength of the trend based on the points where the WPR indicator exceeds the overbought and oversold levels. The indicator does not redraw. This indicator:
Suitable for all markets; Not redrawn; Intuitive and simple; It can be useful for both beginners and experienced traders; Allows you to identify market entry points where there is a high probability of a significant price movement sufficient for a successful transaction; Settings: Ind_Period (>1) - period of
FREE
Technical analysis indicator described in the article by Vladimir Kravchuk: " Digital indicators in the technical analysis of financial markets ".
In the proposed version, the indicator provides two types of signals: 1. Zero crossing; 2. Change of direction. To use it effectively, it is necessary to take into account the long-term trend and open a position only in its direction. It is recommended to use signal confirmation. A signal is considered confirmed if the current price has overcome the
FREE

This version of the indicator Floating Nest works only in the tester, on demo accounts and on real accounts on the USDCHF pair.
1. What is Floating Nest?
This indicator is designed to automate the construction of decision zones (can act as support-resistance levels) according to the Floating Socket strategy.
The same indicator allows you to significantly reduce the time when analyzing the behavior of prices in decision areas on historical data.
It works on any currency pairs. Time frame
FREE
Digital filters are (simplified) a way to smooth data. Unlike traditional moving averages, a digital filter will be more effective in most cases. The presented indicator displays in the form of colored candles the data of several (optional) digital filters built at different (optional) prices. The indicator does not redraw on fully formed bars. The indicator allows you to effectively follow the trend both in the short and long term (depending on the type of filter chosen). The indicator allows y
FREE
RFTL dpl AM - (Referense fast trend line - detrended price line) indicator built on the principle of searching for discrepancies between the current real price and the calculated trend value. RFTL - a digital filter that calculates the reference line, the overcoming of which by the current price is considered a change in the short-term trend. Indicator signals: Small red dot - the price continues to fall; Small blue dot - the price continues to rise; Big red dot - the price starts to fall; Big b
FREE
This indicator displays DSS Bressert AM signals on the price chart. The calculation of DSS Bressert values is similar to the stochastic indicator. The confirmation of the indicator's signal is the overcoming by the price of the high/low of the bar on which the signal was given by the indicator. Settings: Price - the price at which the indicator is calculated; EMA_Period - smoothing period; Stoch_Period - oscillator period;
OB_Level - overbought level; OS_Level - oversold level;
FREE
The presented indicator is a reworked version of the Moving Speed Normalized indicator, authored by Roman Kiverin . The indicator provides two types of signals: 1. The histogram crosses the zero value; 2. Change of direction by the signal line. To use it effectively, it is necessary to take into account the long-term trend and open a position only in its direction. It is recommended to use signal confirmation. A signal is considered confirmed if the current price has overcome the maximum (for
FREE

Trend Master Chart é o indicador de tendência que você precisa. Ele se sobrepõe ao gráfico e usa codificação de cores para definir diferentes tendências/movimentos do mercado. Ele usa um algoritmo que combina duas médias móveis e osciladores diferentes. Os períodos desses três elementos são modificáveis. Funciona em qualquer período de tempo e em qualquer par.
Num relance você será capaz de identificar uma tendência ascendente ou descendente e os diferentes pontos de entrada nesta tendência.
FREE

PrecisionWedge Detector X
Description: PrecisionWedge Detector X is an innovative indicator designed to identify and analyze wedge patterns on financial charts with unparalleled accuracy and precision. Developed using advanced algorithms, this indicator provides traders with a powerful tool to detect potential trading opportunities based on wedge formations. Key Features: Automatic Wedge Detection: Powered by sophisticated algorithms, PrecisionWedge Detector X automatically scans price data to
FREE
Você sabe por que o mercado MetaTrader é o melhor lugar para vender as estratégias de negociação e indicadores técnicos? Não há necessidade de propaganda ou software de proteção, muito menos problemas de pagamentos. Tudo é providenciado no mercado MetaTrader.
Você está perdendo oportunidades de negociação:
- Aplicativos de negociação gratuitos
- 8 000+ sinais para cópia
- Notícias econômicas para análise dos mercados financeiros
Registro
Login
Se você não tem uma conta, por favor registre-se
Para login e uso do site MQL5.com, você deve ativar o uso de cookies.
Ative esta opção no seu navegador, caso contrário você não poderá fazer login.