Konstenfreie technische Indikatoren für den MetaTrader 4 - 29

Der Indikator ist für diejenigen nützlich, die Fibonacci-Cluster beim Handel verwenden und Konstruktionen mit verschiedenen Niveausätzen anwenden. Jeder Satz von Niveaus ist sowohl auf Retracement- als auch auf Expansionsniveaus anwendbar (wählbar in den Einstellungen). Die Levels werden durch eine Aufzählung im Format "0;50;61.8;100" angegeben. Einstellungen des Indikators: Fibonacci #1 - Level Set #1 Fibonacci - Typ der Levels : Retracement oder Expansion Levels - Set von Levels im Format "0;2
FREE

RaysFX StochRSI Wir präsentieren einen MQL4-Indikator, der von RaysFX, einem renommierten Entwickler im Bereich des algorithmischen Handels, entwickelt wurde. Dieser Indikator ist eine einfache, aber leistungsstarke Kombination aus zwei beliebten Indikatoren: RSI und Stochastic. Hauptmerkmale: RSI : Ein Momentum-Indikator, der die Geschwindigkeit und Veränderung von Kursbewegungen misst. Stochastik : Ein Momentum-Indikator, der den Schlusskurs eines Wertpapiers mit der Spanne seiner Kurse währe
FREE

MultiFiboDynamicMT4 ist ein leistungsstarker, professioneller Indikator zur Einschätzung der wichtigsten Unterstützungs- und Widerstandsniveaus. Der Hauptvorteil besteht darin, dass er die Fibonacci-Levels in allen Zeitrahmen gleichzeitig anzeigt, was dem Händler erlaubt, sich ein vollständiges Bild von der möglichen Preisbewegung des Handelsinstruments zu machen!
Vorteile des Indikators Der Indikator ist perfekt für Scalping und den Handel mit binären Optionen. Geeignet für Anfänger und erfahr
FREE

Der Range-Indikator bezeichnet die durchschnittliche tägliche Kursbewegung. Der Einfachheit halber wird er visuell auf den Charts angezeigt, allerdings mit dem Zeitrahmen H4 und darunter. Der Indikator wird täglich neu gezeichnet und die Lücken werden in die Berechnung einbezogen. Eine zusätzliche gepunktete Linie bedeutet, dass 80 % der täglichen Bewegung überschritten wurden. Ein wichtiges Instrument im Arsenal eines professionellen Händlers oder eines, der es werden will. PrimeTools ist eine
FREE

Dies ist ein unverzichtbares Tool für jeden Trader, denn dieser Indikator versorgt das Scoreboard mit den wichtigsten Basisinformationen für den Handel. Er zeigt die aktuelle Serverzeit, die verbleibende Zeit des aktuellen Balkens, ein berechnetes Lot für das angegebene Risiko und die freie Marge, charakteristische Balkengrößen und Spreads an. Wenn der Indikator auf einem Chart platziert wird, erzeugt er ein Textlabel in der oberen rechten Ecke mit den folgenden Informationen: -17:50 [70%] 11:42
FREE

Der Indikator zeigt Informationen über:
den Namen des Währungspaares und den Zeitrahmen. Aktuelles Preisangebot. die Zeit vor dem Schließen der Kerze. die aktuelle Differenz zwischen Brief- und Geldkurs (Spread). Auch die Statistik des Handelsvolumens kann angezeigt werden.
Angezeigte Daten
Name, Kontonummer und Kontowährung. Eine Einzahlung in der Kontowährung. Kontostand zum aktuellen Zeitpunkt und ein Prozentsatz des Kontostandes. Aktueller Gewinn und dessen Prozentsatz. Aktuelle Transaktio
FREE
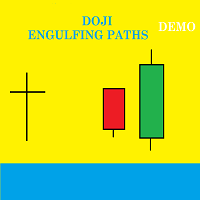
Präsentation Doji Engulfing Paths ermöglicht es, Signale und Daten über den Doji und die Engulfing-Muster auf Charts zu erhalten. Es macht es möglich, Gelegenheiten von Trends zu erhalten und den Richtungsbewegungen zu folgen, um einige Gewinne auf den Forex- und Aktienmärkten zu erhalten. Es ist von Vorteil, alle sich bietenden Gelegenheiten mit Umkehrsignalen und direkten Signalen zu nutzen, um auf dem Forex-Markt Gewinne zu erzielen. In der Demoversion sind nur die Signale ab der 20. Kerze od
FREE

Currency Explorer ist das absolute Werkzeug für Händler, die mit quantifizierter Sicherheit die Stärke und Schwäche jeder Währung kennen und diese mit Hilfe geeigneter Strategien handeln möchten. Unsere maschinellen Lernmodelle laufen und liefern die Stärke/Schwäche jeder Währung auf der Grundlage mehrerer Faktoren neben der Kursentwicklung. Es liefert dem Händler ein QUANTIFIED Ergebnis für die Stärke der 8 beliebtesten und wichtigsten Währungen (EUR, USD, JPY, GBP, AUD, NZD, CAD und CHF) mit e
FREE

Der iMACD in iMA ist ein Indikator, der die Farbe des iMA ändert, wenn der iMACD größer als Null (Aufwärtstrend) oder kleiner als Null (Abwärtstrend) ist. Es ist ein nützliches Werkzeug, um zu verfolgen, wenn die Aufwärts- und die Abwärts-iMACD auf iMA.
Sie können den Quellcode von hier erhalten.
Parameter MA_Periods - Zeitraum für iMA. MA_Methode - Methode für den iMA. MACD_FastEMA - Schneller EMA für MACD. MACD_SlowEMA - Langsamer EMA für den MACD. MACD_SignalSMA - SMA-Signal für den MACD. M
FREE
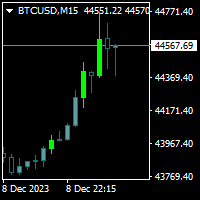
Trendfinder MA Pro basiert auf farbigen Kerzen, die den Trend auf der Grundlage von zwei gleitenden Durchschnitten als Signal und zwei gleitenden Durchschnitten als Kauf- und Verkaufszone, der Steigung des langsamen gleitenden Signal-Durchschnitts und der ATR und des steigenden Volumens anzeigen. Dieser Indikator zeigt Ihnen den Farbwechsel auf dem nächsten Balken auf der Bestätigungskerze an und warnt Sie bei Kauf- und Verkaufssignalen, wenn er in die Kauf- und Verkaufszone eintritt und wenn d
FREE

Kostenlose Version von https://www.mql5.com/en/market/product/44606 Einfacher Indikator zur Berechnung des Gewinns auf Fibonacci-Retracement-Levels mit fester Losgröße, oder zur Berechnung der Losgröße auf Fibonacci-Levels mit festem Gewinn. Fügen Sie den Indikator zum Chart hinzu und verschieben Sie die Trendlinie, um die Fibonacci-Retracement-Levels festzulegen. Funktioniert ähnlich wie die Standard-Fibonacci-Retracement-Linien-Studie in Metatrader . Eingaben Fixed - wählen Sie aus, welcher We
FREE

Dieser Indikator hilft Ihnen, die Entwicklung des Preises zu bestimmen, je nachdem, wie diese Flugobjekte im Diagramm angezeigt werden. Wenn die Segelflugzeuge öffnet ihre Flügel erheblich warnt uns vor einer möglichen Änderung in der Tendenz. Im Gegenteil, wenn es scheint, Geschwindigkeit zu bekommen (sieht dünn aus, weil Linien von Flügeln gruppiert sind) zeigt Sicherheit und Kontinuität im Trend. Jeder Flügel eines Schirms ist eine Leitlinie zwischen dem Schlusskurs und den Höchst-/Tiefstkurs
FREE

Der MAtrio-Indikator zeigt drei gleitende Durchschnitte auf einem beliebigen Zeitrahmen mit einer Periode von 50 Tagen, 100 Tagen und 200 Tagen gleichzeitig an. Nach dem Anhängen an den Chart zeigt er sofort drei gleitende Durchschnitte mit den Parametern einfacher (SMA) gleitender Durchschnitt SmoothingType50 , einfacher (SMA) gleitender Durchschnitt SmoothingType100 , einfacher (SMA) gleitender Durchschnitt SmoothingType200 an. Dementsprechend ist bei den Preistypen ValuePrices50, ValuePrices
FREE

Schnelle T3 MA Trendindikator, der von gleitenden T3-Durchschnitten abgeleitet ist. Dieser Indikator ist Teil des T3 Cloud MA Indikators und wird hier als eigenständiger Indikator veröffentlicht. Kauf-/Verkaufsmöglichkeiten oberhalb/unterhalb der Linie. Die MA-Linie kann auch als dynamische Unterstützung/Widerstand für aggressivere Einstiege verwendet werden. Verwenden Sie die Standardwerte für die besten Einstellungen. Die Anzahl der Rückblick-Balken ist benutzerdefiniert. Dieser Indikator kann
FREE

Dies ist die Fibo-Expansion. Sie können es verwenden, als Gewinnziel auf jedem Niveau... Es verwendet Preis Hochs und Tiefs und Preis zwischen... Es ist einfach und leicht zu bedienen... Kein Eingabe-Menü, ziehen Sie es einfach auf Ihren Chart und es ist sofort einsatzbereit... Die blaue und rote Punktfarbe zeigt die Richtung an... Es verwendet auch die gleichen wie Fraktal hohen und niedrigen Preis als die Punkte, um die Ebenen zu konstruieren... Keine Analyse mehr, um die Punkte zu wählen...
FREE

Der Velvet RSI-Indikator ist für die Verwendung mit dem fortgeschrittenen Velvet-Ordering-Layer vorgesehen. Es handelt sich um eine modifizierte Version des RSI-Indikators von Metaquotes, und alle von ihm angezeigten Daten sind genau und verifiziert, wenn sie vom Order-Layer erkannt werden. Um mit dem Velvet RSI-Indikator Orders zu platzieren, muss der Order-Layer installiert sein und laufen. Um mit dem Velvet RSI-Indikator Orders zu platzieren, muss der Velvet-Ordering-Layer (hier zu finden ),
FREE
"Visual Range - Spread Indikator". Dieser Indikator ist ein unverzichtbares Instrument für den manuellen Handel. Er hilft, "off price" und "schlechte" Einstiege zu vermeiden, die durch abnormal hohe Spreads verursacht werden. ...................................................................................................................... Bei der Markteröffnung und bei Nachrichtenmeldungen kann die Größe des Spreads vorübergehend sehr hoch werden. Der Indikator zeigt die aktuelle Größe des
FREE
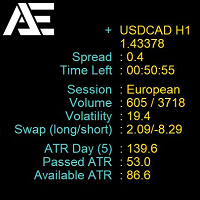
Auf dem EURUSD-Chart ist es FREE. Version mit allen Symbolen! Kontaktieren Sie mich bei Fragen
Market Info Display ist ein vielseitiger Indikator, der wichtige Marktinformationen auf einer benutzerfreundlichen Oberfläche direkt im Chart anzeigt. Seine Funktionen sind so konzipiert, dass er Daten anzeigt, die Händlern helfen, fundierte Entscheidungen zu treffen. Er liefert Daten zum aktuellen Spread, zur Zeit bis zum Kerzenschluss, zur aktuellen Handelssitzung, zum Volumen, zur Volatilität, zu
FREE

Unterstützende Datei (1 von 2) für T3 Cloud MA
Trendindikator, abgeleitet aus gleitenden T3-Durchschnitten. Die Wolke wird durch eine schnelle T3- und eine langsame T3-Linie begrenzt. Kauf-/Verkaufsmöglichkeiten oberhalb/unterhalb der Wolke. Die schnellen und langsamen T3 MA-Linien können auch als dynamische Unterstützung/Widerstand für aggressivere Einstiege verwendet werden. Verwenden Sie die Standardwerte für die besten Einstellungen. Die Anzahl der Rückblick-Balken ist benutzerdefiniert. Di
FREE

Hallo!
Ich bin Tatsuron, ein japanischer Privatinvestor. Ich habe über 1 Milliarde Yen im Devisenhandel betrieben. Lassen Sie mich daher einen sehr nützlichen Indikator vorstellen, den ich verwende.
Indikator für den Typ der Umgebungsbestätigung. Wir haben die Drehpunkte, die der Weltmarkt kennt, auf zwei beschränkt, täglich und monatlich. Daily ist ein Leitfaden für den täglichen Handel, und Monthly ist ein Material für Breaks oder Umkehrungen in Fast-Break-Märkten.
Es ist als Grundlage für
FREE

SkyNet EMA ist ein Indikator, der Ihnen auf der Grundlage der Preisentwicklung und der Überkreuzungen von exponentiellen gleitenden Durchschnitten wie der 14- und 50-Periode vorschlägt, wann Sie kaufen oder verkaufen sollten. Hängen Sie ihn einfach an Ihr Diagramm an, und er überwacht den Vermögenswert auf potenzielle Verkaufsgelegenheiten und malt, falls gefunden, einen roten Pfeil in Ihr Diagramm. Es wird auch versuchen, Kaufgelegenheiten zu finden, und wenn diese gefunden werden, wird ein grü
FREE
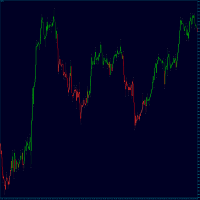
TrendFinder RSI sind farbige Candlesticks, die den Trend auf der Grundlage des Relative Strength Index (RSI) anzeigen. Dieser Indikator zeigt Ihnen den Farbwechsel bei der nächsten Leiste auf der Bestätigungskerze an und wird niemals neu gezeichnet . TrendFinder RSI ist für den Handel auf allen Märkten optimiert und kann sowohl auf Märkten mit als auch ohne Trend verwendet werden. Um beste Ergebnisse zu erzielen, verwenden Sie diesen Indikator als zusätzliches Werkzeug, nachdem Sie Ihre regulär
FREE

Beschreibung des Indikators. Der Indikator " Alligator-Analyse " ( AA ) ermöglicht es Ihnen, verschiedene " Alligatoren " und deren Kombinationen zu bilden (nach Durchschnittsarten und Skalen), d.h. Sie können den Zustand des Marktes auf der Grundlage der Korrelation dieses Zustandes mit einer ganzen Reihe von verschiedenen "Alligatoren " analysieren.Der klassische "Alligator " von Bill Williams basiert auf gleitenden Durchschnitten und Fibonacci-Zahlen, was ihn derzeit zu einem der besten Indik
FREE

MQLTA Instrument Details zeigt Ihnen in einer einfach zu lesenden Tabelle die Details über das Instrument/Symbol, einschließlich: Bezeichnung Handelsmodus Standard-Kontraktgröße Minimale Größe Maximale Größe Größe Schritt Verwendete Ziffern Tick-Größe Tick-Wert Stop-Level Gebot Brief Spanne
Parameter Name des Indikators zur Erstellung der Objekte Standardfenster beim Öffnen des Indikators Horizontaler Versatz Vertikaler Versatz Wenn Ihnen dieses Tool gefällt, nehmen Sie sich bitte eine Minute Z
FREE

Der Indikator zeichnet ein affines Diagramm für das aktuelle Instrument, indem er die Trendkomponente vom Preis subtrahiert. Wenn er gestartet wird, wird eine Trendlinie im Hauptfenster erstellt. Positionieren Sie diese Linie in die gewünschte Richtung. Der Indikator zeichnet ein affines Diagramm entsprechend dem angegebenen Trend.
Eingabeparameter Maximale Anzahl der abgebildeten Balken - die maximale Anzahl der angezeigten Balken. Trendlinienname - Name der Trendlinie. Farbe der Trendlinie -
FREE

Nach 7 Jahren habe ich beschlossen, einige meiner eigenen Indikatoren und Expert Advisors (EAs) kostenlos zur Verfügung zu stellen.
Wenn Sie sie nützlich finden, bitte unterstützen Sie mich mit einer 5-Sterne-Bewertung! Ihr Feedback hält die kostenlosen Tools am Kommen. Weitere meiner kostenlosen Tools finden Sie hier
_________________________________ ATR mit Bändern Indikator für eine verbesserte Volatilitätsanalyse des Forex-Marktes Wir präsentieren den ATR mit Bändern Indikator
FREE

USD INDEX
Das Währungsindex-Projekt ist EIN Teil einer gründlichen Devisenstudie. Viele Menschen kennen nicht die theoretische Grundlage, die die Entwicklung der Wechselkurse auf dem Markt bestimmt. Mit diesem Instrumentarium können Sie einen vollständigeren Überblick über den gesamten Markt erhalten, indem Sie nicht nur die einzelne Währung einer Börse, sondern alle Wechselkurse, aus denen sich diese Währung zusammensetzt, in einem einzigen Fenster analysieren!
Der Indikator stellt den realen
FREE

Der Indikator zeigt die maximale und minimale Anzahl von Losen sowie die Größe der Streuung des Symbols an.
Diese Informationen werden benötigt, um eine schnelle Entscheidung für den Markteintritt auf der Grundlage der maximalen Einzahlung zu treffen, um schnelle und hohe Gewinne zu erzielen. Sie wird auf der Grundlage der verfügbaren Mittel und der Mittel für die Eröffnung eines Loses berechnet.
Solche Situationen treten häufig auf, wenn Sie an verschiedenen Forex-Wettbewerben teilnehmen ode
FREE

Dieser Scanner zeigt die Trendwerte des bekannten Indikators Parabolic SAR für bis zu 30 Instrumente und 8 Zeitrahmen an. Sie können sich per MT4, Email und Push-Benachrichtigung alarmieren lassen, sobald sich die Trendrichtung ändert. Dies ist die KOSTENLOSE Version des Indikators: Fortgeschrittener Parabolic SAR Scanner Die kostenlose Version funktioniert nur auf EURUSD und GBPUSD!
Wichtige Informationen Wie Sie das Potential des Scanners voll ausschöpfen können, lesen Sie bitte hier: www.mql
FREE

Der Pivot Mean Oscillator (PMO) ist ein unbeschränkter nullpunktzentrierter Oszillator, der ein schnelles und normalisiertes Maß für die Divergenz zwischen zwei Spreads liefert. Eine detaillierte Beschreibung der mathematischen Formulierung sowie einige Kommentare und Experimente finden Sie in diesem Artikel .
Handelsaspekte
Diese Version des PMO ist auf die Spreads im Verhältnis zu den Close- und Open-Preissignalen gegen ihren kumulativen gleitenden Durchschnitt (CMA) abgestimmt. Positive PMO(
FREE

Der Indikator zeigt Signale auf dem Diagramm des klassischen RVI-Indikators mit einem Alarm an.
Der Indikator signalisiert nach Bestätigung der Strategie bei der Eröffnung eines neuen Balkens. I recommend watching my advisor - Night Zen EA In den Einstellungen können Sie die folgenden Strategien auswählen : Die Hauptlinie kreuzt die Signallinie Die Hauptlinie kreuzt die Nulllinie In den Einstellungen können Sie den Zeitraum des klassischen RVI-Indikators ändern.
Ich empfehle Ihnen auch, sic
FREE

Produkttitel Smart Williams' %R (MT4) – Teil der SmartView Indicators Serie Kurzbeschreibung Ein Williams' %R -Indikator mit einzigartiger Benutzererfahrung auf der MetaTrader-Plattform. Bietet erweiterte Funktionen, die zuvor nicht verfügbar waren, wie das Öffnen von Einstellungen per Doppelklick, das Ausblenden und Anzeigen von Indikatoren ohne Löschung und die Anzeige des Indikatorfensters in voller Chartgröße. Entwickelt für nahtlose Zusammenarbeit mit dem Rest der SmartView Indicators Serie
FREE

Nicht-proprietäre Studie von Joe Dinapoli, die zur Trendanalyse verwendet wird. Der Indikator gibt Trendsignale, wenn die schnelle Linie die langsame Linie durchdringt. Diese Signale bleiben erhalten, bis eine weitere Durchdringung erfolgt. Das Signal wird am Ende der Periode bestätigt. Er ist für alle Zeitrahmen anwendbar. Parameter Fast EMA: Periode des schnellen gleitenden Durchschnitts. Slow EMA: Periode des langsamen gleitenden Durchschnitts. Signal EMA: Periode der Signallinie. ***********
FREE

Dies ist ein benutzerdefinierter MT4-Indikator namens "Elsna Moving Average". Er zeichnet drei gleitende Durchschnitte (MA1, MA2) auf dem Chart mit anpassbaren Perioden, Verschiebungen, Methoden und angewandten Preisen. MA1 & MA2 können optional verwendet werden, um Füllbereiche ( histogrammähnliche Schattierung) basierend auf einer Farbfüllungseinstellung zu erstellen. Sie können jeden MA einzeln ein- oder ausblenden . Der Indikator ist für die Trendidentifikation und -visualisierung konzipiert
FREE

Panelux - Informationstafel mit wichtigen Informationen für den Händler, wie z. B.: Handelskontonummer und Leverage; Symbol, Zeitraum, letzter Preis, Zeit bis zum Schließen des Balkens und Spread; Ein separater Block für das Mani-Management; Instrumenten-Tauschdaten; Block mit Informationen über Einlage, Saldo, Gewinn, Positionen, Eigenkapital und Marge; Gewinn- und Verlustblock für das Jahr, das Quartal, den Monat, die Woche und für die letzten fünf Tage. Es besteht die Möglichkeit, die Anzeige
FREE

Der MT4 CCI Dashboard Scanner hilft Ihnen, die Commodity Channel Index (CCI) Werte über verschiedene Zeitrahmen und Instrumente hinweg zu verfolgen und bietet Echtzeitbenachrichtigungen, wenn ein neues Signal erkannt wird. Er ist benutzerfreundlich und benötigt wenig Rechenleistung, was eine reibungslose Leistung auf jedem Computer gewährleistet. Hauptmerkmale: Automatische Instrumenten Gruppierung: Der Scanner sammelt alle Instrumente aus Ihrer Marktbeobachtungsliste und organisiert sie in Kate
FREE

Der Indikator erstellt alternative Kurse auf der Grundlage des Durchschnittspreises eines Balkens und der Schatten für einen bestimmten Zeitraum oder entsprechend einer festgelegten Körpergröße.
Optionen:
StartDrawing - das Datum, ab dem der Indikator Kurse erstellt;
PerCounting - Zeitraum für die Berechnung der durchschnittlichen Body-Größe und der Shadows. Wenn AverageBody = 0, dann wird ein Durchschnittspreis gebildet;
AverageBody - feste Größe des Kerzenkörpers. Ist sie größer als Nul
FREE

Eine verbesserte Version des Standardabweichungsindikators.
Sie ist jetzt eine reaktionsschnelle und geglättete Linie.
Die Einrichtung ist nicht ganz einfach - aber ich hoffe, Sie können es schaffen.
Es ist sehr einfach, die Messwerte dieses Indikators zu verstehen, die Bedeutung ist die gleiche wie die der normalen Standardabweichung.
//////////////////////////////////////////////// ///////////////////////////////////
Ich hoffe, dieser Indikator wird Ihnen beim erfolgreichen Handel sehr n
FREE

Dieser Indikator ist die übersetzte Version des MOST-Indikators von Anıl ÖZEKŞİ, der auf dem Matriks Data Terminal entwickelt wurde, in die Sprache MQL4. Es handelt sich um einen trendfolgenden Indikator, der recht erfolgreich ist. Seine Nutzung ist kostenlos und unbegrenzt für ein ganzes Leben. Sie können auf mein Profil klicken, um Zugang zur MQL5-Version dieses Indikators zu erhalten. Sie können auch Ihre Programmieranfragen für die Sprachen MQL4 und MQL5 bei İpek Bilgisayar mit einem kostenp
FREE
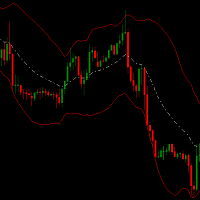
Der Channel Hero Indikator ist ein spezieller Kanal, der Ihnen hilft, überverkaufte/überkaufte Bereiche zu erkennen. Er kann ein ergänzender Indikator für Ihre Strategie sein.
Er kann mit den Bollinger Bändern kombiniert werden. Wenn der Kurs über die Bollinger Bänder ausbricht und das obere Channel Hero Band über dem Bollinger Band liegt und auch
die weiße Linie (mittlere Kanal-Helden-Linie) über dem mittleren BB liegt, dann hat dieser Punkt eine große Chance, nach oben zu gehen. Ein guter S
FREE

Der Indikator basiert auf zwei gleitenden Durchschnitten. Er unterscheidet sich von den traditionellen Indikatoren nur dadurch, dass er als Histogramm dargestellt wird. Das Histogramm hat vier Farben; jede Farbe steht für einen gleitenden Durchschnitt mit seiner eigenen Periode. Im Falle eines Abwärtstrends zeigt der Indikator einen Wert unter der roten Nulllinie an, wenn der Kurs unter einem gleitenden Durchschnitt liegt. Bei einem Aufwärtstrend liegt der Wert des Indikators über der grünen Nul
FREE

Höchst-, Tiefst-, Eröffnungs- und Schlusskurse - ist das nicht zu viel? Manchmal braucht man eine eindeutige Preisentwicklung. Aber wenn man sich für eine Sache entscheidet, geht der Rest verloren. Die Glättung führt auch zu Datenverlusten. Oft geht eines der wichtigsten Marktdetails verloren: Informationen über Extremwerte. Um die Informationen über die Höchst- und Tiefststände zu erhalten, ist die richtige "Glättung" für die Preisentwicklung ein Zickzackkurs. Aber Zickzacks haben auch Nachteil
FREE
Verfolgen Sie Ihre gesamten Trades! Monitor New Fox ist ein hervorragender Indikator, der Ihre aktuellen Gewinne anzeigt, und zwar monatlich, wöchentlich und täglich, d.h. alle Gewinne, die Sie erzielt haben, wenn Sie den mt4 geöffnet haben. Unser brandneuer Monitor New Fox Indikator ist in der Lage, alle fortgeschrittenen Funktionen des MetaTrader 4 zu nutzen. Dieser Indikator kann mit einfachen Daten die wichtigsten Metatrader-Kontodaten grafisch darstellen (Saldo, Eigenkapital, freie Marge, a
FREE

Von Tradingview konvertiertes Tool. Ein einfacher Indikator, der die Differenz zwischen 2 gleitenden Durchschnitten aufzeichnet und Konvergenz/Divergenz in einem farbkodierten Format darstellt.
Alles <= 0 ist rot und zeigt einen Abwärtstrend an, während > 0 grün ist und einen Aufwärtstrend anzeigt .
Stellen Sie die Eingabeparameter wie folgt für Ihren bevorzugten Zeitrahmen ein:
4-Std: Exponential, 15, 30
Täglich: Exponential, 10, 20
Wöchentlich: Exponential, 5, 10
FREE
Dieser Indikator ermöglicht es, den MACD-Oszillator (auf allen MT4-Zeitrahmen) ab einem vom Benutzer definierten Datum mit einer vertikalen Linie (Alone) oder einem Panel (mit "Hidden Candles") auszublenden. Indikator Eingaben: Schnelle EMA-Periode Langsame EMA-Periode Signal SMA Zeitraum Anwenden auf Informationen zum Indikator "MACD" finden Sie hier: https: //www.metatrader4.com/en/trading-platform/help/analytics/tech_indicators/macd ************************************************************
FREE

Tibors Timer - Indikator zur Übersicht und Klarheit im Chart
Dieser Indikator wurde von mir geschrieben, da ich oftmals die wichtigsten Informationen während eines Trades bzw. im Chart mühevoll suchen musste. Bitte täglich neu in den Chart ziehen. Er zeigt folgendes an: - Akuteller Kurs - Aktuelles Handelspaar - Die Zeiteinheit - Die Restzeit zur nächsten Kerzenbildung - Die Nummer des Handelskontos - Die Frei Verfügbare Margin - Margin auf 1 Lot - Der Aktuelle Hebel - Der Aktuelle Spprea
FREE

Der Retracement-Indikator zeigt die aktuellen und historischen Hoch-, Tief- und Mittelwerte an. Optional kann er auch die wichtigsten Retracement-Niveaus anzeigen. Alle diese Niveaus bilden zusammen die wichtigen Unterstützungs- und Widerstandsniveaus. Daher ist es für jede Art von Händler unerlässlich, sie zu kennen.
Niveaus Hoch Niedrig Mittelwert 76,4 % 61,8 % 38,2 % 23,6 %
Wichtigste Merkmale Der Indikator zeigt die aktuellen Niveaus von High, Low, Mid und ausgewählten Retracements an. Vie
FREE

Der UzFx-Local Currency Converter-MT4 ist ein leistungsstarker und benutzerfreundlicher Indikator für Trader, die ihre schwankenden und täglichen Gewinne und Verluste (P&L) sowohl in USD als auch in ihrer lokalen Währung verfolgen möchten. Dieses Tool bietet Echtzeit-Umrechnungen anhand eines benutzerdefinierten Wechselkurses und hilft Tradern so, ihre Handelsperformance effektiver zu visualisieren.
Wichtigste Funktionen
Zeigt laufende Gewinne und Verluste in USD und Ihrer lokalen Währung an.
FREE

Bitte kontaktieren Sie mich auf Telegramm https://t.me/smartforex7 Nach dem Kauf von SmartForex Indicator dann verwenden Sie diesen Indikator...................... SMART EXIT PROFIT LINE Indicator ist sehr hilfreich mit SmartForex Indicator ........................................ SMART EXIT PROFIT LINE Indikator mit SmartForex Indikator anhängen, nachdem die rote Linie den Kaufgewinn und die grüne Linie den Verkaufsgewinn anzeigt................
FREE
Werden Sie ein konstant profitabler 5-Sterne-Forex-Händler!
Wir bieten Ihnen einige Indikatoren, die Sie dabei unterstützen, den Markt zu verstehen und zu analysieren! Mit unseren Strategien werden Sie Ihr Handelssystem verbessern und zu einem Experten werden...
Wir haben Indikatoren für die Trendrichtung, die Marktrichtung und andere... für mehrere Zeitrahmen und die alle Majors oder Ihre bevorzugten Handelssymbole abdecken! Einige von ihnen bieten anpassbare Berechnungsparameter... oder Gra
FREE

Der Scaled Awesome Oscillator (SAO) stellt eine verfeinerte Anpassung des Awesome Oscillators dar, die darauf abzielt, konsistente Benchmarks für die Identifizierung von Markträndern festzulegen. Im Gegensatz zum Standard-Awesome-Oszillator, der die Schwankungen in Pips zwischen verschiedenen Rohstoffen aufzeichnet, ist der einzige unveränderliche Referenzpunkt die Nulllinie. Diese Einschränkung erschwert es Anlegern und Händlern, mit dem traditionellen Awesome-Indikator, einer Kreation von Bill
FREE
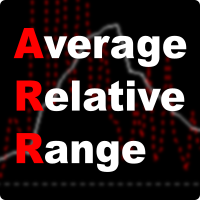
Der ARR-Indikator ist dem ATR-Indikator ähnlich, gibt aber die prozentuale Spanne im Verhältnis zum Eröffnungskurs des jeweiligen Balkens an. Er ist vor allem für Kryptowährungssymbole nützlich, bei denen ATR-Bereiche von vor Jahren nicht direkt mit aktuellen Werten verglichen werden können. Der erste Puffer (rote gepunktete Linie) stellt die prozentuale Spanne eines einzelnen Balkens dar und der zweite Puffer (weiße durchgezogene Linie) stellt den einfachen Durchschnitt der festgelegten Anzahl
FREE

Infometer Indikator für die Anzeige von Informationen in einer der Ecken - wie viele Pips (Pips) oder in der Einzahlungswährung des Gewinns in allen offenen Aufträgen dieses Handelsinstruments. Das Menü des Indikators enthält die folgenden Daten 1. Winkel der Informationsausgabe. 2. Farbe der Informationsausgabe. 3. die Ausgabe der Depotwährung und der Pips. 4. Auswahl der Informationsausgabe - Gewinn und Pips - Gewinn -punkte. Auf weißem Hintergrund werden die Informationen automatisch in schwa
FREE
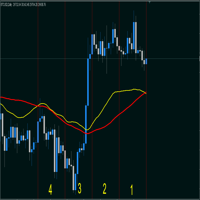
Der Indikator fasst zwei in den Einstellungen festgelegte gleitende Durchschnitte zusammen und multipliziert sie mit 2. (A + B)/2; Verschiebung im Chart - verschiebt die Linie im Chart (WICHTIG! Berücksichtigen Sie die Verschiebung im Chart und die Verschiebung der Linie , sie werden zusammengefasst, d.h. wenn die Verschiebung der Linie auf 50 und die Verschiebung im Chart auf 100 eingestellt ist.) Wenn die Verschiebung der Linie auf 50 eingestellt ist, beträgt die Gesamtverschiebung 100). Mitte
FREE

Wir stellen Ihnen Austin Bands vor - einen innovativen Indikator, der Ihre Forex-Handelsstrategie verbessert, indem er gleitende Durchschnitte auf den MetaTrader 4 Indikator Bollinger Bands anwendet.
Bollinger Bands sind ein beliebtes technisches Analysewerkzeug, das aus einem mittleren Band (normalerweise ein einfacher gleitender Durchschnitt), einem oberen Band (berechnet durch Addition einer bestimmten Anzahl von Standardabweichungen zum mittleren Band) und einem unteren Band (berechnet dur
FREE

Magneto Power MA ist ein Trend-Oszillator. Er basiert auf dem klassischen gleitenden Durchschnittsindikator, hat aber eine nicht standardisierte Art der Interpretation. Es gibt keine Tricks mit gleitenden Übergängen, sondern nur eine hybride Arbeit von MA und Instrumentenvolatilität. Gleichzeitig kann er, wenn er richtig eingestellt ist, mit teuren und komplexen Analoga konkurrieren. Anhand des Histogramms des Indikators ist es einfach, den aktuellen Trend zu bestimmen und festzustellen, ob die
FREE
Moving Averages Divergence 3x3 Indicator uses the crossover technique for signaling the market trend and the trade opportunities as well. It applies 3 formats of the same indicator and allows them to plot the crossover signals which are interpreted as the trade signals along with the direction of the market trend. Moving Averages Divergence 3x3 Indicator can be applied to trade all kinds of forex currency pairs within the financial markets. Although, this indicator works well o
FREE
StrxInfoPanel ist ein unverzichtbares Werkzeug für jeden Trader Es gibt Ihnen einen sofortigen Überblick über Ihr Konto und Echtzeitinformationen über das aktuelle Symbol und den Zeitrahmen, den Sie analysieren Jede Informationszeile kann über Parameter ein- und ausgeblendet werden, auch die Position des Panels kann über Eingabeparameter verändert werden Liste der Parameter: Ecke : die Bildschirmecke, in der das Panel angezeigt werden soll Left, Top und Width : anpassbare Position und Abmessunge
FREE

MetaTrader-Indikator zur Erkennung von WRBs (Wide Range Bodies/Bars) und Hidden Gaps.
WRB Hidden Gap MetaTrader-Indikator erkennt WRB und markiert sie. WRB kann entweder ein Wide Range Bar (ein sehr großer Balken) oder ein Wide Range Body (eine Kerze, die einen sehr langen Körper hat) sein. WRB allein liefern nicht viele Informationen, daher verwendet der Indikator WRB, um Hidden Gaps zu erkennen. Der Indikator zeigt außerdem gefüllte und nicht gefüllte Hidden Gaps auf eine andere Art und Weis
FREE

EMA Oberhalb Unterhalb Geldkurs Technischer Indikator zur Unterstützung der Trader. Dieser Indikator zeigt die Position von fünf EMAs,
fünf gleitenden Durchschnitten, in Bezug auf den Preis, der japanische Kerzen oder Balken bildet ( Geldkurs ).
Über das Konzept des EMA.
Der gleitende Durchschnitt (Moving Average, MA) ist eine zusätzliche Linie auf dem Preisdiagramm eines Vermögenswerts.
Nach außen hin wiederholt er das Preisdiagramm, jedoch mit einer leichten Verzögerung und gleichmäßiger,
FREE

TPP : Wendepunkt-Muster Der Indikator zeigt das Wendepunktmuster des Marktes in Form von Pfeilen an. Die Umkehrsignale beruhen auf der Beobachtung der Kursentwicklung und des Marktverhaltens. Der Indikator basiert auf den Prinzipien der Suche nach Extremwerten, Volatilität und Candlestick-Mustern. Der Indikator liefert Signale nach den folgenden Prinzipien: Suche nach dem Ende des aufsteigenden/absteigenden Trends Suche nach dem Umkehrmuster auf Basis von Candlestick-Mustern Bestätigung der Umke
FREE

MA Cross Histogram Oscillator (MT4) Der MA Cross Histogram Oscillator ist ein benutzerdefinierter Indikator, der die Beziehung zwischen zwei gleitenden Durchschnitten in Form eines farbkodierten Histogramms visualisiert. Anstatt Standard-MA-Linien auf dem Chart zu zeichnen, hebt er die Stärke und Richtung des Trends hervor, indem er die Differenz zwischen einem schnellen und einem langsamen gleitenden Durchschnitt vergleicht. Grüne Balken - bullisches Momentum (der schnelle MA liegt über dem lan
FREE

Ausführlicher Beitrag erklärt:
h ttps://www.mql5 .com/en/blogs/post/759269
Dies ist ein Neigungsindikator für den Bollinger Bands Indikator. Er liefert Steigungen für das obere BB-Band, das mittlere Band (Hauptband) und das untere Band. Sie können auch einen Schwellenwert für die Mittellinie festlegen, um die roten/grünen Histogrammlinien zu steuern. Einstellungen:
Sie können in der Dropdown-Liste auswählen, für welche Linie Sie die Steigung und die Schwellenwerte für Alarme benötigen.
Schwell
FREE

Der MWC COX-Indikator zeigt die Extremzonen der Netto-Short/Long-Positionen für vier Zeiträume an. Die Standardeinstellungen sind Zeiträume von 12, 26, 52 und 156 Wochen.
Zusätzliche Funktionen
- Zeigt die Summe aller 4 Perioden in einer Zeile an
- MA, MOM und RSI Indikatoren sind integriert
Bitte stellen Sie sicher, dass Sie die Datei MWC_Demo.zip herunterladen und in den Ordner [...]/MQL4/Files entpacken. -> www.myweeklycot.com/teaser-demo
FREE

Der Indikator zeichnet zwei einfache gleitende Durchschnitte anhand von Höchst- und Tiefstkursen. Die Linie MA_High wird angezeigt, wenn der gleitende Durchschnitt nach unten gerichtet ist. Sie kann verwendet werden, um eine Stop-Order für eine Verkaufsposition zu setzen. Die MA_Low-Linie wird angezeigt, wenn der gleitende Durchschnitt nach oben gerichtet ist. Sie kann verwendet werden, um eine Stop-Order für eine Kaufposition zu setzen. Der Indikator wird im TrailingStop Expert Advisor verwende
FREE
Ein Indikator für die gleichzeitige Analyse verschiedener Währungspaare Der Devisenmarkt ist ein komplexer Markt, auf dem mehrere Währungspaare gleichzeitig analysiert werden müssen. Bestimmen Sie die Anzahl der Währungspaare selbst Bestimmen Sie das Währungspaar, das Sie analysieren möchten, um 4 der wichtigsten und ähnlichsten Währungspaare gleichzeitig zu analysieren. Für eine direkte und einfache Analyse haben sich einige Währungspaare geändert (EURUSD>>>USDEUR) Zweifeln Sie nicht daran, das
FREE

Der Indikator RS 24 Titanium ist ein Signalindikator für mehrere Währungen und Zeitrahmen, der mit dem Algorithmus des Autors erstellt wurde. Er wurde entwickelt, um schnell den Trend (die Stimmung der Marktteilnehmer) für ein bestimmtes Finanzinstrument auf allen Zeitrahmen gleichzeitig zu bewerten. RS 24 Titanium scannt die Messwerte aller Zeitrahmen für ein Finanzinstrument und zeigt die Daten in Form einer visuellen Tabelle an. Der Indikator kann mit jedem Broker (mit 4/5-stelligen Kursen) v
FREE
Dies ist ein weiterer nicht-parametrischer ZigZag. Jede Aufwärtskante setzt sich fort, bis das Hoch des nächsten Balkens unter dem höchsten Tief seiner Balken liegt, und jede Abwärtskante setzt sich fort, bis das Tief des nächsten Balkens über dem niedrigsten Hoch seiner Balken liegt. Zusätzlich zum Zickzack selbst (in oranger Farbe dargestellt) zeigt der Indikator Signalmarken auf den Balken an, bei denen sich die Zickzackrichtung ändert. Der blaue Pfeil nach oben zeigt an, dass ein neuer Aufwä
FREE

The indicator represents 4 moving averages, shifted back. Created, like any moving average indicators, in order to see the approximate balance of volatility and the number of bulls and bears. The difference from other Moving Averages is that an attempt is made here to bring the moving averages of different periods to a common denominator, respectively, to bring the number of traders trading on different timeframes to a common denominator. The indicator is distributed as is.
MnojitelMA1, Mnojit
FREE

OrderCalc öffnet ein Fenster im Chart mit den Daten ihrer Orders:
Positionsgröße, Stop Loss, Take Profit, Gewinn/Verlust
Es werden nur die Positionen angezeigt für dieses Symbol. Wenn mehrere Positionen existieren, werden diese summiert und in der letzten Zeile angezeigt. Wer mit Pyramiden arbeitet kann so mit einem Blick sehen wie groß der gesamte Gewinn oder Verlust ist.
Der Indikator ist am Anfang unsichtbar, erst wenn eine Position geöffnet wird, öffnet sich ein Fenster, dieses enthält d
FREE
Erfahren Sie, wie man einen Handelsroboter im MetaTrader AppStore, dem Shop für Applikationen für die MetaTrader Handelsplattform, kaufen kann.
Das Zahlungssystem der MQL5.community ermöglicht Zahlungen mit PayPal, Kreditkarten und den gängigen Zahlungssystemen. Wir empfehlen Ihnen eindringlich, Handelsroboter vor dem Kauf zu testen, um eine bessere Vorstellung von dem Produkt zu bekommen.
Sie verpassen Handelsmöglichkeiten:
- Freie Handelsapplikationen
- Über 8.000 Signale zum Kopieren
- Wirtschaftsnachrichten für die Lage an den Finanzmärkte
Registrierung
Einloggen
Wenn Sie kein Benutzerkonto haben, registrieren Sie sich
Erlauben Sie die Verwendung von Cookies, um sich auf der Website MQL5.com anzumelden.
Bitte aktivieren Sie die notwendige Einstellung in Ihrem Browser, da Sie sich sonst nicht einloggen können.