Participe de nossa página de fãs
Coloque um link para ele, e permita que outras pessoas também o avaliem
Avalie seu funcionamento no terminal MetaTrader 5
- Visualizações:
- 307
- Avaliação:
- Publicado:
-
Precisa de um robô ou indicador baseado nesse código? Solicite-o no Freelance Ir para Freelance
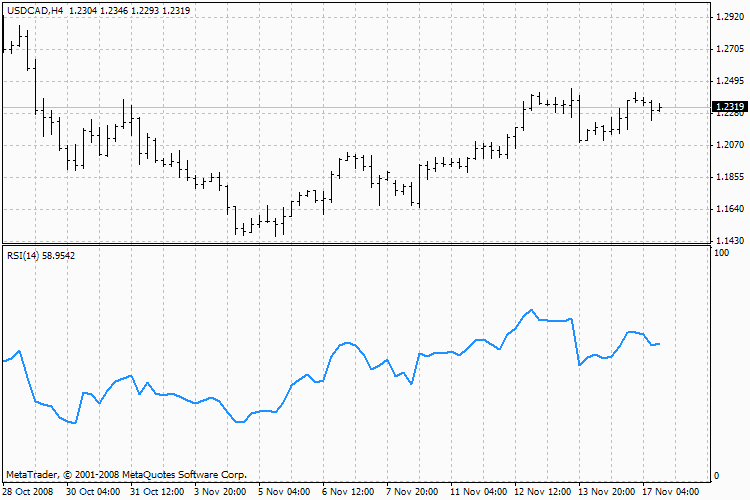
Um dos métodos comuns de análise do indicador Índice de Força Relativa é procurar divergências em que o preço forma uma nova alta e o RSI não consegue superar o nível da alta anterior.
Essa divergência indica a probabilidade de uma reversão de preço. Se o indicador então cair para baixo e ficar abaixo de seu mínimo, ele completa o que é conhecido como uma oscilação fracassada.
Essa oscilação fracassada é considerada uma confirmação de que uma reversão de preço é iminente.

Índice de Força Relativa
Ao analisar os gráficos, os seguintes sinais do Índice de Força Relativa são distinguidos:
|
Cálculo
A fórmula básica para calcular o indicador técnico Índice de Força Relativa:
RSI = 100 - (100 / (1 + U / D))
Onde:
U - valor médio das alterações positivas de preço;
D - valor médio das mudanças negativas de preço.
Descrição do indicador técnico
A descrição completa do Índice de Força Relativa está disponível na seção Análise técnica: Índice de Força Relativa.
Traduzido do russo pela MetaQuotes Ltd.
Publicação original: https://www.mql5.com/ru/code/7677
 Market Status Info
A script that displays the useful information about the broker, the account and the full specifications of the instrument.
 BBMA - Bollinger Band Moving Average
All indicators required by BBMA Strategy in a single indicator.
 Adjustable Moving Average EA
Esse Expert Advisor abre negociações com base no cruzamento de duas médias móveis ajustáveis. Você pode personalizar totalmente os períodos, o tipo (por exemplo, EMA, SMA) e a direção (somente longa, somente curta ou ambas). Ele inclui configurações opcionais de Stop Loss, Take Profit e Trailing Stop.
 Rotação de objetos de texto
Exemplo de trabalho com objetos: criação de um objeto, alteração de propriedades, redesenho de um gráfico.