Schaff Trend RSI Indicator

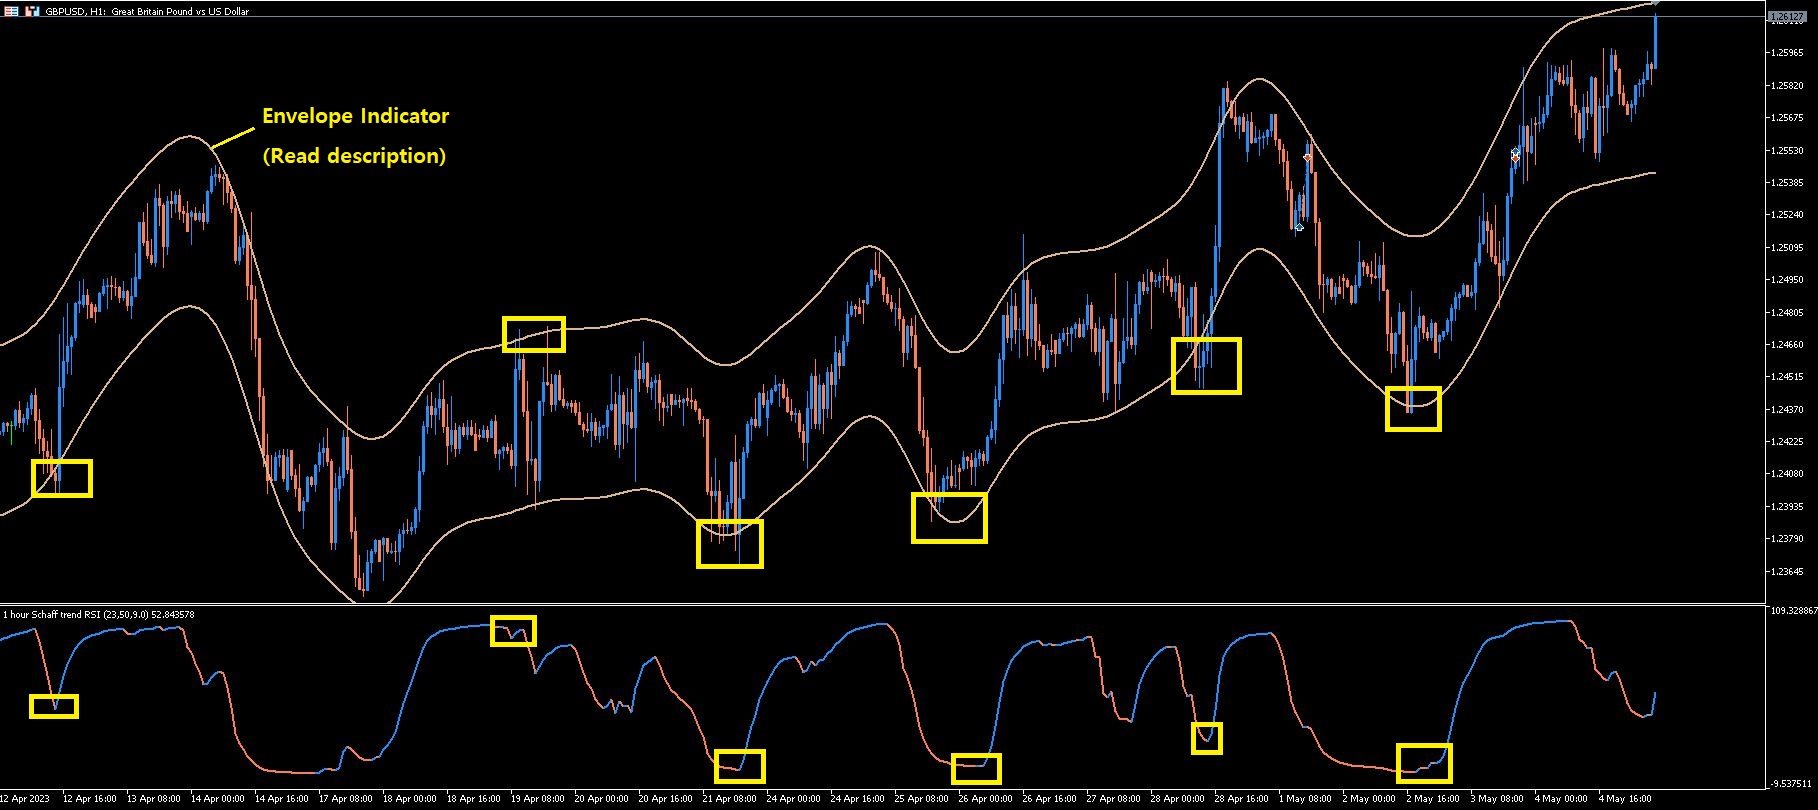
Schaff trend RSI indicator

(It is related with EMA and RSI)

It is suited for sub-Indicator to undertand trend(or direction change)


As you can see the screenshot, it's good with Nagaraya-Watson Envelope Indicator (or others)

I am using this indicator as Screenshot setting. (Schaff value is default value. 23, 50, 9, close)

If you want to get Nagaraya-Watson Envelope, Link: https://www.mql5.com/ko/market/product/97965


추천 제품
Blue Orbit
Farel
4.38 (8)
Blue Orbit 오늘 가격 은 190 입니다. 10 개가 판매되면, 새로운 가격은 249 가 될 것입니다. 초기 슬롯을 놓치지 마세요. 현재 판매 수량: 9 . 시장 자연 “흐름 역학”을 해석하도록 설계된 EA인 Blue Orbit 와 함께 자동 거래의 새로운 시대에 발을 내디뎌보세요. 정밀성을 위해 설계된 이 시스템은 실시간 모멘텀 변화를 읽고, 소진 영역을 감지하며, 추세 소진이 반전 강도와 만나는 지점에서 진입을 실행하는 데 집중합니다. 이는 비선형적이고 유동적인 접근 방식으로, 경직된 기계적 설정을 훨씬 초월합니다. MQL에서 성장하는 거래자 커뮤니티에 참여하세요:  (여기를 클릭하세요) EA의 통찰력에 대해 더 깊이 알아보세요:   (여기를 클릭하세요) 개요 차트 기호: XAUUSD (단일 차트 설정) 시간 프레임: M15 최고 추천: XAUUSD 최소 예치금: $500 추천 레버리지: 1:100에서 1:500 최적 적절한 백테스트: 저에게 연락하시면   설정
NEXA BB Keltner Squeeze Expert Advisor for MetaTrader 5 Ⅰ. 제품 개요 NEXA BB Keltner Squeeze는 **볼린저 밴드(Bollinger Bands)**와 **켈트너 채널(Keltner Channel)**의 상대적 위치 변화를 이용하여 시장 변동성의 확장 국면을 감지하고, 확정된 가격 돌파 봉 을 기준으로 거래를 수행하는 자동 매매 Expert Advisor입니다. 본 제품은 H1 차트 를 기준으로 설계되었으며, 지정된 조건이 충족될 경우에만 거래를 수행하도록 구성되어 있습니다. 이 Expert Advisor는 의사결정을 자동화 하기 위한 도구이며, 시장 분석 및 거래 실행은 프로그램의 내부 규칙에 따라 이루어집니다. Ⅱ. 주요 작동 원리 본 EA는 다음과 같은 논리를 기반으로 작동합니다. 변동성 압축 상태 인식 볼린저 밴드가 켈트너 채널 내부로 수렴하는 구간을 기준으로 시장 상태를 평가합니다. 가격 돌파 확인 직전 H1 봉이
SC MTF Osma for MT5 with alert
Krisztian Kenedi
4.67 (3)
멀티 타임프레임 지원, 맞춤형 시각 신호 및 구성 가능한 알림 시스템을 갖춘 OsMA (MACD 히스토그램) 지표. 프리랜서 프로그래밍 서비스, 업데이트 및 기타 TrueTL 제품은 제 MQL5 프로필 에서 확인하실 수 있습니다. 피드백과 리뷰를 진심으로 환영합니다! OsMA란 무엇인가? OsMA(이동평균의 오실레이터)는 MACD와 신호선의 차이로, MACD 히스토그램이라고도 합니다. 양수 값은 MACD가 신호선 위에 있음(상승 모멘텀)을 나타내고, 음수 값은 MACD가 신호선 아래에 있음(하락 모멘텀)을 나타냅니다. 제로 라인 교차는 MACD/신호 교차에 해당하며 잠재적인 추세 전환을 신호합니다. 증가하는 막대는 모멘텀 증가를, 감소하는 막대는 모멘텀 감소를 나타냅니다. OsMA 신호는 제로 라인 교차(추세 전환), OsMA와 가격 간의 다이버전스 발생, 히스토그램의 피크와 골 감지 시 생성됩니다. 이 지표는 트레이더가 모멘텀 움직임의 강도와 방향을 높은 정밀도로 측정하는 데
FREE
Introduction This indicator detects volume spread patterns for buy and sell opportunity. The patterns include demand and supply patterns. You might use each pattern for trading. However, these patterns are best used to detect the demand zone (=accumulation area) and supply zone (=distribution area). Demand pattern indicates generally potential buying opportunity. Supply pattern indicates generally potential selling opportunity. These are the underlying patterns rather than direct price action. T
Goldfish by EV
Enrique Valeros Muriana
Goldfishis a fully automated EMA crossover Expert Advisor for MetaTrader 5, designed for intraday trading with a strong emphasis on risk and money management. The core strategy is based on a classic trend-following concept using two exponential moving averages (fast and slow) on a user-defined timeframe. The EA searches for bullish and bearish EMA crossovers to open buy or sell positions, allows only one trade per symbol at a time, and checks for new signals once per bar instead of every tick to
FREE
PRECISION ENTRY MASTER INDICATOR Get In At The Perfect Price - Every Single Time ENTER THE MARKET AT THE MOST PROFITABLE MOMENTS Tired of buying the top and selling the bottom? Discover the SECRET to entering trades at the EXACT perfect timing - where institutional money flows and retail traders get liquidated. This isn't just another indicator... it's your gateway to professional-level entry precision. PERFECT ENTRIES = MAXIMUM PROFITS PINPOINT MARKET REVERSALS Catch the EXACT mom
B2U Market State System Part of the B2U Market State System This indicator is available for free for the next three months. A professional indicator suite designed to analyze market structure, trend state, and momentum. B2U Market State System 의 구성 요소입니다. 시장 구조, 추세 상태, 모멘텀을 입체적으로 분석하기 위한 전문 인디케이터 시스템입니다. Visualizes momentum state and pressure balance within market structures. B2U Ultimate %R Edition goes beyond the traditional Williams %R numeric oscillator. 과매수 · 과매도를 색상과 라인으로 ‘ 상태화 ’ 하다 .” B2U
FREE
Introduction to Fractal Pattern Scanner Fractal Indicator refers to the technical indicator that makes use of the fractal geometry found in the financial market. Fractal Pattern Scanner is the advanced Fractal Indicator that brings the latest trading technology after the extensive research and development work in the fractal geometry in the financial market. The most important feature in Fractal Pattern Scanner is the ability to measure the turning point probability as well as the trend probabil
Nova DC Trader is a precision-focused breakout Expert Advisor built to capitalize on price compression and clean directional expansion. By identifying structured consolidation phases and high-quality breakouts, it transforms controlled price action into deliberate trading opportunities. Rather than chasing volatility or relying on lagging indicators, Nova DC Trader emphasizes structure, timing, and disciplined execution. It is designed for traders who value logic over randomness and prefer trade
FREE
Dynamic SR and Trendline Indicator
Adebowale Adeniyi Adeleke
5 (1)
The MTF Support/Resistance & Trendline Analyzer is a powerful multi-timeframe indicator that automatically detects key support and resistance levels , draws dynamic trendlines , and provides a real-time market structure dashboard — all in one clean, lightweight display. It combines fractal logic and price action detection across three timeframes to give you a unified view of market direction and structure. Whether you trade reversals, breakouts, or trends, this tool highlights the zones that mat
FREE
SpeedScalper AI MT5
Ankitbhai Radadiya
1 (1)
SpeedScalper AI MT5 is a next-generation scalping robot developed by a highly experienced team in trading and coding. It is designed for scalping on one of the most popular crypto pair BTCUSD . Unlock the power of automated trading with this advanced SpeedScalper AI MT5 specifically designed for the BTCUSD pair. Whether you're trading on the 1-minute or 4-hour chart, this bot adapts to any timeframe, making it a versatile tool for traders of all styles. This strategy has undergone extensive test
NEXA Swing Zone Trader 한국어 사용자 설명서 (Official Manual) 1. EA 개요 NEXA Swing Zone Trader 는 EMA 기반의 추세 존(Zone) 안에서 구조 돌파가 발생할 때만 거래하는 저빈도·고정밀 스윙 자동매매 EA 입니다. 이 EA는 잦은 거래를 하지 않으며, 명확한 추세 + 모멘텀 + 구조 돌파 가 동시에 발생할 때만 진입하여 실계좌 환경에서도 안정성을 우선으로 설계되었습니다. 2. 전략 핵심 구조 추세 판별 (Trend Zone) EMA 150 (H1 기준) 가격이 EMA 위에 있으면 상승 존(Bull Zone) 가격이 EMA 아래에 있으면 하락 존(Bear Zone) 추세 방향과 반대 방향의 거래는 절대 하지 않습니다. 진입 조건 (Entry Logic) 매수(BUY) 가격이 EMA 위 (Bull Zone) RSI(10)이 49.5 기준 상향 돌파 최근 Fractal High 구조 돌파 매도(SELL) 가격이 EMA
멀티 타임프레임 지원, 맞춤형 시각 신호 및 구성 가능한 알림 시스템을 갖춘 Williams %R 지표. 프리랜서 프로그래밍 서비스, 업데이트 및 기타 TrueTL 제품은 제 MQL5 프로필 에서 확인하실 수 있습니다. 피드백과 리뷰를 진심으로 환영합니다! Williams %R란 무엇인가? Williams %R은 래리 윌리엄스가 개발한 모멘텀 오실레이터입니다. -100에서 0 범위로 움직입니다. 0에 가까운 값은 과매수 상태를, -100에 가까운 값은 과매도 상태를 나타냅니다. Williams %R은 역상관 스토캐스틱 오실레이터로, 종가가 특정 기간의 고가-저가 범위에서 어느 위치에 있는지를 측정합니다. 과매수/과매도 레벨(-20과 -80) 교차가 거래 신호를 생성합니다. 이 지표는 트레이더가 잠재적인 반전 지점을 파악하는 데 도움이 됩니다. %R이 -20선을 하향 돌파할 경우 조정이 임박했음을 신호할 수 있으며, -80선을 상향 돌파할 경우 반등 가능성을 나타낼 수 있습니다.
FREE
QuantumAlert Stoch Navigator is a free indicator available for MT4/MT5 platforms, its work is to provide "alerts" when the market is inside "overbought and oversold" regions in the form of "buy or sell" signals. This indicator comes with many customization options mentioned in the parameter section below, user can customise these parameters as needful. Join our   MQL5 group , where we share important news and updates. You are also welcome to join our private channel as well, contact me for the p
FREE
AuRatio Master EA — XAUUSD H1 IMPORTANT NOTICE — Please read before getting started The default parameters of the EA are not the optimal operating values. The EA comes with a base configuration for technical reference purposes only. To operate correctly, you must load the SET FILE corresponding to your broker, which includes: Risk management calibrated according to your capital and broker profile ATR (Average True Range) application to dynamically adapt to current market volatility Updated and o
NEXA Logistic Regression EA (Expert Advisor) 1. 제품 개요 NEXA Logistic Regression EA는 M15 타임프레임 기반의 추세 방향 거래를 수행하는 자동매매 프로그램 입니다. 본 제품은 EMA200 방향 필터 와 가격 데이터 기반의 수식형 Logistic Regression 계산 결과 를 조합하여 매수 또는 매도 방향을 판단합니다. 모든 계산은 완료된 캔들(Closed Bar) 기준으로 이루어지며, 실시간 재계산 또는 차트 왜곡을 발생시키지 않습니다. 2. 동작 방식 요약 본 EA는 다음과 같은 흐름으로 동작합니다. EMA200 기준으로 현재 가격의 방향 변화를 확인합니다. EMA200 상·하향 돌파 발생 시에만 거래 가능 상태로 전환됩니다. 최근 가격 데이터를 기반으로 Logistic Regression 계산을 수행합니다. 계산 결과와 EMA200 방향이 일치할 경우에만 진입을 고려합니다. 포지션은 단일 심볼 기준으로 관리되며,
Short Description Fox Wave Account Nexus is a professional dashboard for real-time monitoring of multiple MetaTrader 5 accounts across different terminals from a single chart. Full Description  Fox Wave Account Nexus Professional Multi-Account Monitoring Dashboard for MetaTrader 5 Fox Wave Account Nexus is a powerful visual dashboard designed for traders who operate multiple MT5 accounts simultaneously and need instant, centralized control . The indicator collects live data from all con
Vertical Volume
Kim Yonghwa
4.8 (5)
기능 가격에 대한 거래량 확인 지표입니다. 주로 EURUSD에 적용되며, 다른 통화 쌍은 작동하지 않거나 계산에 오랜 시간이 걸릴 수 있습니다. 원활한 사용을 위해 "차트 경계를 오른쪽 경계에서 이동" 옵션을 활성화합니다(스크린샷에 표시됨). 새로운 막대가 나타날 때 데이터가 재설정됩니다. 변수 COlOR: 지표 색상 설정 WIDTH: 지표 너비 설정 PERIOD: 데이터 계산을 위한 기간 설정 ‐----‐-------------------------------------------------------------------------------------------------------------------------------------------------
FREE
Pin Bars MT5
Yury Emeliyanov
Main purpose:   "Pin Bars"   is designed to automatically detect pin bars on financial market charts. A pin bar is a candle with a characteristic body and a long tail, which can signal a trend reversal or correction. How it works:   The indicator analyzes each candle on the chart, determining the size of the body, tail and nose of the candle. When a pin bar corresponding to predefined parameters is detected, the indicator marks it on the chart with an up or down arrow, depending on the directi
FREE
BeansAssist
Ivanvielle Bonifacio Dupaya
BeansAssist Gives you fruitful information of the price of the symbol that you are trading. Improve your trades simply by following the suggestion that it gives you. Tracks deal stats daily so you keep track of your performance. Don't let emotions take control, be a better and profitable trader with BeansAssist to guide you. *Note: This utility is not for free 
N/B: All our product purchase comes with our free ‘’DAILY   SCALPER EA’’ -   bit.ly/4qlFLNh Whatsapp Developer for yours after successful purchase PROFESSIONAL DOUBLE TOP/BOTTOM PATTERN SCANNER The Ultimate Reversal Trading System for Forex & Crypto Traders  TRANSFORM YOUR TRADING WITH INSTANT PATTERN RECOGNITION Are you tired of missing profitable reversal setups? Exhausted from staring at charts for hours, trying to spot double tops and bottoms? Frustrated with false breakouts and misse
멀티 타임프레임 지원, 맞춤형 시각 신호 및 구성 가능한 알림 시스템을 갖춘 Average Directional Movement Index(ADX) 지표. 프리랜서 프로그래밍 서비스, 업데이트 및 기타 TrueTL 제품은 제 MQL5 프로필 에서 이용하실 수 있습니다. 피드백과 리뷰를 대환영합니다! ADX란 무엇인가요? J. Welles Wilder가 개발한 Average Directional Movement Index(ADX)는 방향에 관계없이 추세의 강도를 측정하는 데 사용되는 기술적 지표입니다. ADX는 양의 방향 지표(+DI)와 음의 방향 지표(-DI)로부터 도출되지만, 추세의 방향이 아닌 강도만을 나타냅니다. ADX 값은 0에서 100 사이입니다. 일반적으로 20~25 미만의 값은 약하거나 존재하지 않는 추세(레인지 시장)를 나타내고, 25 이상의 값은 강한 추세를 나타냅니다. 50 이상의 값은 매우 강한 추세를 나타냅니다. ADX는 시장이 추세 중인지 레인지 중인지
FREE
This innovative technical indicator was created to detect quiet market period before the beginning of the high volatile market. Like many good technical indicators, this Market Activity Index is very stable and it is widely applicable to many financial and non financial instruments without too much restriction. The Market Activity Index can be used best to visualize the alternating form of low and high volatile market. It is very useful tool to pick up the quiet market but ironically this is the
It's no secret. One of the best edges in trading is the mean-reversion strategy on US indices. Don't believe me? Do just a little research. Hence, having an EA that does this is very much a must-have in any portfolio.  I made this for myself, but I am also offering it to anyone who needs it as well at a fair price.  The process of making it was using RSI and using a point for buying and closing.  I then used machine learning to test 100,000s of variables to get to this configuration. How does it
FREE
ADR Pro
Oleksandr Myrhorodskyi
ADR Pro — Auto Adaptive Daily Range & Volatility Indicator (ATR + ADR + Alerts) Auto Adaptation. All Markets. No Guesswork . Enhance your trading decisions with precise ADR levels — for Forex, Crypto, Stocks, Indices, Metals, Energy, Commodities, and ETFs. Easy Setup Professional Features Lifetime Free Updates ADR Pro is your personal "volatility compass" that shows the real daily range boundaries for any asset. Forget manual calculations and constant parameter adjustments — the indicator
NEXA Breakout Velocity Channel Breakout + ROC 속도 필터 + 거래량 필터 + ATR 리스크 관리 기반의 자동매매 프로그램입니다. 본 제품은 변동성 확장 구간에서의 가격 돌파를 감지하도록 설계되었습니다. 신호는 종가 기준으로만 계산되며, 동일 심볼에 한 개의 포지션만 유지합니다. 전략 개요 이 제품은 다음 요소를 결합합니다. 채널 기반 돌파 감지 가격 변화 속도(ROC) 필터 거래량 증가 필터 하위 시간대 확인 옵션 ATR 기반 손절 및 손익비 설정 계좌 위험 비율 기반 자동 로트 계산 동적 리스크 관리 단순한 돌파가 아닌, 속도와 거래량이 동반된 돌파를 선택하도록 설계되었습니다. 작동 방식 설정된 기간의 고점/저점 채널을 계산합니다. 직전 봉이 채널을 돌파했는지 확인합니다. ROC 값이 평균 대비 일정 배수 이상인지 확인합니다. 거래량이 평균 대비 일정 수준 이상인지 확인합니다. 필요 시 하위 시간대에서 동일 조건을 재확인합니다. ATR 기반 손절
FREE
Allgain100
Nissar Ahmed
Key Features Strategy Core EMA Crossover System : Fast EMA (default: 20) and Slow EMA (default: 50) Generates buy signals when Fast EMA crosses above Slow EMA. Generates sell signals when Fast EMA crosses below Slow EMA. Fibonacci Filter : Calculates Fibonacci retrenchment levels (23.6%, 38.2%, 50%, 61.8%, 78.6%) based on recent price swings. Requires price to be near a Fibonacci level (configurable threshold) to validate trades. Risk Management Position Sizing : Dynamically calculates lot size
Why the RSI Alert Indicator is Essential for Your Trading Toolkit In the fast-paced world of trading, timely and accurate information is crucial. The RSI Alert Indicator is a powerful tool designed to help you stay ahead of the market by providing real-time alerts when the Relative Strength Index (RSI) reaches critical levels. Whether you're a novice trader or a seasoned professional, this indicator can significantly enhance your trading strategy by pinpointing potential market reversals with
Reversal Composite Candles
MetaQuotes Ltd.
3.67 (15)
The idea of the system is to indentify the reversal patterns using the calculation of the composite candle. The reversal patterns is similar to the "Hammer" and "Hanging Man" patterns in Japanese candlestick analysis. But it uses the composite candle instead the single candle and doesn't need the small body of the composite candle to confirm the reversal. Input parameters: Range - maximal number of bars, used in the calculation of the composite candle. Minimum - minimal size of the composite can
FREE
이 제품의 구매자들이 또한 구매함
SuperScalp Pro
Van Minh Nguyen
5 (14)
SuperScalp Pro – 고급 다중 필터 스캘핑 인디케이터 시스템 SuperScalp Pro는 클래식 Supertrend와 여러 지능형 확인 필터를 결합한 고급 스캘핑 인디케이터 시스템입니다. 해당 인디케이터는 M1부터 H4까지 모든 타임프레임에서 효율적으로 작동하며, 특히 XAUUSD, BTCUSD 및 주요 외환 통화쌍에 적합합니다. 독립형 시스템으로 사용하거나 기존 거래 전략에 유연하게 통합할 수 있습니다. 이 인디케이터는 11개 이상의 필터를 통합하며, 빠른/느린 EMA, 추세 판별용 3개의 EMA, EMA 기울기(EMA slope), RSI, ADX, 거래량(Volume), VWAP, 볼린저 밴드 돌파(Bollinger Bands Breakout) 및 MACD 다이버전스 필터 등을 포함합니다. 스마트 캔들 필터는 캔들 종가를 확인하여 약한 신호를 제거하고, 3 EMA와 MACD 다이버전스 필터를 결합한 추세 인식 메커니즘은 더 높은 승률의 신호를 선별하는 데 도움을 줍니
Azimuth Pro
Ottaviano De Cicco
5 (6)
LAUNCH PROMO Azimuth Pro price is initially set at 299$ for the first 100 buyers. Final price will be 499$ . THE DIFFERENCE BETWEEN RETAIL AND INSTITUTIONAL ENTRIES ISN'T THE INDICATOR — IT'S THE LOCATION. Most traders enter at arbitrary price levels, chasing momentum or reacting to lagging signals. Institutions wait for price to reach structured levels where supply and demand actually shift. Azimuth Pro maps these levels automatically: swing-anchored VWAP, multi-timeframe structure lines, an
Divergence Bomber
Ihor Otkydach
4.9 (86)
이 지표를 구매하신 분께는 다음과 같은 혜택이 무료로 제공됩니다: 각 거래를 자동으로 관리하고, 손절/익절 수준을 설정하며, 전략 규칙에 따라 거래를 종료하는 전용 도우미 툴 "Bomber Utility" 다양한 자산에 맞게 지표를 설정할 수 있는 셋업 파일(Set Files) "최소 위험", "균형 잡힌 위험", "관망 전략" 모드로 설정 가능한 Bomber Utility의 셋업 파일 이 전략을 빠르게 설치, 설정, 시작할 수 있도록 돕는 단계별 영상 매뉴얼 주의: 위의 모든 보너스를 받기 위해서는 MQL5 개인 메시지 시스템을 통해 판매자에게 연락해 주세요. 독창적인 커스텀 지표인 “Divergence Bomber(다이버전스 봄버)”를 소개합니다. 이 지표는 MACD 다이버전스(괴리) 전략을 기반으로 한 올인원(All-in-One) 거래 시스템입니다. 이 기술 지표의 주요 목적은 가격과 MACD 지표 간의 다이버전스를 감지하고, **향후 가격이 어느 방향으로 움직일지를 알려주는
Power Candles MT5
Daniel Stein
5 (7)
Power Candles – 모든 시장을 위한 강도 기반 진입 신호 Power Candles 는 Stein Investments의 검증된 강도 분석을 가격 차트에 직접 제공합니다. 가격 움직임에만 반응하는 대신, 각 캔들은 실제 시장 강도를 기준으로 색상화되어 모멘텀 형성, 강도 가속, 명확한 추세 전환을 즉시 파악할 수 있습니다. 모든 시장을 위한 단일 로직 Power Candles는 모든 거래 심볼 에서 자동으로 작동합니다. 현재 심볼이 Forex인지 비-Forex 시장인지 자동으로 감지하여 내부적으로 적절한 강도 모델을 적용합니다. Forex 및 Gold 는 FX Power Delta 값을 사용합니다 (절대값 범위 최대 100) 지수, 크립토 및 CFD 는 IX Power Strength 값을 사용합니다 (절대값 범위 최대 50) 필요한 강도 계산은 Power Candles에 완전히 내장되어 있습니다. 캔들 색상이나 신호 로직을 위해 추가 인디케이터는 필요하지 않습니다. 가격
Entry In The Zone and SMC Multi Timeframe is a real-time market analysis tool developed based on Smart Money Concepts (SMC). It is designed to analyze market structure, price direction, reversal points, and key zones across multiple timeframes in a systematic way. The system displays Points of Interest (POI) and real-time No Repaint signals, with instant alerts when price reaches key zones or when signals occur within those zones. It functions as both an Indicator and a Signal System (2-in-1), c
Power Bar MT5
Daniel Stein
실제 자금을 투입하기 전에 어떤 전략이 내 심볼에서 효과적인지 확인하세요. Power Bar는 모든 심볼과 모든 타임프레임에서 극단적인 가격 바 를 감지한 다음, 3가지 다른 트레이딩 전략을 즉시 백테스트하여 승률, 수익 팩터, 손익을 나란히 비교할 수 있습니다. 모든 것이 하나의 인터랙티브 패널에 담겨 있습니다. 추측 없음. 커브 피팅 없음. 오직 데이터뿐입니다. Power Bar가 특별한 이유 대부분의 인디케이터는 신호를 주고 그것이 효과가 있는지는 추측에 맡깁니다. Power Bar는 한 걸음 더 나아갑니다 - 모든 신호를 세 가지 전략 에 대해 테스트하고 통계를 보여줍니다. FlipFlop, Momentum, Reversal을 원클릭으로 전환하고 숫자가 즉시 변하는 것을 확인하세요. FlipFlop - 항상 포지션 유지. 신호에 진입하고, 반대 신호에 청산. 당사의 연구에 따르면 US30, US500, DAX와 같은 추세가 있는 지수에서 가장 효과적입니다. Momentum
이 지표를 구매하면 제 프로페셔널 트레이드 매니저를 무료로 드립니다. 우선 이 거래 시스템이 리페인팅, 리드로잉 및 레이그 인디케이터가 아니라는 점을 강조하는 것이 중요합니다. 이는 수동 및 로봇 거래 모두에 이상적인 것으로 만듭니다. 온라인 강좌, 설명서 및 프리셋 다운로드. "스마트 트렌드 트레이딩 시스템 MT5"은 새로운 및 경험이 풍부한 트레이더를 위해 맞춤형으로 제작된 종합적인 거래 솔루션입니다. 10개 이상의 프리미엄 인디케이터를 결합하고 7개 이상의 견고한 거래 전략을 특징으로 하여 다양한 시장 조건에 대한 다목적 선택이 가능합니다. 트렌드 추종 전략: 효과적인 트렌드 추이를 타기 위한 정확한 진입 및 손절 관리를 제공합니다. 반전 전략: 잠재적인 트렌드 반전을 식별하여 트레이더가 범위 시장을 활용할 수 있게 합니다. 스캘핑 전략: 빠르고 정확한 데이 트레이딩 및 단기 거래를 위해 설계되었습니다. 안정성: 모든 인디케이터가 리페인팅, 리드로잉 및 레이그가 아니므로 신뢰
OmniSync Projection
Antonio-alin Teculescu
5 (1)
Chronos Fractal Engine is an innovative price projection indicator for MetaTrader 5, designed to transform your technical analysis by intelligently identifying and projecting historical price patterns. Built upon an advanced correlation algorithm and the fractal principles of the market, this powerful tool visualizes potential future price movements, giving you a unique edge in your trading decisions. What is Chronos Fractal Engine? At its core, the Chronos Fractal Engine employs a sophisticat
Meridian Pro
Ottaviano De Cicco
5 (1)
Meridian Pro: Professional Multi-Timeframe Trend Matrix for MT5 Overview Meridian Pro is a multi-timeframe trend matrix by Merkava Labs that compresses directional state, strength, momentum condition and matrix agreement into one compact panel. One adaptive engine, applied consistently from M1 to W1. No per-symbol tuning. No indicator stacking. One structured readout across every asset and every timeframe. Launch Offer — Get Meridian Pro for USD 99 (introductory). Regular price: USD 149. 1. Why
RelicusRoad Pro MT5
Relicus LLC
5 (24)
RelicusRoad Pro: 퀀트 시장 운영 체제 70% 할인 평생 이용권 (한정 시간) - 2,000명 이상의 트레이더와 함께하세요 왜 대부분의 트레이더는 "완벽한" 지표를 가지고도 실패할까요? 진공 상태에서 단일 개념 만으로 거래하기 때문입니다. 문맥 없는 신호는 도박입니다. 지속적인 승리를 위해서는 컨플루언스(중첩) 가 필요합니다. RelicusRoad Pro는 단순한 화살표 지표가 아닙니다. 완전한 퀀트 시장 생태계 입니다. 독점적인 변동성 모델링을 사용하여 가격이 이동하는 "공정 가치 로드"를 매핑하고, 단순 노이즈와 실제 구조적 돌파를 구분합니다. 추측은 그만두세요. 기관급 로드 로직으로 거래를 시작하세요. 핵심 엔진: "Road" 알고리즘 시스템의 중심에는 시장 상황에 실시간으로 적응하는 동적 변동성 채널인 Road Algo 가 있습니다. 세이프 라인(평형) 과 가격이 수학적으로 반전될 가능성이 높은 확장 레벨 을 투영합니다. Simple Road: 일반적인 시장을 위
FX Trend MT5 NG
Daniel Stein
5 (4)
FX Trend NG: 차세대 멀티 마켓 트렌드 인텔리전스 개요 FX Trend NG 는 다중 시간 프레임 기반의 전문 트렌드 분석 및 시장 모니터링 도구입니다. 몇 초 만에 전체 시장 구조를 파악할 수 있도록 설계되었습니다. 여러 차트를 일일이 전환할 필요 없이, 어떤 종목이 추세에 있는지, 어디에서 모멘텀이 약화되고 있는지, 그리고 어떤 시간 프레임이 서로 정렬되어 있는지 즉시 확인할 수 있습니다. 출시 기념 특별 혜택 – FX Trend NG 를 $30 (6개월) 또는 $80 평생 라이선스 로 이용할 수 있습니다. 이미 Stein Investments 고객이신가요? -> 메시지를 보내 전용 고객 그룹에 참여하세요. 설정이나 사용 방법이 필요하신가요? -> Stein Investments 공식 페이지 를 방문하세요. 1. FX Trend NG가 특별한 이유 3단계 추세 로직 – 단순한 Buy / Sell이 아닙니다 • 대부분의 지표는 Buy 또는 Sell 두 가지 상태만 제
Atomic Analyst MT5
Issam Kassas
3.94 (31)
우선적으로 언급할 점은이 거래 지표가 다시 그리지 않고 지연되지 않으며 이를 통해 수동 및 로봇 거래 모두에 이상적이라는 점입니다. 사용자 매뉴얼: 설정, 입력 및 전략. Atomic Analyst는 가격의 강도와 모멘텀을 활용하여 시장에서 더 나은 이점을 찾는 PA Price Action Indicator입니다. 고급 필터를 장착하여 잡음과 거짓 신호를 제거하고 거래 잠재력을 높이는 데 도움이 됩니다. 복잡한 지표의 다중 레이어를 사용하여 Atomic Analyst는 차트를 스캔하고 복잡한 수학적 계산을 간단한 신호와 색상으로 변환하여 초보 트레이더가 이해하고 일관된 거래 결정을 내릴 수 있도록합니다. "Atomic Analyst"는 새로운 및 경험이 풍부한 트레이더를위한 종합적인 거래 솔루션입니다. 프리미엄 지표와 최고 수준의 기능을 하나의 거래 전략에 결합하여 모든 종류의 트레이더에 대한 다재다능한 선택지가되었습니다. 인트라데이 거래 및 스캘핑 전략 : 빠르고 정확한 일일
Btmm state engine pro
Garry James Goodchild
5 (3)
BTMM State Engine Pro is a MetaTrader 5 indicator for traders who use the Beat The Market Maker approach: Asian session context, kill zone timing, level progression, peak formation detection, and a multi-pair scanner from a single chart. It combines cycle state logic with a built-in scanner dashboard so you do not need the same tool on many charts at once. What it does Draws the Asian session range; session times can follow broker server offset or be set in inputs. Tracks level progression (L
RFI levels PRO MT5
Roman Podpora
3.67 (3)
이 지표는 추세 반전 지점과 가격 반등 영역을 정확하게 보여줍니다.       주요 투자자들   . 새로운 트렌드가 형성되는 곳을 파악하고 최대한 정확하게 의사결정을 내리며 모든 거래를 완벽하게 통제합니다. TREND LINES PRO   지표와 함께 사용할 때 최대의 잠재력을 발휘합니다.  VERSION MT4 지표가 보여주는 내용: 새로운 추세의 시작 시 활성화되는 반전 구조 및 반전 수준. 최소한의 위험 대비 수익률을 갖는 이익 실현   (TAKE PROFIT)   및   손절매(STOP LOSS)   레벨 표시       RR 1:2   . 지능형 손실 감소 로직이 적용된 손절매 기능. 지정된 지표에서 두 가지 추세 유형에 대한 반전 패턴을 표시합니다. 지표: 트렌드를 따라   트렌드 라인 프로   (글로벌 트렌드 변화) 트렌드 프로   (빠른 트렌드 변화) 간단하고 효과적입니다       스캐너       실시간 추세 (신규). 다중 시간 프레임 도구 필터링. 표시하다  
FX Power MT5 NG
Daniel Stein
5 (31)
FX Power: 통화 강세 분석으로 더 스마트한 거래 결정을 개요 FX Power 는 어떤 시장 상황에서도 주요 통화와 금의 실제 강세를 이해하기 위한 필수 도구입니다. 강한 통화를 매수하고 약한 통화를 매도함으로써 FX Power 는 거래 결정을 단순화하고 높은 확률의 기회를 발견합니다. 트렌드를 따르거나 극단적인 델타 값을 사용해 반전을 예측하고자 한다면, 이 도구는 귀하의 거래 스타일에 완벽히 적응합니다. 단순히 거래하지 말고, FX Power 로 더 스마트하게 거래하세요. 1. FX Power가 거래자에게 매우 유용한 이유 통화와 금의 실시간 강세 분석 • FX Power 는 주요 통화와 금의 상대적 강세를 계산하고 표시하여 시장 역학에 대한 명확한 통찰력을 제공합니다. • 어떤 자산이 앞서고 있고 어떤 자산이 뒤처지는지 모니터링하여 보다 현명한 거래 결정을 내릴 수 있습니다. 포괄적인 멀티 타임프레임 뷰 • 단기, 중기 및 장기 타임프레임에서 통화와 금의 강세를
Crystal Heikin Ashi Signals
Muhammad Jawad Shabir
5 (2)
Crystal Heikin Ashi Signals - Professional Trend & Signal Detection Indicator Advanced Heikin Ashi Visualization with Intelligent Signal System for Manual & Automated Trading Final Price: $149 ---------> Price goes up $10 after every 10 sales . Limited slots available — act fast . Overview Crystal Heikin Ashi Signals is a professional-grade MetaTrader 5 indicator that combines pure Heikin Ashi candle visualization with an advanced momentum-shift detection system. Designed for both manual traders
Trend Screener Pro MT5
STE S.S.COMPANY
4.84 (103)
트렌드 표시기, 트렌드 트레이딩 및 필터링을 위한 획기적인 고유 솔루션, 하나의 도구 안에 내장된 모든 중요한 트렌드 기능! Forex, 상품, 암호 화폐, 지수 및 주식과 같은 모든 기호/도구에 사용할 수 있는 100% 다시 칠하지 않는 다중 시간 프레임 및 다중 통화 표시기입니다. Trend Screener는 차트에 점이 있는 화살표 추세 신호를 제공하는 효율적인 지표 추세 추종 지표입니다. 추세 분석기 표시기에서 사용할 수 있는 기능: 1. 트렌드 스캐너. 2. 최대 이익 분석이 있는 추세선. 3. 추세 통화 강도 측정기. 4. 경고가 있는 추세 반전 점. 5. 경고가 있는 강력한 추세 점. 6. 추세 화살표 Trend Screener Indicator가 있는 일일 분석 예, 일일 신호 성능...등은 여기에서 찾을 수 있습니다. 여기를 클릭하십시오. LIMITED TIME OFFER : Trend Screener Indicator는 50$ 및 평생 동안만 사용할 수 있습니다.
Currency Strength Dashboard Pro
Anastasia Danilova
5 (1)
Currency Strength Dashboard Pro MetaTrader 5 를 위한 실시간 통화 강도 분석 전문 대시보드 입니다. 이 지표는 8개의 주요 통화 (EUR, USD, GBP, JPY, CHF, AUD, CAD, NZD)의 강도를 계산하고, 28개의 통화쌍 을 동시에 여러 시간 프레임에서 분석하여 표시합니다. 이 대시보드는 트레이더가 추가 계산이나 여러 차트 간 전환 없이 한눈에 시장 전체 상황을 파악 할 수 있도록 해줍니다. 계산 방법 이 지표는 고급 수학적 통화 강도 분석 방법 을 기반으로 합니다. 이는 유사한 지표에서 널리 사용되는 RSI 기반 방법 보다 더 정확하고 객관적인 결과를 제공합니다. 이 방법은 28개의 모든 통화쌍 간의 관계를 동시에 분석 하여 시장에서 실제로 형성되는 힘의 균형을 보다 명확하고 편향 없이 보여줍니다. 실시간 대시보드 메인 테이블에는 8개의 통화 에 대한 전체 데이터가 표시됩니다. Rank (순위) — 전체 강도 기준 통화 순위, 1
Gann Made Easy MT5
Oleg Rodin
5 (1)
Gann Made Easy 는 mr.의 이론을 사용하여 최고의 거래 원칙을 기반으로 하는 전문적이고 사용하기 쉬운 Forex 거래 시스템입니다. W.D. 간. 이 표시기는 Stop Loss 및 Take Profit Levels를 포함하여 정확한 BUY 및 SELL 신호를 제공합니다. PUSH 알림을 사용하여 이동 중에도 거래할 수 있습니다. 구매 후 거래 방법 안내 및 유용한 추가 지표를 무료로 받으시려면 저에게 연락주세요! 아마도 Gann 거래 방법에 대해 이미 여러 번 들었을 것입니다. 일반적으로 Gann의 이론은 초보자 거래자뿐만 아니라 이미 거래 경험이 있는 사람들에게도 매우 복잡한 것입니다. Gann의 거래 방식은 이론적으로 적용하기 쉽지 않기 때문입니다. 나는 그 지식을 연마하고 Forex 지표에 최고의 원칙을 적용하기 위해 몇 년을 보냈습니다. 표시기는 적용하기가 매우 쉽습니다. 차트에 첨부하고 간단한 거래 권장 사항을 따르기만 하면 됩니다. 지표는 지속적으로 시장 분석
ARICoins
Temirlan Kdyrkhan
ARICoin is a powerful trading companion designed to generate high-probability entry signals with dynamic TP/SL/DP levels based on volatility. Built-in performance tracking shows win/loss stats, PP1/PP2 hits, and success rates all updated live. Key Features: Buy/Sell signals with adaptive volatility bands Real-time TP/SL/DP levels based on ATR Built-in MA Filter with optional ATR/StdDev volatility Performance stats panel (Success, Profit/Loss, PP1/PP2) Alerts via popup, sound, push, or email Cust
Market Structure Order Block Dashboard MT5 는 MetaTrader 5용 MT5 인디케이터 로, 시장 구조 및 ICT / Smart Money Concepts에 기반합니다: HH/HL/LH/LL , BOS , ChoCH 뿐 아니라 Order Blocks , Fair Value Gaps (FVG) , 유동성 (EQH/EQL, sweeps), 세션 / Kill Zones , 그리고 Volume Profile 을 통합하여 콤팩트한 컨플루언스 대시보드를 제공합니다. 중요: 본 제품은 분석 도구 입니다. 자동 매매를 실행하지 않습니다( EA가 아님 ). 구매자 보너스 구매 후 제 스토어에서 보너스 인디케이터 2개 를 (선택하여) 무료로 받을 수 있습니다. 보너스 수령 방법: 1) 본 제품에 대한 솔직한 리뷰를 남겨주세요. 2) MQL5 메시지로 BONUS MSOB + 선택한 인디케이터 2개 이름 을 보내주세요. 주요 기능 시장 구조: HH/HL/LH/LL
Trend indicator AI mt5
Ramil Minniakhmetov
5 (16)
트렌드 인공 지능 지표는 실행 가능한 진입 점 및 반전 경고와 추세 식별을 결합하여 상인의 시장 분석을 향상시킬 훌륭한 도구입니다. 이 표시기는 사용자가 자신감과 정밀도로 외환 시장의 복잡성을 탐색 할 수 있도록 지원합니다 기본 신호 외에도 트렌드 인공 지능 지표는 풀백 또는 되돌림 중에 발생하는 2 차 진입 점을 식별하여 거래자가 기존 트렌드 내에서 가격 수정을 활용할 수 있도록합니다. 중요한 장점: ·작동 4 및 5 *명확한 구매 또는 판매 신호 *다시 칠하지 않습니다 *모든 자산에서 작동 나는 전보 사기에 개 또는 세트를 판매하지 않도록주의. 모든 설정은 블로그에 여기에 무료.  중요! 지침 및 보너스를 얻기 위해 구입 후 즉시 저에게 연락! 진짜 가동 감시는 뿐 아니라 나의 다른 제품 여기에서 찾아낼 수 있습니다: https://www.mql5.com/en/users/mechanic/seller&nbsp ; 설정 및 입력: 모든 자산에 대해 기본 설정을 권
Grabber System MT5
Ihor Otkydach
4.83 (23)
탁월한 기술적 지표인 Grabber를 소개합니다. 이 도구는 즉시 사용 가능한 “올인원(All-Inclusive)” 트레이딩 전략으로 작동합니다. 하나의 코드 안에 강력한 시장 기술 분석 도구, 매매 신호(화살표), 알림 기능, 푸시 알림이 통합되어 있습니다. 이 인디케이터를 구매하신 모든 분들께는 다음의 항목이 무료로 제공됩니다: Grabber 유틸리티: 오픈 포지션을 자동으로 관리하는 도구 단계별 영상 매뉴얼: 설치, 설정, 그리고 실제 거래 방법을 안내 맞춤형 세트 파일: 인디케이터를 빠르게 자동 설정하여 최고의 성과를 낼 수 있도록 도와줍니다 다른 전략은 이제 잊어버리세요! Grabber만이 여러분을 새로운 트레이딩의 정점으로 이끌어 줄 수 있습니다. Grabber 전략의 주요 특징: 거래 시간 프레임: M5부터 H4까지 거래 가능한 자산: 어떤 자산이든 사용 가능하지만, 제가 직접 테스트한 종목들을 추천드립니다 (GBPUSD, GBPCAD, GBPCHF, AUDCAD, AU
Quantum TrendPulse
Bogdan Ion Puscasu
5 (22)
SuperTrend   ,   RSI   ,   Stochastic   의 힘을 하나의 포괄적인 지표로 결합하여 트레이딩 잠재력을 극대화하는 궁극의 트레이딩 도구   인 Quantum TrendPulse를   소개합니다. 정밀성과 효율성을 추구하는 트레이더를 위해 설계된 이 지표는 시장 추세, 모멘텀 변화, 최적의 진입 및 종료 지점을 자신 있게 식별하는 데 도움이 됩니다. 주요 특징: SuperTrend 통합:   주요 시장 추세를 쉽게 따라가고 수익성의 물결을 타세요. RSI 정밀도:   매수 과다 및 매도 과다 수준을 감지하여 시장 반전 시점을 파악하는 데 적합하며 SuperTrend 필터로 사용 가능 확률적 정확도:   변동성이 큰 시장에서 숨겨진 기회를 찾기 위해 확률적 진동   을 활용하고 SuperTrend의 필터로 사용 다중 시간대 분석:   M5부터 H1 또는 H4까지 다양한 시간대에 걸쳐 시장을 최신 상태로 유지하세요. 맞춤형 알림:   맞춤형 거래 조건이 충족되면
Bill Williams Advanced
Siarhei Vashchylka
5 (11)
Bill Williams Advanced is designed for automatic chart analysis using Bill Williams' "Profitunity" system. The indicator analyzes four timeframes at once. Manual (Be sure to read before purchasing) Advantages 1. Analyzes the chart using Bill Williams' "Profitunity" system. Signals are displayed in a table in the corner of the screen and on the price chart. 2. Finds all known AO and AC signals, as well as zone signals. Equipped with a trend filter based on the Alligator. 3. Finds "Divergence Bar
CGE Trading Suite
Carl Gustav Johan Ekstrom
5 (1)
CGE Trading Suite delivers the analytical edge typically reserved for professional trading desks. The platform integrates a full suite of analytical tools into one seamless workflow: dynamic grid mapping, liquidity behavior analysis, ECM, trend lines, MIDAS, trade cycles, and directional channel projections. Together, these provide a unified view of market structure and momentum. Directional clarity is further enhanced by the capital flow index, which measures currency basket strength to identif
ARIPoint
Temirlan Kdyrkhan
ARIPoint is a powerful trading companion designed to generate high-probability entry signals with dynamic TP/SL/DP levels based on volatility. Built-in performance tracking shows win/loss stats, PP1/PP2 hits, and success rates all updated live. Key Features: Buy/Sell signals with adaptive volatility bands Real-time TP/SL/DP levels based on ATR Built-in MA Filter with optional ATR/StdDev volatility Performance stats panel (Success, Profit/Loss, PP1/PP2) Alerts via popup, sound, push, or email Cu
Smart Stop Indicator – 차트 위에서 직접 작동하는 지능형 스톱로스 시스템 개요 Smart Stop Indicator는 감이나 추측이 아닌 명확하고 체계적인 방식으로 스톱로스를 설정하고 싶은 트레이더를 위한 맞춤형 솔루션입니다. 이 도구는 클래식 프라이스 액션 논리(고점, 저점 구조)와 현대적인 브레이크아웃 인식을 결합하여 실제로 가장 논리적인 다음 스톱 레벨을 정확히 식별합니다. 추세, 박스권, 빠른 브레이크아웃 상황 등 어떤 시장에서도 인디케이터는 최적의 SL 구역과 상태(“new”, “broken”, “valid”)를 차트에 직접 표시합니다. 새로운 기능으로 SL 거리의 %ADR 표시가 추가되었습니다. 핵심 기능 자동 시장구조 기반 스톱 설정 • 시장 구조와 실시간 가격 움직임을 기반으로 의미 있는 스톱로스 레벨을 자동으로 탐지합니다. 스마트 브레이크아웃 감지 • 빠른 방향 변화나 돌파 상황에서도 불필요한 조기 스톱 조정을 강요하지 않으며 유연하게 반응합
Gold Sniper Scalper Pro
Ich Khiem Nguyen
3.78 (9)
Gold Sniper Scalper Pro는 XAUUSD에서 허위 돌파 (false breakout) 패턴을 감지하기 위해 특별히 설계된 MetaTrader 5 지표입니다. 가격이 레인지 경계를 돌파하여 돌파 트레이더를 유인한 후 반전하는 4봉 트랩 구조를 식별합니다. 지표는 각 셋업을 17개 품질 요소로 평가하고, 4계층 합류 파이프라인을 통해 처리하며, 7타임프레임 추세 합의 엔진으로 검증하고, 금 변동성 상태 분류기로 필터링합니다. 이 모든 과정이 신호가 차트에 표시되기 전에 완료됩니다. 자세한 사용자 가이드는 작성자의   MQL5 블로그 에서 확인할 수 있습니다. 추가 업데이트는 작성자의   MQL5 채널 을 통해 제공됩니다. 현재 지원 정책에 따라 구매자는 저자가 개발한 선별된 보조 도구에 대한 추가 접근 권한을 받을 수 있습니다. Forex 쌍, 지수 및 암호화폐에서도 작동하지만, 감지 매개변수, 변동성 처리 및 필터 로직은 XAUUSD 특성에 최적화되어 있습니다.
Trend Lines PRO MT5
Roman Podpora
5 (1)
트렌드 라인즈 프로       이 지표는 시장이 실제로 어떤 방향으로 전환되는지 파악하는 데 도움이 됩니다. 실제 추세 반전 지점과 주요 시장 참여자들이 다시 진입하는 지점을 보여줍니다. 보시다시피       BOS 라인       복잡한 설정이나 불필요한 노이즈 없이 더 높은 시간대의 추세 변화와 주요 레벨을 확인할 수 있습니다. 신호는 차트에 다시 그려지지 않고 캔들이 마감된 후에도 계속 표시됩니다. MT4 버전   -   RFI LEVELS PRO   표시기   와 결합 시 최대 잠재력을 발휘합니다. 지표가 보여주는 내용: 실제 변화       추세(BOS 라인) 한 번 신호가 나타나면 그 신호는 계속 유효합니다! 이는 신호를 발생시킨 후 변경될 수 있는 리페인팅 방식의 지표와 중요한 차이점입니다. 리페인팅 방식의 지표는 잠재적으로 자금 손실로 이어질 수 있습니다. 이제 더욱 높은 확률과 정확도로 시장에 진입할 수 있습니다. 또한 화살표가 나타난 후 목표가(익절)에 도달하거나
제작자의 제품 더 보기
It is one of the famous indicator in TradingView platform. Supertrend indicator shows the trend of the market intuitively . You can use it for understanding the trend or get insight about the market. ------- Value & Color -------- You can change the colour (line, filled). Default value is the same as Tradingview Supertrend default value ( period 10, ATR multiplier 3.0)
Nadaraya-Watson Envelope Indicator convert to MT5 Nadaraya Watson Envelope Indicator is one of the monst popular indicator in TradingView. TradingView(Chrome, Edge) eats a huge of CPU, so I convert this to MT5 version. As you can see the screenshot, it's good with Schaff trend RSI Indicator (or others) If you want to get Schaff trend RSI Indicator , Link:  https://www.mql5.com/en/market/product/98011 Window Size - determines the window size for calculating smoothed values. A larger window siz
The Off Trend MT5 Forex Indicator is a   trend-following tool. Its signals are presented in the cloud. When the cloud is green, the trend momentum is bullish, and traders should take buy opportunities. Conversely, the trend momentum is bearish when the cloud is pink, and traders should take sell opportunities. The Off Trend mt5 Forex Indicator fits all timeframes and mt4 currency pairs.
필터:
Gang Liu
29
Gang Liu 2024.10.17 11:45 
 

사용자가 평가에 대한 코멘트를 남기지 않았습니다

Yun-seong Jang
346
개발자의 답변 Yun-seong Jang 2024.10.26 04:19
Hello. Thank you for your purchasing. Anyway, u mean that this indi and Trading view's indi have different result, right? Um... Are they have the same parameter value? (or sometimes when market value suddenly moved by Big events, there can be the problem. this is not a system problem. then, you can refresh the chart, it will be fine.)
Sorry about bad english.
리뷰 답변