Diamond Pattern Scanner
- 지표
-
Reza Aghajanpour
 =============================================================================================
<<<<<< Our team after 19 years of experience in the markets and programming would like to share winner solutions with you. >>>>>> - 버전: 1.3
- 업데이트됨: 27 2월 2026
- 활성화: 20
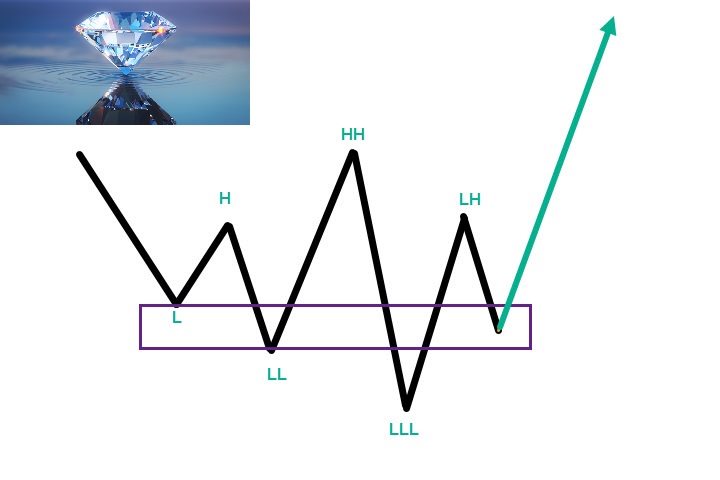
This is diamond!
Contact me to send you instruction and add you in group.
Diamond Pattern is based on Read The Market(RTM) concepts. The purpose of this model is to face the big players of the market (financial institutions and banks), As you know in financial markets, big traders try to fool small traders, but RTM prevent traders from getting trapped. This style is formed in terms of price candles and presented according to market supply and demand areas and no price oscillator is used in it. RTM concepts are very suitable for all kinds of investments, including long-term, medium-term, short-term and scalping.
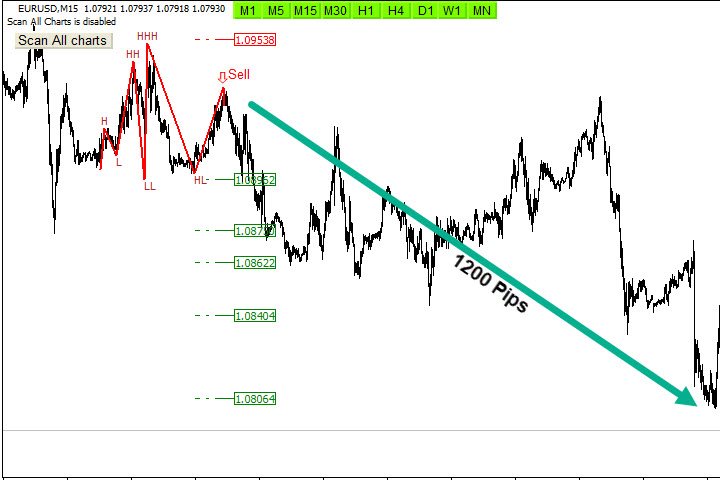
Diamond Pattern is one of the most important pattern in RTM concepts, when pattern forms, It is a strong signal for a reversal of the current trend with high win rate. This pattern occurs when a strong up or down trending price shows a sideways movement over a long time that forms a diamond shape.
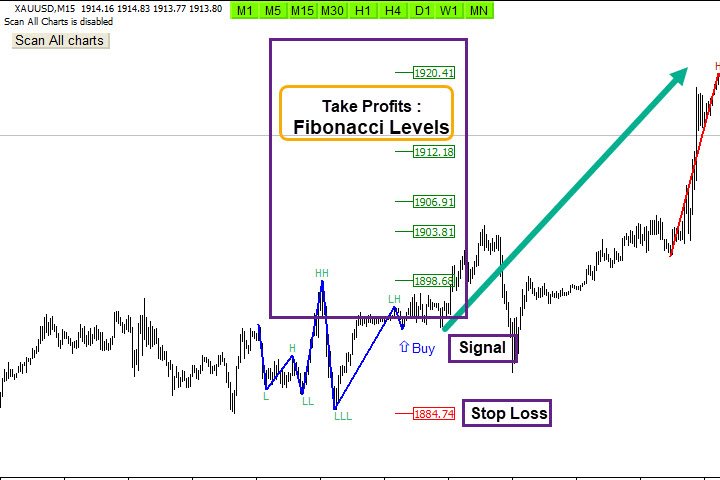
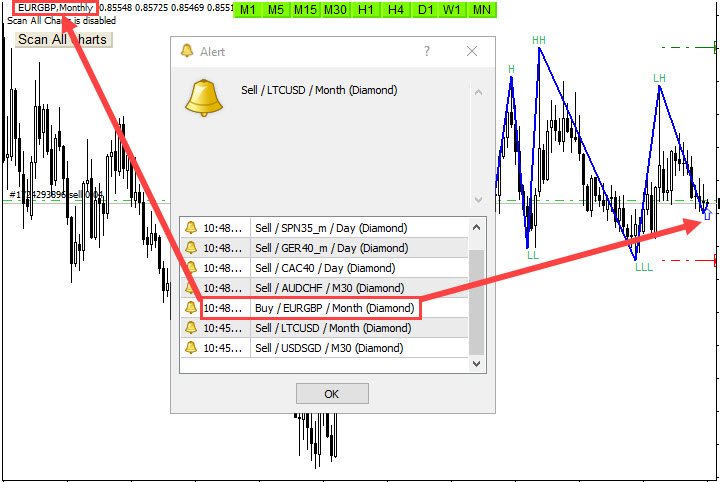
The Diamond Pattern Scanner indicator Scans All charts just by pressing one click. It has stop loss, Take profits and entry point levels with using Fibonacci levels and candlestick checking to find the best entry point and exit of trading. It finds signals immediately with alarm and notification on mobile app for easy trading.Main Features:
- Detect the best and most common successful reversal trend : Diamond Pattern, Inverse Diamond Pattern
- Easy-to-use and user-friendly indicator
- NO repaint
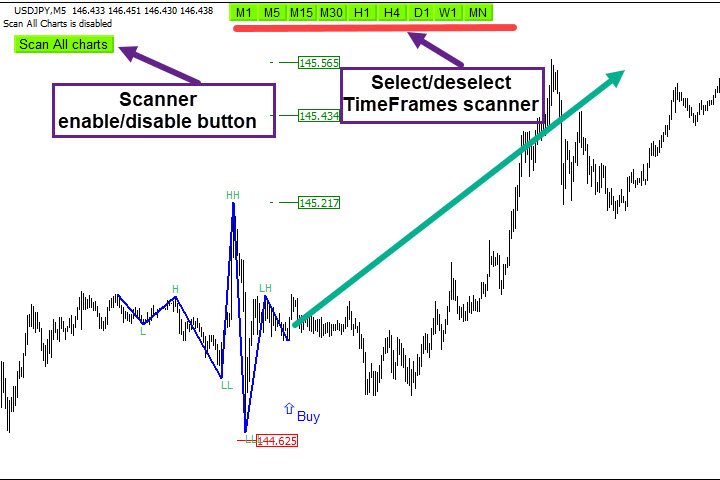
- Scan All charts button ( Forex, Crypto, Indices and commodities )
- Select and deselect time frames button for scan (M1,M5,M15,M30,H1,H4,D1,W1,MN)
- It displays and pushes notification stop-loss, take profits and entry-point levels
- Candlestick check for the best entry point
- Use Fibonacci levels
- Sending the alert and push notification
- method Engulfing/breakout - Engulfing on the edge of pattern / Breakout neck of pattern
- Alert enable/disable base on your setting time
- Adjust the pattern setting
How to test:
Contact me to send you tester file. It is free on USDCHF and AUDCHF real chart.
Input Parameters :
=========Scanner============
- Scan All Charts – Enable
- Scan the number of candles – Amount of history bars to evaluate
- Re-scan Timer – Re-scan all charts in all time frames after passing time
- mode = Engulfing/breakout - Engulfing on the edge of pattern / Breakout neck of pattern
=======Display/style Options============
- Display Options – Display or do not SL & TP & Entry levels
- Stop Loss levels and Breakout Style - Set the Fonts and colors of patterns
========ALERT SETTINGS ==========
- Display Alert or Push Notification – Enable or disable Alert or Push Notification
- How many candles are past a pattern – Maximum Number of candles Passed from a pattern to allow alert
- Alert Buffer Size – Maximum save alert to prevent duplicate alerts
- Alert start/end time – Determine trading hours based on the computer clock to activate and deactivate the alarm
사용자가 평가에 대한 코멘트를 남기지 않았습니다
Enjoy your trading. 🌹⛱️🏖️🥇😍
⭐⭐⭐⭐⭐