KT Forex Line MT4

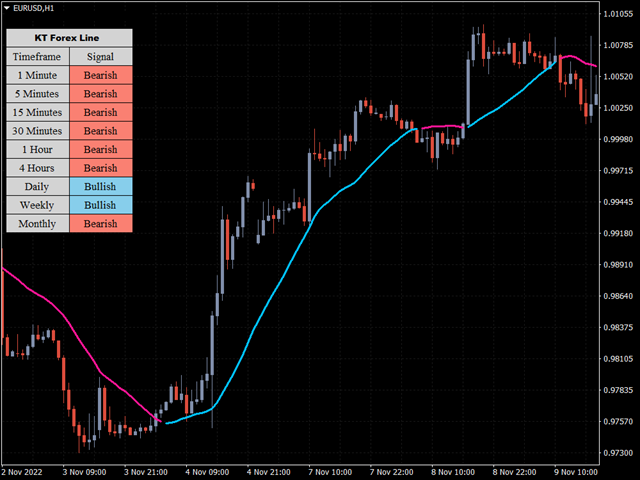
KT Forex Line can be described as an improved version of the moving average indicator. The indicator is embedded in the main trading chart and features a line that switches between blue and white depending on the prevailing direction or mood of the market.

Utilizing the indicator is simple. You do not need to understand complex graphs and intricate lines. Recognize the indicator line's color and trade accordingly.

Key Features

  • The indicator has customizable colors, with the blue and red being the default setting.
  • The indicator is simple to interpret and suitable for expert and beginner forex traders.
  • You can use this indicator for trading existing trends and trend reversals.
  • It works better on higher timeframe charts.
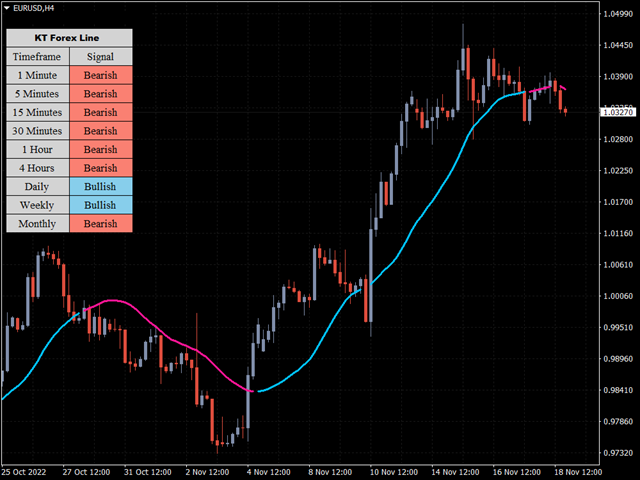
Buy Signal

  • The growth value of the currency pair in question is highlighted through the indicator line in an up-trending market.
  • The indicator line should be above the signal candle's closing point.

Given an uptrend in the market, a long position can be initiated on the signal candle after the line has reached these values.
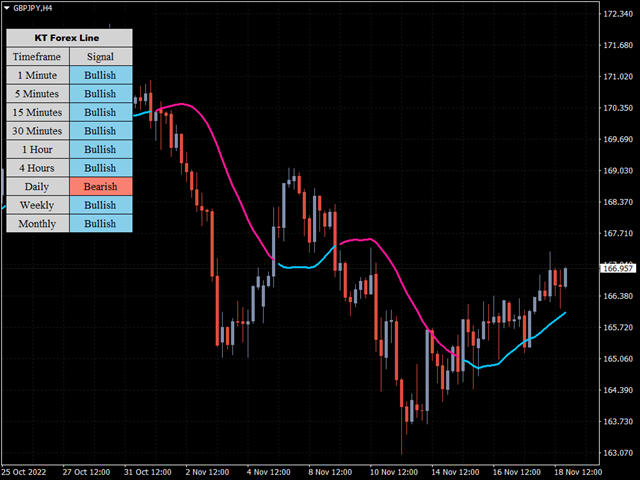
Sell Signal

  • The indicator line changes from blue to white and moves downward.
  • The signal candle closes below the indicator line.

A sell trade can be initiated if these conditions appear on a particular candle. As soon as the indicator line's values, such as color or direction, change, the trade should be instantly closed.
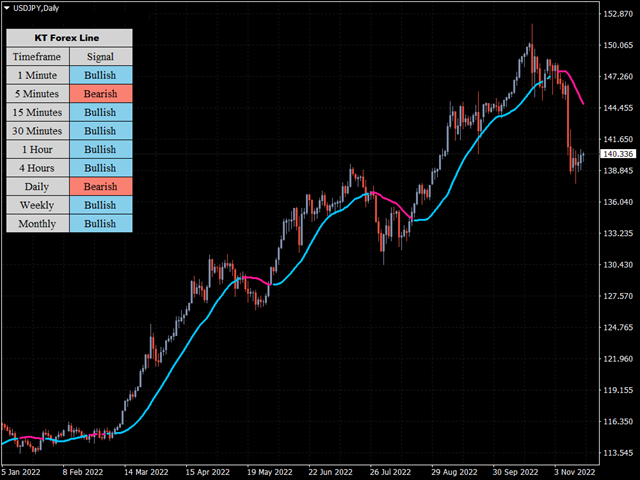
Conclusion

KT Forex Line is among the simplest technical indicators to use. It is made to function best for forex trading and is popular with most traders that employ moving average trading systems. 

All that is needed is an understanding of the simple dynamics behind the indicator’s line colors. For example, when the line's color switches from white to blue, it is a buy signal; when it switches back to white, it is a sell signal. 
추천 제품
Trend Power
Pavel Zamoshnikov
4.43 (7)
A very powerful tool that analyzes the direction and the strength of the 8 major currencies: EUR, GBP, AUD, NZD, CAD, CHF, JPY, USD – both in real time, and on historical data. The indicator generates a sound signal and a message when a trend changes. Never repaints signal. The strength of the signal is calculated for all pairs which include these currencies (28 pairs total), can have value from 0 to 6 on a bullish trend, and from 0 to -6 on a bearish trend. Thus, you will never miss a good move
Tiger Trend
Leandro Bernardez Camero
Tiger Trend – 동적 범위 기반 추세 반전 지표 최신 정보를 받아보려면 채널에 가입하세요: https://www.mql5.com/en/channels/forexnewadvisor Tiger Trend 는 최근 가격 범위에서 계산된 적응형 지지 및 저항 수준을 기반으로 추세 반전을 감지하는 동적 추세 지표입니다. 이 지표는 종가가 이러한 동적으로 조정된 임계값과 어떻게 상호작용하는지를 분석하여 모멘텀이 전환되는 시점을 식별하는 데 도움을 줍니다. 핵심 개념: 사용자가 정의한 위험 매개변수를 기반으로 평균 가격 범위를 분석하여 동적 지지/저항 수준 계산 가격이 이러한 적응형 수준 위나 아래로 마감될 때 추세 변화 감지 차트에 매수 및 매도 반전 지점을 나타내는 화살표로 시각적 신호 제공 화살표 신호와 동기화된 경고 시스템을 통해 실시간 추세 변화 알림 Tiger Trend는 특히 인트라데이 및 스윙 트레이더가 초기 시장 모멘텀 전환을 식별하는 데 유용합니다. 작동 방식 신
Last 50 Pips
Martin Alejandro Bamonte
Last 50 Pips 지표는 최근 가격 움직임을 기반으로 매수 및 매도 기회를 빠르게 식별하도록 설계되었습니다. 최근 캔들의 가격 변화를 측정하여 가격이 방향을 바꿀 수 있는 순간을 노란색으로 강조 표시합니다. 매수 신호: 지표가 빨간색 에서 노란색 으로 변경될 때 매수 포지션을 열어야 합니다. 이는 하락세에서 상승세로의 전환을 암시합니다. 얼마나 쉬운지 확인하려면 이미지를 참조하세요. 매도 신호: 지표가 녹색 에서 노란색 으로 변경될 때 매도 포지션을 열어야 합니다. 이는 상승세에서 하락세로의 전환 가능성을 나타냅니다. 알림: 이 지표는 또한 사용자에게 모든 기기에서 차트의 새로운 신호에 신속하게 반응할 수 있도록 소리, 이메일 또는 푸시 알림을 통한 실시간 알림을 받을 수 있는 옵션을 제공합니다. 질문이 있으면 언제든지 저에게 연락하세요 :)
This is an original, agile, and excellent trending system. Whether you are a beginner trading novice or a professional trader, this set of indicators can help you quickly and timely track the latest changes in market trends. It has the following characteristics: The method of use is extremely simple, plug and play, and the display of all trend analysis results is clear at a glance; There is no need to configure any functional parameters, the trend tracking indicator will automatically analyze th
TrendMaster MT4
Giacomo Donati
How TrendMaster Works TrendMaster is a trading indicator designed to streamline and enhance your chart analysis. Using algorithmic logic, it reviews historical price data to generate a dynamic reference line. When price action crosses this line, a "BUY" or "SELL" signal is displayed on your chart. The goal is to assist in identifying potential shifts in price behavior with a clear and user-friendly visual approach. Why Use TrendMaster? The TrendMaster MT4 Indicator helps highlight potential tre
The Power calculates the strength of the long and short forces by the ratio of the price breakthrough to the average amplitude of the previous market. When the intensity is strong, the signal appears on the chart to estimate the direction of the next wave. There is no future function for the indicator. All signals will not move or disappear after they appear, and have a good real-world reference value. The indicator parameters allow the user to make individual adjustments. More EA and Indicators
Unique Trend
Andriy Sydoruk
The Unique Trend indicator tracks market trends, ignoring sharp fluctuations and market noise. The indicator is suitable for trading on small timeframes because it ignores sudden price jumps or price corrections due to the reduction of market noise around the average price. The scan at minima and maxima forms the internal boundaries (channel) when calculating the indicator signals. The channel allows you to remove market noise. iMA and iATR are used to generate signals using the author's algor
PZ Mean Reversion MT4
PZ TRADING SLU
3 (4)
평균 회귀 거래에 대한 전문적이고 정량적인 접근 방식을 구현하는 고유한 지표입니다. 이는 가격이 예측 가능하고 측정 가능한 방식으로 평균으로 전환되고 반환된다는 사실을 이용하여 비정량적 거래 전략을 훨씬 능가하는 명확한 진입 및 퇴장 규칙을 허용합니다. [ Installation Guide | Update Guide | Troubleshooting | FAQ | All Products ] 명확한 거래 신호 놀랍도록 쉬운 거래 사용자 정의 가능한 색상 및 크기 성능 통계 구현 대부분의 거래 전략을 능가합니다. 적절한 SL 및 TP 레벨을 표시합니다. 이메일/음향/시각 알림을 구현합니다. 작동 원리 이 지표는 더 높은 기간에서 완전히 사용자 정의 가능한 이동 평균 주변의 표준 편차를 측정하고 추세 추종 접근 방식을 사용하여 정확하게 거래를 찾습니다. 거래는 현재 차트의 가격 동작을 살펴보고 선택한 더 높은 기간에서 계산된 평균 가격대로 가격이 돌아오면 닫힙니다. 코딩 방식 때문에 지
Hammer Shooting Star v1.1 – Advanced Candlestick Pattern Scanner Author: LIANG1990 Are you searching for a reliable tool to identify market reversals with precision? Hammer Shooting Star v1.1  is a professional MT4 indicator designed to scan and detect high-quality Hammer and Shooting Star candlestick formations. Unlike basic pattern indicators, this tool applies multiple built-in filters (shape, size, trend alignment, and contextual conditions) to reduce false signals and highlight only the cle
Rira Renko
Vitor Palmeira Abbehusen
RENKO on Time Chart This indicator is an enhanced Renko, so you can watch the Renko bricks on the chart to understand price movement more clearly the other improvement is automated box size according to ATR (Average True Range) period you can set the ATR number as you want and the box size of Renko changes automatically based on price movement Inputs Mode: Box size is the input to specify the size of the Renko box you want to print on the chart. This input lets you choose the fixed box siz
FiboZag
Andriy Sydoruk
Indicator FiboZag - transfer the indicator to the chart and the Fibonacci levels will be built automatically on the last ZigZag turn. The main advantage lies in the correct construction of Fibonacci levels and markup of price levels. Simple, visual and effective use. The indicator is not redrawn and does not lag. Works on all currency pairs and on all timeframes.
Master Max
Abdulkarim Karazon
MASTER MA는 이동 평균 교차 기반 지표로, 서로 다른 기간 십자가를 가진 3개의 이동 평균을 사용하여 신호를 생성하고, 전략은 매우 간단하지만, 지표에는 승률/총 이익과 같은 유용한 인스턴트 백 테스트 결과를 보여주는 통계 대시보드가 있습니다. 등등, 이 지표에는 TP 및 SL 입력이 포인트로 표시되므로 TP와 SL을 TP의 경우 녹색 점, SL의 경우 빨간색 x 형태로 차트에 표시할 수 있으며, 지표는 해당 값을 사용하여 승/패 비율을 계산합니다. 이 표시기는 새 막대가 열릴 때 엄격하게 신호를 보냅니다. 신호는 다시 칠해지거나 지연되지 않습니다. 권장 사항 : m5 이상 사용... 일일 목표를 세우세요... 더 나은 결과를 얻기 위해 지표 기간을 가지고 놀아보십시오. 매개 변수: 3개의 이동평균, 기간 및 유형 경고 TP/SL 값은 각 신호와 함께 차트에 인쇄하고 다음을 기준으로 승패를 계산합니다. Dashboard colors and Position 입력
Moving Pivot Average    The pivot indicator compares the selected period with its counterpart from the previous period. The indicator uses very flexible algorithm for pivot value calculating. It allows you to allocate in days a certain time intervals (custom bars) and calculate the average pivot value based on High, Low and Close prices of these bars. How many custom bars will be taken into account is determined by the "Days" setting. The pivot line can be considered an average trend line and us
ADX Shark Scalper
Maxwell Ndzoyiya
ADX Shark Scalper – The Ultimate Hybrid Indicator for Precision Scalping Dive into the markets with the ADX Shark Scalper , a powerful and versatile tool designed for traders who seek precision in every trade. This cutting-edge indicator seamlessly combines multiple advanced technical signals into one streamlined system, allowing you to spot good buy and sell opportunities with ease. At its core, the ADX Shark Scalper leverages the power of trend and momentum detection through the integration of
Trend Flasher
Amarnath K M
Trend Flasher Trend is your friend is the age old saying quote in trading arena, there are though many ways to gauge the trend and its direction, more scientific measure and logically meaningful will be an ATR break outs to identify and spot the trend and its acceleration, so we created this easy to use trend identification panel and optimized super trend based multi time frame panel entry system to aid and help the traders to make their trading decision. Unique Features of Trend Flasher 1. H
이 지표의 핵심 개념은 최고의 멘토 중 한 명인 Arjo가 설계하고 개발한 '공정 가치 갭 이론'에 기반하며, 저는 여기에 개발 요소를 더했습니다. 이 비디오 시리즈에는 완벽하고 포괄적인 설명을 위한 유튜브 링크와 컴파일된 MT4/MT5 시스템 실행 스크린샷이 포함됩니다. 모든 시스템은 모든 플랫폼과 사용자 요청에 맞춰 MT4와 MT5 버전으로 각각 제공될 예정입니다. 선착순 100명에게는 TradingView에서 시스템을 추가로 사용할 수 있는 PineScript 툴을 보너스로 제공합니다. 링크:   https://youtu.be/gT5SFdwIYC0?si=L_ldI4E_pCx4gVhL   제공되는 기능: 1. 링크에 설명된 대로 강세/약세 공정 가치 갭 박스가 자동으로 감지 및 그려집니다. 2. 은밀한 돌파 갭 신호 3. 돌파 갭 신호 4. 푸시 알림 표시기 (선택 사항) 5. 본 시스템은 모든 시간대에서 작동합니다. 권장 시간대는 15분, 1시간, 4시간, 그리고 일일 차트입
The Best Choice compra y venta
Sandro Israel Hernandez Zamora
¿Has escuchado decir que la tendencia es tu amiga? pues nada es mas cierto en el mundo del trading. Este indicador analiza las tendencias y su fuerza para que puedas aprovecharlas y utilizamos un conjunto de indicadores como RSI, %W, MACD y EMAS para analizar el mercado y sus movimientos, por lo que podrás mantener tu gráfico limpio sabiendo que todos estos indicadores los tienes en uno solo. Este, como cualquier indicador, no representa una certeza de compra o venta definitiva, por lo siempre r
The 4 headed dragon is an indicator that has two functions. 1) Set the background trend. 2) Mark the predominant trend. By combining these two indicator signals, we will be able to trade for or against the trend, adapting the signals to your reading of the market. You can download the demo and test it yourself. 1) Set the background trend.   Define four possibilities of trend that are the four heads of the dragon, marked by colors on the indicator, marking a) Powerful buying trend. b) Weak
PrecisionCore Arrows
Cosmas Akamadu Nwachukwu
This indicator gives fewer signals but precise when it does. Its a little scaled down version of ControlEdge Fx indicator , that gives less number of signal with less precise. If you want one the gives more signals and more accurate in catching larger trends you might want to check out ControlEdge Fx in this link  https://www.mql5.com/en/market/product/175731 Enter Buy when the Blue Arrow appears  Exit Buy when the Red X sign appears Enter Sell when the Red Arrow Appears    Exit Sell when the
FREE
Trend New
Vitalii Zakharuk
Trend New Trend Indicator, shows the signals for entry. Displays both entry points and the trend itself. Shows statistically calculated moments for entering the market with arrows. When using the indicator, it is possible to optimally distribute the risk factor. Settings: Uses all one parameter for settings. Selecting a parameter, it is necessary to visually resemble it so that the appropriate graph has a projection of extremes. Options: Length - the number of bars for calculating the indica
Range Filtered AlgoAlpha는 시장 변동성을 분석하여 잠재적인 거래 기회를 식별하도록 설계된 기술 분석 도구입니다. AlgoAlpha의 원래 TradingView 지표를 MetaTrader에 적용한 이 버전은 여러 분석 방법을 결합하여 시각적인 시장 평가를 제공합니다. 기술적 특징 가격 평활화를 위한 칼만 필터링(Kalman Filtering) 적용 변동성 측정을 위한 ATR 기반 밴드(ATR-based Bands) 통합 추세 분석을 위한 슈퍼트렌드(Supertrend) 요소 포함 색상 캔들(Candles) 및 마커(Markers)를 통한 시각적 신호 제공 구성 가능한 알림 옵션(Configurable Alerts) 제공 기능 이 지표는 시장 데이터를 처리하여 다음을 수행합니다: ATR(평균 실제 범위)을 사용한 변동성 범위 계산 시장 노이즈 감소를 위한 필터링 기술(Filtering Techniques) 적용 시각적 요소(Visual Elements)를 통한 잠재적
Rhino NW
Sergei Shishaev
Нестандартный индикатор определения текущего тренда. Альтернативный подход к определению текущей рыночной тенденции. В основе лежит уникальный алгоритм. Не используются   скользящие средние , осцилляторы , супер-тренды и прочие стандартные индикаторы. Для таймфреймов:   от M15 до D1 . Для стилей торговли:  интрадэй, свинг, долгосрок . Может стать готовой торговой стратегией совместно с любым канальным индикатором. Например таким, как индикатор   "Snake" . Внимание! Это индикатор, а не советник,
Scorpion Scalper Pro
Mohamed Amine Talbi
In the age of speed, everyone wants to gets what he/she wants quickly. Trading is all about gaining money, and scalping is a way of doing it in a short time. The "Scorpion Scalper Pro" has been named on the scorpion because of its speed. The indicator serves to provide signals for the M15 timeframe. It also sends Alerts (window alert, email alert, push notification alert) whenever a buy/sell signal occurs, and the alerts are customizable (they can be turned ON or OFF). Indicator inputs : - Buy
Robust Filter
Aleksey Ivanov
5 (1)
The Robust filter   indicator is based on the robust filtering algorithm developed by the author using the multi-period averaged moving median. The algorithm for this averaging is shown in the last screenshot.                The indicator calculates and shows: 1. The direction of the trend; 2. Entry and exit points of positions; 3. StopLoss   lines calculated from current price probability distributions and selected probability of closing an order by StopLoss before the trend revers
Gravity Trend
Svyatoslav Kucher
Determining the current trend is one of the most important tasks of a trader, regardless of the trading style. The Gravity Trend indicator will help you do this with a fairly high probability. Gravity Trend is a trend recognition indicator that uses the author's calculation algorithm. The indicator readings do not change under any conditions. The indicator is suitable for any currency pair, any timeframe. Indicator Parameters Main Settings: HistoryBars - the number of bars to display. FirstPe
移動平均線クロス、ボリンジャーと移動平均線のクロス、移動平均線の角度でサイン表示 MT5インジケータ こちらに サイト とがあります。 このインジケータは3つのパターンでサインを表示(切り替え可能)します。 ①   移動平均線のクロス ②   ボリンジャーバンドと短期移動平均線とのクロス ③   ボリンジャーバンドと短期移動平均線とのクロスと、中期移動平均線と長期移動平均線の角度 移動平均線のクロス 指定した短期移動平均線と長期移動平均線のゴールデンクロスでは買いサイン、デットクロスでは売りサインを表示します。 ディフォルトでは短期は5,長期は20となっています。 もちろん変更可能になります。 移動平均線の種類をEMA(指数平滑移動平均線)やSMMA(平滑化移動平均)などに変更可能で適する価格も変更可能になります。 ボリンジャーバンドと短期移動平均線のクロス ボリンジャーバンド(以降BB)と短期移動平均線のクロスでサインを表示します。 ディフォルトではBB+1σと5MAのゴールデンクロスで買いサイン、BB-1σと5MAのデットクロスで売りサインでサインを表示します。 BBの期間や、B
This Scanner scans moving average(MA) line across multi-currency pairs and multi-time frames and shows all the result in  the dashboard. 1. Current bar is about to cross up the MA line - designated as "Xup". 2. Current bar is about to cross down the MA line - designated as "Xdn". 3. Previous bar that has just crossed up and closed the MA line - designated as "UP". 4. Previous bar that has just crossed down  and closed the MA line - designated as "DN". Input parameters can be changed: MA, dashboa
MA Cross Alerts
Hafis Mohamed Yacine
MA Cross Signal Alerts MA Cross Signal Alerts_v2.0 The Moving Average Cross displays a fast and a slow moving average (MA). A signal arrow is shown when the two MAs cross. An up arrow is displayed if the fast MA crosses above the slow MA and a down arrow is given if the fast MA crosses below the slow MA. The user may change the inputs (close), methods (EMA) and period lengths.  When two Moving Averages cross the indicator will alert once per cross between crosses and mark the cross point with
Adjustable Consecutive Fractals  looks for 2 or more fractals in one direction and sends out a on screen alert, sound alert and push notification, for strong reversal points . Adjustable Consecutive Fractals, shows the fractals on chart along with a color changing text for buy and sell signals when one or more fractals appear on one side of price. Adjustable Consecutive Fractals is based Bill Williams Fractals . The standard Bill Williams fractals are set at a non adjustable 5 bars, BUT withe th
Bull Bear Easy MTF
Naththapach Thanakulchayanan
This indicator, Bull Bear Easy MTF, summarise the strength color graphic and percentage of power for both  Bull and Bear in current market emotion stage which will show you in multi time frames and sum of the total Bull and Bear power strength which is an important information for traders especially you can see all Bull and Bear power in visualized graphic easily, Hope it will be helpful tool for you for making a good decision in trading.
이 제품의 구매자들이 또한 구매함
Neuro Poseidon MT4
Daria Rezueva
4.96 (26)
Neuro Poseidon is a new indicator by Daria Rezueva. It combines precise trading signals with adaptive TP/SL levels - creating best possible trades as a result! Message me and get  Neuro Poseidon Assistant  as a gift to automize your trading process! What makes it stand out? 1. Proven profitability on all assets and timeframes 2. Only confirmed BUY and SELL signals present on the chart 3. Adaptive TP & SL levels generated by the software for each trade 4. Easy to understand - suitable for all
M1 Sniper
Oleg Rodin
5 (23)
M1 SNIPER 는 사용하기 쉬운 거래 지표 시스템입니다. M1 시간대에 맞춰 설계된 화살표 지표입니다. 이 지표는 M1 시간대 스캘핑을 위한 단독 시스템으로 사용할 수 있으며, 기존 거래 시스템의 일부로도 사용할 수 있습니다. 이 거래 시스템은 M1 시간대 거래용으로 특별히 설계되었지만, 다른 시간대에도 사용할 수 있습니다. 원래는 XAUUSD와 BTCUSD 거래를 위해 이 방법을 설계했지만, 다른 시장 거래에도 유용하다는 것을 알게 되었습니다. 이 지표의 신호는 추세 방향과 반대로 거래될 수 있습니다. 저는 지표의 신호를 활용하여 양방향으로 거래할 수 있도록 돕는 특별한 거래 기법을 알려드립니다. 이 방법은 특별한 동적 지지선과 저항선 가격 영역을 활용하는 것을 기반으로 합니다. 구매하시면 M1 SNIPER 화살표 지표를 바로 다운로드하실 수 있습니다. 또한, 아래 스크린샷에 표시된 Apollo Dynamic SR 지표는 M1 SNIPER 도구를 사용하는 모든 사용자에게 무료로
Gann Made Easy
Oleg Rodin
4.84 (164)
Gann Made Easy 는 mr.의 이론을 사용하여 최고의 거래 원칙을 기반으로 하는 전문적이고 사용하기 쉬운 Forex 거래 시스템입니다. W.D. 간. 이 표시기는 Stop Loss 및 Take Profit Levels를 포함하여 정확한 BUY 및 SELL 신호를 제공합니다. PUSH 알림을 사용하여 이동 중에도 거래할 수 있습니다. 구매 후 거래 방법 안내 및 유용한 추가 지표를 무료로 받으시려면 저에게 연락주세요! 아마도 Gann 거래 방법에 대해 이미 여러 번 들었을 것입니다. 일반적으로 Gann의 이론은 초보자 거래자뿐만 아니라 이미 거래 경험이 있는 사람들에게도 매우 복잡한 것입니다. Gann의 거래 방식은 이론적으로 적용하기 쉽지 않기 때문입니다. 나는 그 지식을 연마하고 Forex 지표에 최고의 원칙을 적용하기 위해 몇 년을 보냈습니다. 표시기는 적용하기가 매우 쉽습니다. 차트에 첨부하고 간단한 거래 권장 사항을 따르기만 하면 됩니다. 지표는 지속적으로 시장 분석
Scalper Inside PRO
Alexey Minkov
4.74 (68)
Scalper Inside PRO Scalper Inside PRO is an intraday trend and scalping indicator for MetaTrader 4 that uses an exclusive algorithm to quickly detect market direction and key target levels. It automatically calculates entry, exit and multiple profit targets, and shows detailed performance statistics so you can see how different instruments and strategies performed. This helps you choose the most suitable trading instruments for the current market conditions. Additionally, you can easily integrat
PRO Renko System
Oleg Rodin
5 (30)
PRO Renko System 은 RENKO 차트 거래를 위해 특별히 고안된 매우 정확한 거래 시스템입니다. 이것은 다양한 거래 상품에 적용될 수있는 보편적 인 시스템입니다. 체계는 효과적으로 당신에게 정확한 반전 신호에 접근을 주는 소위 시장 소음을 중화합니다. 이 표시기는 사용하기가 매우 쉽고 신호 생성을 담당하는 매개 변수가 하나만 있습니다. 당신은 쉽게 당신의 선택의 어떤 무역 계기에 공구를 적응시킬 수 있고 renko 막대기의 크기. 나는 항상 당신이 내 소프트웨어로 수익성있게 거래 할 수 있도록 추가 지원을 제공 할 준비가되어 있습니다! 나는 당신에게 행복하고 수익성있는 거래를 기원합니다! 구매 후 저에게 연락하십시오! 내 렌코 차트 생성기를 보내드립니다. 또한 내 개인 권장 사항 및 시스템의 다른 모듈을 무료로 공유 할 것입니다!
Dynamic Forex28 Navigator
Bernhard Schweigert
4.43 (7)
Dynamic Forex28 Navigator - 차세대 외환 거래 도구. 현재 49% 할인. Dynamic Forex28 Navigator는 오랫동안 인기 있는 지표의 진화형으로, 세 가지의 힘을 하나로 결합했습니다. 고급 통화 Strength28 지표(695개 리뷰) + 고급 통화 IMPULSE with ALERT(520개 리뷰) + CS28 콤보 신호(보너스). 지표에 대한 자세한 정보 https://www.mql5.com/en/blogs/post/758844 차세대 Strength 지표는 무엇을 제공합니까?  원래 지표에서 좋아했던 모든 것이 새로운 기능과 더 높은 정확도로 강화되었습니다. 주요 기능: 독점적인 통화 Strength 공식.  모든 시간대에 걸쳐 부드럽고 정확한 강도선. 추세와 정확한 진입을 식별하는 데 이상적입니다. 역동적인 시장 피보나치 수준(시장 피보나치).  이 지표에만 있는 고유한 기능. 가격 차트가 아닌 통화 강도에 피보나치가 적용됩니다.
Trend Catcher ind
Ramil Minniakhmetov
5 (1)
트렌드 캐처 인디케이터 트렌드 캐처 인디케이터는 개발자가 자체 개발한 맞춤형 적응형 트렌드 분석 지표들을 조합하여 시장 가격 움직임을 분석합니다. 단기적인 노이즈를 제거하고 근본적인 모멘텀 강도, 변동성 확대, 가격 구조 움직임에 집중하여 진정한 시장 방향을 파악합니다. 또한 이동 평균, RSI, 변동성 필터와 같은 맞춤형 지표들을 활용하여 가격을 평활화하고 트렌드를 필터링합니다. 실제 운영 모니터링 및 기타 제품은 다음 링크에서 확인하실 수 있습니다: https://www.mql5.com/en/users/mechanic/seller 텔레그램에서는 EA나 설정 파일을 판매하지 않습니다. 사기이니 주의하세요. 모든 설정 파일은 블로그에서 무료로 제공됩니다. 중요! 구매 후 즉시 연락 주시면 사용 방법 및 보너스를 드립니다!
Trend Lines PRO
Roman Podpora
5 (1)
트렌드 라인즈 프로       이 지표는 시장이 실제로 어떤 방향으로 전환되는지 파악하는 데 도움이 됩니다. 실제 추세 반전 지점과 주요 시장 참여자들이 다시 진입하는 지점을 보여줍니다. 보시다시피       BOS 라인       복잡한 설정이나 불필요한 노이즈 없이 더 높은 시간대의 추세 변화와 주요 레벨을 확인할 수 있습니다. 신호는 차트에 다시 그려지지 않고 캔들이 마감된 후에도 계속 표시됩니다. VERSION MT 5   -   RFI LEVELS PRO   표시기   와 결합할 때 최대 잠재력을 발휘합니다. 지표가 보여주는 내용: 실제 변화       추세(BOS 라인) 한 번 신호가 나타나면 그 신호는 계속 유효합니다! 이는 신호를 발생시킨 후 변경될 수 있는 리페인팅 방식의 지표와 중요한 차이점입니다. 리페인팅 방식의 지표는 잠재적으로 자금 손실로 이어질 수 있습니다. 이제 더욱 높은 확률과 정확도로 시장에 진입할 수 있습니다. 또한 화살표가 나타난 후 목표가(익절)
Enigmera
Ivan Stefanov
5 (8)
ENIGMERA: 시장의 핵심 중요: MQL5.com의 데모는 Strategy Tester에서 실행되며 Enigmera의 기능을 완전히 반영하지 못할 수 있습니다. 설명, 스크린샷 및 비디오를 확인하여 자세한 내용을 확인하십시오. 질문이 있으면 언제든지 메시지를 보내주세요! 인디케이터의 코드는 완전히 다시 작성되었습니다. 버전 3.0은 새로운 기능을 추가하고 인디케이터가 처음 출시된 이후 누적된 버그를 수정했습니다. 소개 이 인디케이터 및 거래 시스템은 금융 시장에 대한 주목할 만한 접근 방식입니다. ENIGMERA는 프랙탈 주기를 사용하여 정확하게 지원 및 저항 수준을 계산합니다. 실제 축적 단계를 보여주고 방향과 목표를 제공합니다. 트렌드와 수정 모두에서 작동하는 시스템입니다. 작동 방식 인디케이터의 대부분의 기능은 차트 왼쪽에 있는 버튼을 통해 제어되며, 이를 통해 다양한 시장 상황에 빠르게 대응할 수 있습니다. 버튼 ON/OFF – 인디케이터 전체를 표시하거나 숨깁니다.
KT Alpha Hunter Arrows MT4
KEENBASE SOFTWARE SOLUTIONS
대부분의 화살표 지표는 신호만 보여주고, 나머지 판단은 모두 트레이더에게 맡깁니다. KT Alpha Hunter Arrows는 완성된 트레이딩 플랜을 함께 제공합니다. 각 신호 화살표가 표시될 때마다 차트에는 진입 라인, 손절선, 네 개의 익절 목표, 그리고 현재 종목과 시간대가 지금 거래할 만한 가치가 있는지 알려주는 실시간 엣지 판정이 함께 그려집니다. 포함된 Trade Manager EA는 사용자가 수동으로 진입한 이후의 실행 관리를 맡아, 시장이 흔들리고 감정이 개입되기 쉬운 순간에도 거래 원칙을 유지할 수 있도록 돕습니다. 리페인트 없음. 확정된 캔들 기준 신호만 표시. Forex, 골드, 지수, 그리고 사용자가 거래하는 모든 상품을 위해 설계되었습니다. 주요 기능 캔들이 마감된 후에만 표시되는 비리페인트 매수 및 매도 화살표. 각 신호마다 진입 라인, 구조적 손절선, 네 개의 익절 목표 제공. Edge Dashboard가 현재 차트의 매수와 매도 셋업을 별도로 평가. 판
이 지표는 실제 거래에 완벽한 자동 파동 분석 지표입니다! 사례... 참고:   웨이브 그레이딩에 서양식 이름을 사용하는 데 익숙하지 않습니다. Tang Lun(Tang Zhong Shuo Zen)의 명명 규칙의 영향으로 기본 웨이브를   펜   으로 명명하고 2차 웨이브 밴드를   세그먼트   로 명명했습니다. 동시에, 세그먼트에는 추세 방향이 있습니다.   주요 추세 세그먼트에는   이름이 지정되지만(이 이름 지정 방법은 향후 노트에서 사용됩니다. 먼저 말씀드리겠습니다.) 알고리즘은 굴곡 이론과 거의 관련이 없으므로 그렇게 해서는 안 됩니다. 이는 나의 시장 분석을   통해 요약된 끊임없이 변화하고 복잡한 운영 규칙을   반영합니다. 밴드는 더 이상 사람마다 다르지 않도록 표준화되고 정의되었습니다. 인위적인 간섭의 드로잉 방법은 시장 진입을 엄격하게 분석하는 데 핵심적인 역할을 합니다. 이 지표를 사용하는 것은 거래 인터페이스의 미학을 개선하고 원래의 K-line 거래를
Genesis Matrix Pro is a professional multi-timeframe trend detection indicator designed to help traders identify high-quality market alignment with clarity and structure. It combines 12 different technical indicators into one visual alignment matrix, allowing traders to quickly see when market conditions are bullish, bearish, or neutral. A signal is generated only when the selected strategies are aligned, helping reduce noise and improve decision-making. PLEASE CONTACT ME AFTER PURCHASE TO GET
이 제품은 2026년 시장에 맞게 업데이트되었으며 최신 MT5 빌드에 최적화되었습니다. 가격 업데이트 안내: Smart Trend Trading System은 현재 $99 에 제공됩니다. 다음 30회 구매 후 가격은 $199 로 인상됩니다. 특별 혜택: Smart Trend Trading System 구매 후 저에게 개인 메시지를 보내시면 Smart Universal EA를 무료 로 받을 수 있으며, Smart Trend 신호를 자동 거래로 전환할 수 있습니다. Smart Trend Trading System은 리페인트 없음, 재그리기 없음, 지연 없음의 완전한 트레이딩 시스템으로, 더 깨끗한 신호, 더 나은 추세 방향, 그리고 더 체계적인 시장 거래 방식을 원하는 트레이더를 위해 제작되었습니다. Online course , manual and download presets . 이 시스템은 추세 감지, 반전 구간, Smart Cloud, 트레일링 스톱 로직, 지지와 저항, 캔들 색
MTF Supply Demand Zones
Georgios Kalomoiropoulos
4.82 (22)
자동화된 수요 및 공급 구역의 차세대. 모든 차트에서 작동하는 새롭고 혁신적인 알고리즘. 모든 구역은 시장의 가격 움직임에 따라 동적으로 생성됩니다. 두 가지 유형의 경고 --> 1)가격이 영역에 도달할 때 2)새로운 영역이 형성될 때 당신은 더 이상 쓸모없는 지표를 얻을 수 없습니다. 입증된 결과로 완벽한 거래 전략을 얻을 수 있습니다.     새로운 기능:     가격이 공급/수요 영역에 도달하면 경고     새로운 공급/수요 구역이 생성되면 알림     푸시 알림 알림     핍의 영역 너비 레이블     기동특무부대에 한 번 더 시간이 주어집니다. 따라서 현재보다 위의 2개의 시간 프레임 대신 현재보다 높은 3개의 시간 프레임을 볼 수 있습니다.     Alerts/Zones/MTF 기능을 활성화/비활성화하는 버튼 당신이 얻는 이점:     거래에서 감정을 제거하십시오.     거래 항목을 객관화하십시오.     높은 확률 설정을 사용하여 수익
PZ Trend Trading
PZ TRADING SLU
4.8 (5)
Capture every opportunity: your go-to indicator for profitable trend trading Trend Trading is an indicator designed to profit as much as possible from trends taking place in the market, by timing pullbacks and breakouts. It finds trading opportunities by analyzing what the price is doing during established trends. [ Installation Guide | Update Guide | Troubleshooting | FAQ | All Products ] Trade financial markets with confidence and efficiency Profit from established trends without getting whips
Step into the world of Forex trading with confidence, clarity, and precision using   Gold Indicator   a next-generation tool engineered to take your trading performance to the next level. Whether you’re a seasoned professional or just beginning your journey in the currency markets, Gold Indicator equips you with powerful insights and help you trade smarter, not harder. Built on the proven synergy of three advanced indicators, Gold Indicator focuses exclusively on medium and long-term trends eli
MetaBands M4
Vahidreza Heidar Gholami
3.5 (6)
MetaBands uses powerful and unique algorithms to draw channels and detect trends so that it can provide traders with potential points for entering and exiting trades. It’s a channel indicator plus a powerful trend indicator. It includes different types of channels which can be merged to create new channels simply by using the input parameters. MetaBands uses all types of alerts to notify users about market events. Features Supports most of the channel algorithms Powerful trend detection algorith
Current event:  https://c.mql5.com/1/326/A2SR2025_NoMusic.gif A. A2SR이란 무엇입니까 ?   * 선행 기술 지표입니다(재도장 없음, 지연 없음). -- 안내 : https://www.mql5.com/en/blogs/post/734748/page4#comment_16532516 -- 및 https://www.mql5.com/en/users/yohana/blog A2SR에는 지원(수요) 및 저항(공급) 수준을 결정하는 특별한 기술이 있습니다. 우리가 인터넷에서 본 일반적인 방식과 달리 A2SR은 실제 SR 수준을 결정하는 독창적인 개념을 가지고 있습니다. 원래 기술은 인터넷에서 가져온 것이 아니며 인터넷에 게시된 적도 없습니다. A2SR은 거래 스타일에 따라 SR 수준을 자동으로 선택합니다. 시간 프레임을 변경해도 SR 레벨은 그대로 유지됩니다. 사용하는 시간 프레임에서 실제 SR을 얻지 못하기 때문입니다. A2SR은 거래를
M30/H1/H4 스윙 버전 출시 큰 움직임을 잡고 싶으신가요? Gold Signal Swing Pro (M30/H1/H4). 목표: 거래당 $20-$80+. https://www.mql5.com/en/market/product/177643 KURAMA GOLD SIGNAL PRO (MT4) — 7층 필터, 자동 TP/SL, 품질 점수를 탑재한 XAUUSD 완벽 트레이딩 시스템 리페인트 없음. 리드로우 없음. 지연 없음. 모든 신호는 영구적입니다. 보이는 것이 그대로입니다. 보너스: 영구 라이선스 구매자에게 AI Zone Radar ($59 상당) + 전체 PDF 매뉴얼을 무료 제공. 구매 후 메시지를 보내주세요. AI Zone Radar: https://www.mql5.com/en/market/product/175834 트레이더의 신뢰: 활발한 골드 트레이더 커뮤니티에서 이미 사용 중. 정확도와 사
BTMM State Engine Pro MT4
Garry James Goodchild
BTMM State Engine Pro is a MetaTrader 4 indicator for traders who use the Beat The Market Maker approach: Asian session context, kill zone timing, level progression, peak formation detection, and a multi-pair scanner from a single chart. It combines cycle state logic with a built-in scanner dashboard so you do not need the same tool on many charts at once. What it does Draws the Asian session range; session times can follow broker server offset or be set in inputs. Tracks level progression (L
Advanced Supply Demand
Bernhard Schweigert
4.91 (300)
현재 40% 할인! 초보자나 전문 트레이더를 위한 최고의 솔루션! 이 보조지표는 우리가 다수의 독창적 기능과 새로운 공식을 통합한 독특하고 고품질이며 저렴한 거래 도구입니다. 이 업데이트를 통해 이중 시간대를 표시할 수 있습니다. 더 높은 TF를 표시할 수 있을 뿐만 아니라 차트 TF와 더 높은 TF 모두를 표시할 수 있습니다: 중첩 영역 표시. 모든 Supply Demand 트레이더들이 좋아할 것입니다. :) 중요한 정보 공개 Advanced Supply Demand의 잠재력을 극대화하려면 다음을 방문하십시오. https://www.mql5.com/ko/blogs/post/720245   진입 또는 목표의 명확한 트리거 포인트를 정확히 찾아냄으로 해서 거래가 어떻게 개선될지 상상해 보십시오. 새로운 알고리즘을 기반으로 매수자와 매도자 간의 잠재적인 불균형을 훨씬 더 쉽게 분간할 수 있습니다. 왜냐하면 가장 강한 공급영역과 가장 강한 수요 영역과 과거에 어떻게 진행 되었는지를(이전
Neo Wave PRO
Nikolay Raykov
Price & Time Market Structure Indicator A professional market structure tool that analyzes waves through both price and time — not price alone. Main Description NeoWave PRO is a professional market structure indicator for MetaTrader 4 designed for traders who want to move beyond traditional one-dimensional wave tools such as ZigZag, swing indicators, and basic high/low systems. Most wave indicators analyze only one thing: Price. But a real market wave is not only a price movement. A true wave de
RFI levels PRO
Roman Podpora
5 (1)
이 지표는 추세 반전 지점과 가격 반등 영역을 정확하게 보여줍니다.       주요 투자자들   . 새로운 트렌드가 형성되는 곳을 파악하고 최대한 정확하게 의사결정을 내리며 모든 거래를 완벽하게 통제합니다. TREND LINES PRO   지표와 함께 사용할 때 최대의 잠재력을 발휘합니다.  VERSION MT5 지표가 보여주는 내용: 새로운 추세의 시작 시 활성화되는 반전 구조 및 반전 수준. 최소한의 위험 대비 수익률을 갖는 이익 실현   (TAKE PROFIT)   및   손절매(STOP LOSS)   레벨 표시       RR 1:2   . 지능형 손실 감소 로직이 적용된 손절매 기능. 지정된 지표에서 두 가지 추세 유형에 대한 반전 패턴을 표시합니다. 지표: 트렌드를 따라   트렌드 라인 프로   (글로벌 트렌드 변화) 트렌드 프로   (빠른 트렌드 변화) 간단하고 효과적입니다       스캐너       실시간 추세 (신규). 다중 시간 프레임 도구 필터링. 표시하다  
Quant Direction
Georgios Kalomoiropoulos
Quant Direction 은 3D 시장 분석 도구입니다. 다양한 매개변수에 걸쳐 정확한 백분율 편차를 계산하면서 완벽하게 객관적인 알고리즘 기반 시장 분석을 제공합니다. 첨단 AI 기반 모델링 도구와 엄격한 테스트를 거쳐 개발된 이 알고리즘은 타의 추종을 불허하는 정확도로 시장을 분석합니다. 플랫폼에서 모든 통화쌍 또는 금융 상품을 분석할 수 있습니다. 단기 거래, 데이 트레이딩, 스윙 트레이딩 등 어떤 유형의 거래를 하든 Quant Direction은 최적의 선택입니다. 운영자가 되는 것의 진정한 이점 퀀트 디렉션의 진정한 장점은 감정, 눈의 피로, 과도한 분석을 완전히 배제한다는 점입니다. 더 이상 수십 개의 차트를 일일이 살펴보며 방향을 찾거나 자신의 판단에 끊임없이 의문을 품을 필요가 없습니다. 이 시스템은 8개의 시간 간격(5개월에서 수개월까지)을 밀리초 단위로 처리합니다. 특정 시점의 주요 시장 참여자를 정확하게 식별하여 항상 성공 확률이 가장 높은 방향으로 거래할
MonsterDash Harmonic Indicator
Paul Geirnaerdt
4.54 (26)
MonsterDash Harmonic Indicator is a harmonic pattern dashboard. It recognizes all major patterns. MonsterDash is a dashboard that displays all detected patterns for all symbols and (almost) all timeframes in sortable and scrollable format. Users can add their own user defined patterns . MonsterDash can open and update charts with the pattern found. Settings MonsterDash's default settings are good enough most of the time. Feel free to fine tune them to your needs. The color settings are for thos
Apollo SR Master
Oleg Rodin
5 (2)
Apollo SR Master는 지지/저항 구간에서의 거래를 더욱 쉽고 안정적으로 만들어 주는 특수 기능을 갖춘 지지/저항 지표입니다. 이 지표는 지역 가격의 고점과 저점을 감지하여 시간 지연 없이 실시간으로 지지/저항 구간을 계산합니다. 새롭게 형성된 저항 구간을 확인하기 위해 지표는 해당 저항 구간을 실제 매도 또는 매수 신호로 활용할 수 있음을 나타내는 특수 신호를 표시합니다. 이 경우, 저항 구간의 강도가 높아지고, 따라서 저항 구간에서의 성공적인 거래 가능성도 높아집니다. 이것이 바로 이 지표의 핵심 아이디어입니다. SR 존은 손절매와 이익실현을 더욱 쉽게 할 수 있도록 해줍니다. 신호 방향에 따라 SR 존 위 또는 아래 공간을 손절매로 활용할 수 있습니다. 또한, 반대쪽 SR 존은 잠재적 이익실현 영역으로 활용할 수 있습니다. 또한 Apollo SR Master 지표를 사용하는 모든 사용자에게 "Apollo Price Action System" 지표를 무료로 제공합니다.
Advanced Currency Strength28 Indicator
Bernhard Schweigert
4.91 (657)
현재 40% 할인 초보자 또는 전문가 트레이더를 위한 최고의 솔루션! 이 지표는 우리가 독점 기능과 새로운 공식을 통합했기 때문에 독특하고 고품질이며 저렴한 거래 도구입니다. 단 하나의 차트로 28 Forex 쌍의 통화 강도를 읽을 수 있습니다! 새로운 추세 또는 스캘핑 기회의 정확한 트리거 포인트를 정확히 찾아낼 수 있기 때문에 거래가 어떻게 개선될지 상상해 보십시오. 사용 설명서: 여기를 클릭  https://www.mql5.com/en/blogs/post/697384 그것이 첫 번째, 원본입니다! 쓸모없는 지망생 클론을 사지 마십시오. 더 스페셜  강력한 통화 모멘텀을 보여주는 하위 창의 화살표 GAP가 거래를 안내합니다! 기본 또는 호가 통화가 과매도/과매도 영역(외부 시장 피보나치 수준)에 있을 때 개별 차트의 기본 창에 경고 표시가 나타납니다. 통화 강도가 외부 범위에서 떨어질 때 풀백/반전 경고. 교차 패턴의 특별 경고 추세를 빠르게 볼 수 있는 다중 시간
Auto Optimized Parabolic RSI: 고급 3D 모멘텀 엔진 대부분의 개인 투자자용 보조지표는 시장의 변동성이 변하는 순간 무용지물이 되는 정적인 입력값에 의존하기 때문에 실패합니다. Auto Optimized Parabolic RSI는 자체적인 수학적 우위를 지속적으로 재계산하여 "보조지표 노후화" 문제를 해결하며, 기관급 퀀트 트레이딩의 적응력을 귀하의 MT5 터미널에 직접 제공합니다. 핵심 이점: 맞춤형 인메모리 3D 최적화   표준 자동 최적화 도구들은 일반적인 보조지표 호출로 터미널에 과부하를 일으켜 MT5 플랫폼을 멈추게 하는 경우가 많습니다. 이 도구는 이러한 병목 현상을 완전히 우회합니다. 맞춤형 네이티브 RAM 기반 계산기로 구축된 내부 엔진은 차트를 로드하거나 타임프레임을 변경할 때마다 빛처럼 빠른 3D 그리드 검색을 실행합니다. RSI 기간(주기), SAR 스텝(가속도) 및 SAR 최대치(속도 제한)를 동시에 스캔하여 플랫폼 지연 없이 수만 개의
PZ 123 Pattern
PZ TRADING SLU
1 (1)
Unlock powerful breakout opportunities The 123 Pattern is one of the most popular, powerful and flexible chart patterns. The pattern is made up of three price points: a bottom, a peak or valley, and a Fibonacci retracement between 38.2% and 71.8%. A pattern is considered valid when the price breaks beyond the last peak or valley, moment at which the indicator plots an arrow, rises an alert, and the trade can be placed. [ Installation Guide | Update Guide | Troubleshooting | FAQ | All Products  ]
Market Makers
Mohamed Hassan
5 (4)
After purchase, contact me privately to receive 1 month of free testing with EA Forex Proton! This advanced MT4 trading robot automatically executes signals from any MT4 indicator, including Market Makers. The latest version also includes AI integration, allowing each trade signal to be analyzed using Artificial Intelligence. Live Signal with EA Forex Proton: Click here Market Makers is a powerful price action trading system designed to identify high-probability Buy and Sell opportunities based
제작자의 제품 더 보기
외환 거래를 한다면, 통화 강도와 통화쌍 상관관계에 대한 상세한 정보를 아는 것은 거래 실력을 한 단계 끌어올리는 데 큰 도움이 됩니다. 상관관계를 분석하면 리스크를 절반으로 줄일 수 있고, 강도 분석을 통해 수익을 극대화할 수 있습니다. 이 지표는 통화 강도 분석과 통화쌍 상관관계를 결합하여 가장 적합한 통화쌍을 선택할 수 있도록 도와주는 하이브리드 접근 방식을 제공합니다. 통화 강도 분석 활용 방법 예를 들어, 당신의 거래 전략이 AUD/JPY 매수 기회를 제공한다고 가정해 봅시다. 하지만 KT 통화 강도 분석을 통해 JPY가 AUD보다 강해지고 있다는 것을 발견했다면, 이 거래는 손실로 끝날 가능성이 높습니다. 이 지표를 사용하면 이러한 손실을 쉽게 피할 수 있습니다. 통화쌍 상관관계 활용 방법 또 다른 예로, 거래 전략이 NZD/USD와 GBP/JPY 두 통화쌍 모두에 대해 매도 기회를 제공한다고 가정해 봅시다. KT 통화쌍 상관관계 분석을 사용하면 이 두 통화쌍 간 상관
ACB Breakout Arrows MT5
KEENBASE SOFTWARE SOLUTIONS
3.5 (2)
ACB Breakout Arrows 지표는 특별한 돌파 패턴을 감지하여 시장에서 중요한 진입 신호를 제공합니다. 이 지표는 차트를 지속적으로 스캔하면서 한 방향으로 움직임이 자리 잡을 때를 포착하여 큰 움직임 직전에 정확한 진입 신호를 제공합니다. 다중 종목 및 다중 시간대 스캐너는 여기에서 확인하세요 - ACB Breakout Arrows MT5용 스캐너 핵심 기능 지표가 자동으로 손절(Stop Loss) 및 익절(Take Profit) 수준을 제공합니다. 모든 시간대의 돌파 신호를 추적하는 MTF 스캐너 대시보드 포함. 데이 트레이더, 스윙 트레이더 및 스캘퍼에게 적합합니다. 신호 정확도를 높이기 위해 최적화된 알고리즘 사용. 손익분기점 또는 빠른 수익 목표를 위한 특별한 라인 (Quick Profit Line) 제공. 승률, 성공 비율, 평균 수익 등의 성과 분석 지표 제공. 재도색 없음. 신호는 고정되어 신뢰할 수 있습니다. 거래 확인 - ACB Trade Filter 지
KT Auto Support Resistance Levels: MetaTrader 4/5용 멀티 타임프레임 S&R, Smart Zones 및 레벨 대시보드 스윙 고점. 피벗. 오더블록. 이전 고점과 저점. 트레이더마다 시장을 표시하는 방식은 조금씩 다르고, 그 대가는 결국 차트가 치르게 됩니다. 한 화면에 너무 많은 방법을 쌓아 올리면 차트는 더 이상 지도가 아닙니다. 그냥 소음이 됩니다. KT Auto Support Resistance Levels 는 이 문제를 해결합니다. 월간, 주간, 일간, 그리고 현재 타임프레임을 동시에 스캔한 뒤, 실제로 중요한 레벨을 MetaTrader 차트 위에 자동으로 그려 줍니다. 차트가 복잡해지면 한 번의 클릭으로 모든 레벨을 깔끔한 Smart Zones로 병합할 수 있습니다. 또한 실시간 패널이 항상 현재 가격 위와 아래의 가장 가까운 레벨을 보여 주기 때문에, 차트에서 계속 찾아다닐 필요가 없습니다. 지치지 않고 계속해서 중요 레벨을 표시해 주
KT Asian Breakout
KEENBASE SOFTWARE SOLUTIONS
4 (1)
KT Asian Breakout carefully analyzes the range-bound market during the Asian session and then fires a long or short trade after doing some preassessment based on its inbuilt technical analysis module. The executed orders are closed within a day before the completion of the next day session. The inbuilt technical analysis module checks for the session range and compares it with the last 20 days price movement. If it finds any erratic price movement within the session, the orders are not executed
KT Momentum Arrows MT5
KEENBASE SOFTWARE SOLUTIONS
5 (2)
KT Momentum Arrows 인디케이터는 순간적인 돌파 신호에 기반한 도구로, 밴드의 이탈 범위와 특정 방향으로 나타나는 변동성을 계산하여 신호를 생성합니다. 이 도구는 가격의 강한 움직임이 시작되는 시점을 빠르게 감지할 수 있도록 설계되었습니다. 가격이 상단 밴드를 상향 돌파하여 마감되면 매수 신호가 생성되며, 하단 밴드를 하향 돌파하여 마감되면 매도 신호가 생성됩니다. 밴드의 이탈과 변동성에 동시에 영향을 주는 '계수' 입력값이 있으며, 이는 거래 종목 및 시간 프레임에 따라 신중하게 분석 및 선택해야 합니다. 주요 특징 재도색 없음! 모멘텀 트레이더를 위한 훌륭한 진입 도구입니다. 승률, 손익비, 평균 수익 등 성과 분석 기능 포함. 단타, 스윙, 스캘핑 모든 스타일에 적합합니다. 입력 파라미터 히스토리 바:  지표 계산에 사용할 바의 수. 모멘텀 계수:  밴드 이탈 및 변동성 측정에 사용하는 계수. 성과 분석:  수익 추세선을 포함한 성과 분석 표시 여부.  알림
KT Auto Fibo MT5
KEENBASE SOFTWARE SOLUTIONS
5 (1)
KT Auto Fibo는 현재 추세 방향에 따라 피보나치 되돌림 레벨을 자동으로 그립니다. 고점과 저점은 차트에 표시된 최대값과 최소값을 사용하여 자동으로 선택됩니다. 사용자는 차트를 확대/축소하거나 스크롤하여 피보나치 레벨을 적절히 조정할 수 있습니다. 모드 자동:  차트 영역을 기반으로 피보나치 레벨을 자동으로 그립니다. 수동: 피보나치 레벨을 한 번만 그리고, 이후에는 앵커 포인트를 수동으로 조정할 수 있습니다. 사용 방법: 미래 수익 목표를 논리적으로 예측하는 데 도움이 됩니다. 지지/저항선이나 추세선과 결합하면 강력한 반전 가능성을 제공합니다. 추세 시장에서 저위험 진입 기회를 제공합니다. 입력 매개변수 자동:  사람의 개입 없이 피보나치 되돌림 레벨을 자동으로 그립니다. 수동:  피보나치 되돌림 레벨을 한 번만 그리고, 이후에는 앵커 포인트를 직접 늘릴 수 있습니다. 미되돌림 영역 표시: 가격 되돌림이 아직 닿지 않은 차트 영역을 표시하거나 숨깁니다. 나머지 입력 항
ACB Trade Filter MT5
KEENBASE SOFTWARE SOLUTIONS
ACB Trade Filter indicator provides a way to filtering out the low probability trading entries in a trading strategy. The indicator uses a sophisticated filtration algorithm based on the market sentiment and trend. The MT4 version of the same indicator is available here ACB Trade Filter MT4 Applications Works great with our indicator ACB Breakout Arrows MT5 Filter out low probability signals from any indicator. Avoid over-trading and minimize the losses. Trade in the direction of market sentime
KT Heiken Ashi Smoothed MT4
KEENBASE SOFTWARE SOLUTIONS
KT Heiken Ashi Smoothed 는 표준 Heiken Ashi 를 한층 더 부드럽게 처리한 버전으로, 추세 전환 시 매수/매도 화살표도 함께 표시합니다. 복잡한 설정 없이 시장의 핵심 변화를 직관적으로 보여주기 때문에 바쁜 트레이더에게 유용합니다. 상태가 약세에서 강세로 전환되면 매수 화살표가 나타납니다. 상태가 강세에서 약세로 전환되면 매도 화살표가 나타납니다. 모바일 알림, 이메일, 소리, 팝업 경고를 모두 지원합니다. Heiken Ashi Smoothed 란? 표준 Heiken Ashi 에 존재하는 잡음과 허위 신호를 제거하기 위해 두 개의 이동 평균으로 가격 데이터를 부드럽게 처리합니다. 약간의 지연은 있지만, 스윙 포인트와 새롭게 형성되는 추세를 명확히 드러내며, 평소 시야에 잘 들어오지 않는 가격 변화를 확인할 수 있습니다. 이를 통해 트레이더는 진입·청산 전략과 리스크 관리를 세밀하게 조정할 수 있습니다. 활용 이 지표는 외환, 원자재, 주식 등 다양한
KT Heiken Ashi Smoothed MT5
KEENBASE SOFTWARE SOLUTIONS
KT Heiken Ashi Smoothed 는 표준 Heiken Ashi 를 한층 더 부드럽게 처리한 버전으로, 추세 전환 시 매수/매도 화살표도 함께 표시합니다. 복잡한 설정 없이 시장의 핵심 변화를 직관적으로 보여주기 때문에 바쁜 트레이더에게 유용합니다. 상태가 약세에서 강세로 전환되면 매수 화살표가 나타납니다. 상태가 강세에서 약세로 전환되면 매도 화살표가 나타납니다. 모바일 알림, 이메일, 소리, 팝업 경고를 모두 지원합니다. Heiken Ashi Smoothed 란? 표준 Heiken Ashi 에 존재하는 잡음과 허위 신호를 제거하기 위해 두 개의 이동 평균으로 가격 데이터를 부드럽게 처리합니다. 약간의 지연은 있지만, 스윙 포인트와 새롭게 형성되는 추세를 명확히 드러내며, 평소 시야에 잘 들어오지 않는 가격 변화를 확인할 수 있습니다. 이를 통해 트레이더는 진입·청산 전략과 리스크 관리를 세밀하게 조정할 수 있습니다. 활용 이 지표는 외환, 원자재, 주식 등 다양한
KT Psar Arrows
KEENBASE SOFTWARE SOLUTIONS
KT Psar Arrows는 표준 파라볼릭 SAR 지표를 사용하여 차트에 화살표를 표시합니다. 캔들의 고가가 SAR에 닿을 때 상승 화살표가 표시되고, 캔들의 저가가 SAR에 닿을 때 하락 화살표가 표시됩니다. 신호는 봉이 마감되기를 기다리지 않고 실시간으로 생성됩니다.  특징 Parabolic SAR 지표를 활용한 거래 전략을 실험하고 싶은 트레이더에게 유용한 도구입니다.  시장 반전 포인트를 찾는 데 사용할 수 있습니다. 사용자 정의 PSAR 입력 지원. MT4의 모든 알림 기능을 지원합니다. 주의사항: Parabolic SAR은 후행성 및 엄격한 기계적 지표입니다. 모든 잠재적 거래는 명확히 정의된 규칙에 따라 필터링해야 합니다.     입력 파라미터 PSAR 스텝: 스텝 값을 입력하세요. PSAR 최대값: 최대값을 입력하세요. PSAR 점 표시: PSAR 점을 표시하거나 숨길 수 있습니다. PSAR 점을 표시하지 않아도 화살표는 정상 작동합니다. 나머지 입력 항목은 직관적
KT Round Numbers MT5
KEENBASE SOFTWARE SOLUTIONS
KT Round Numbers plots the round number levels which are also commonly known as psychological levels in the Forex world. In the context of Forex trading, round number levels are those levels in which there are two or more zeroes at the end. They are named as 00 levels on the chart. Some traders also consider the halfway points as a valid round number level. They are named as 50 levels on the chart. Use of round number levels in trading Round number levels work as strong support and resistance
ACB Breakout Arrows
KEENBASE SOFTWARE SOLUTIONS
4.15 (34)
ACB Breakout Arrows 지표는 특별한 돌파 패턴을 감지하여 시장에서 매우 중요한 진입 신호를 제공합니다. 이 지표는 차트를 지속적으로 스캔하며 한 방향으로 안정적인 모멘텀이 형성되는지를 확인하고, 주요 움직임 직전에 정확한 진입 신호를 제공합니다.  다중 심볼 및 다중 타임프레임 스캐너 받기 – ACB Breakout Arrows MT4용 스캐너 주요 기능 지표가 자동으로 손절(Stop Loss) 및 이익실현(Take Profit) 레벨을 제공합니다. 모든 시간대의 돌파 신호를 추적하는 MTF 스캐너 대시보드가 포함되어 있습니다. 단타 트레이더, 스윙 트레이더, 스캘퍼에게 적합합니다. 정확도를 높이기 위한 최적화된 알고리즘 사용. 손익분기(Breakeven) 또는 단기 목표를 위한 특수 라인(퀵 프로핏 라인) 제공. 승률, 성공률, 평균 수익 등과 같은 성과 분석 지표 제공. 리페인트 없음 – 한번 생성된 신호는 사라지지 않습니다. 거래 확인 -  신뢰도 낮은 신호를
ACB Trade Filter MT4
KEENBASE SOFTWARE SOLUTIONS
5 (1)
The ACB Trade Filter indicator provides a solution for filtering out the low probability trading setups in a trading strategy. The indicator uses a sophisticated filtration algorithm based on the market sentiment and trend. Applications Works great with our indicator " ACB Breakout Arrows ". Filter out low probability signals from any indicator. Avoid overtrading and minimize the losses. Trade in the direction of market sentiment and trend. Avoid the choppiness in the market. How to use Only L
KT Momentum Arrows
KEENBASE SOFTWARE SOLUTIONS
KT Momentum Arrows 인디케이터는 순간적인 돌파 신호에 기반한 도구로, 밴드의 이탈 범위와 특정 방향으로 나타나는 변동성을 계산하여 신호를 생성합니다. 이 도구는 가격의 강한 움직임이 시작되는 시점을 빠르게 감지할 수 있도록 설계되었습니다. 가격이 상단 밴드를 상향 돌파하여 마감되면 매수 신호가 생성되며, 하단 밴드를 하향 돌파하여 마감되면 매도 신호가 생성됩니다. 밴드의 이탈과 변동성에 동시에 영향을 주는 '계수' 입력값이 있으며, 이는 거래 종목 및 시간 프레임에 따라 신중하게 분석 및 선택해야 합니다. 주요 특징 재도색 없음! 모멘텀 트레이더를 위한 훌륭한 진입 도구입니다. 승률, 손익비, 평균 수익 등 성과 분석 기능 포함. 단타, 스윙, 스캘핑 모든 스타일에 적합합니다. 입력 파라미터 히스토리 바:  지표 계산에 사용할 바의 수. 모멘텀 계수:  밴드 이탈 및 변동성 측정에 사용하는 계수. 성과 분석:  수익 추세선을 포함한 성과 분석 표시 여부.  알림
KT COG Advanced MT4
KEENBASE SOFTWARE SOLUTIONS
1 (1)
KT COG is an advanced implementation of the center of gravity indicator presented by John F. Ehlers in the May 2002 edition of Technical Analysis of Stocks & Commodities magazine. It's a leading indicator which can be used to identify the potential reversal points with the minimum lag. The COG oscillator catches the price swings quite effectively. MT5 version of the same indicator is available here KT COG Advanced MT5 Calculation of COG The COG indicator is consist of the two lines. The main l
KT Pin Bar
KEENBASE SOFTWARE SOLUTIONS
KT Pin Bar identifies the pin bar formation which is a type of price action pattern which depicts a sign of reversal or rejection of the trend. When combined with support and resistance, BRN and other significant levels, Pin Bar pattern proved to be a very strong sign of reversal. Basically, a pin bar is characterized by a small body relative to the bar length which is closed either in upper or lower 50% part of its length. They have very large wicks and small candle body. A pin bar candlestic
KT Trend Magic
KEENBASE SOFTWARE SOLUTIONS
KT Trend Magic shows the trend depiction on chart using the combination of market momentum and volatility. A smoothing coefficient is used to smooth out the noise from the signal.It can be used to find out the new entries or confirm the trades produced by other EA/Indicators. Usage Drag n drop MTF scanner which scans for the new signals across multiple time-frames. Find new entries in the trend direction. Improve the accuracy of other indicators when used in conjunction. Can be used as a dynami
KT Auto Fibo
KEENBASE SOFTWARE SOLUTIONS
KT Auto Fibo는 현재 추세 방향에 따라 피보나치 되돌림 레벨을 자동으로 그립니다. 고점과 저점은 차트에 표시된 최대값과 최소값을 사용하여 자동으로 선택됩니다. 사용자는 차트를 확대/축소하거나 스크롤하여 피보나치 레벨을 적절히 조정할 수 있습니다. 모드 자동:  차트 영역을 기반으로 피보나치 레벨을 자동으로 그립니다. 수동: 피보나치 레벨을 한 번만 그리고, 이후에는 앵커 포인트를 수동으로 조정할 수 있습니다. 사용 방법: 미래 수익 목표를 논리적으로 예측하는 데 도움이 됩니다. 지지/저항선이나 추세선과 결합하면 강력한 반전 가능성을 제공합니다. 추세 시장에서 저위험 진입 기회를 제공합니다. 입력 매개변수 자동:  사람의 개입 없이 피보나치 되돌림 레벨을 자동으로 그립니다. 수동:  피보나치 되돌림 레벨을 한 번만 그리고, 이후에는 앵커 포인트를 직접 늘릴 수 있습니다. 미되돌림 영역 표시: 가격 되돌림이 아직 닿지 않은 차트 영역을 표시하거나 숨깁니다. 나머지 입력 항
KT Ichimoku Trader
KEENBASE SOFTWARE SOLUTIONS
1 (1)
KT Ichimoku Trader is a fully automated expert advisor that offers five popular trading strategies based on the Ichimoku indicator. Each strategy has it's own entry and exit method without any interference to other strategies. The Ichimoku system can be applied to all major currency pairs and metals. However, we found that it performs reasonably well mainly on two pairs.   MT5 Version is available here  https://www.mql5.com/en/market/product/35043 Features Trade up to 5 famous trading strategi
KT Volatility Oscillator
KEENBASE SOFTWARE SOLUTIONS
KT 변동성 오실레이터는 과거와 현재의 시장 데이터를 수학적 공식으로 분석하여 오실레이터 형태로 결과를 표시합니다. 증가하는 파동과 감소하는 파동은 각각 자산의 높은 변동성과 낮은 변동성을 나타냅니다.  간단히 말해, 변동성은 일정 기간 동안 자산 가격이 얼마나 변동했는지를 측정하는 지표입니다. 변동성이 없다면 시장의 움직임이 거의 없을 것이고, 트레이더들은 가격 변동을 통해 수익을 얻을 수 없을 것입니다. 외환 시장에서 변동성 활용 외환 시장에서 변동성을 적절히 활용하면 보다 효과적으로 거래할 수 있으며, 기대치를 현실에 맞춰 조정하는 데 도움이 됩니다.  높은 변동성 추세 기반 시스템은 변동성이 높은 시장에서 큰 스윙과 더 긴 포지션 보유 기간 덕분에 매우 잘 작동합니다. 고변동성 구간에서 발생하는 돌파는 더 많은 핍스를 획득할 수 있는 기회를 제공합니다. 낮은 변동성 평균 회귀 시스템은 시장이 평균값으로 되돌아가려는 성질이 있기 때문에 낮은 변동성 환경에서 특히 효과적입니다
KT COG Robot
KEENBASE SOFTWARE SOLUTIONS
KT COG Robot is a fully automated Expert Advisor based on the KT COG Indicator . The COG indicator was originally presented by John F. Ehlers in the May 2002 edition of Technical Analysis of Stocks & Commodities magazine. The EA fires a long trade when COG line cross above the signal line and a short trade is fired when the COG line cross below the signal line.  Adaptive Filtration Our adaptive filtration algorithm combines the original COG formula with the major trend direction and market acce
ACB Breakout Arrows EA
KEENBASE SOFTWARE SOLUTIONS
이 EA는 저희의 커스텀 인디케이터인 "ACB Breakout Arrows" 를 기반으로 한 100% 자동화된 전문가용 어드바이저입니다. 양방향으로 자주 발생하는 돌파 패턴을 이용하며, 외부 입력 값인 "Signal Sensitivity"를 통해 진입 신호의 강도를 조절할 수 있습니다. 거래 확인 ACB Breakout Arrows EA는 또 다른 커스텀 인디케이터인 ACB Trade Filter 를 사용하여 거래 진입 조건을 필터링할 수 있는 기능을 제공합니다. 강력한 매수: 위쪽 화살표 + 초록색 히스토그램 + 상승 추세 강력한 매도: 아래쪽 화살표 + 빨간색 히스토그램 + 하락 추세 히스토그램이 회색이고 추세가 횡보일 경우, EA는 거래를 피합니다. EA는 모든 인디케이터와 의존 파일을 백그라운드에서 로드하며, 차트에는 표시되지 않습니다. 주요 기능 오랜 기대 끝에 이제 ACB Breakout Arrows 인디케이터 로 완전 자동 매매가 가능합니다. ACB Trade F
KT London Breakout
KEENBASE SOFTWARE SOLUTIONS
First thirty minutes are essential for a trading session. The early reaction of traders and market players sets a path for the rest of the day. KT London Breakout EA takes advantage of this phenomenon, and after analyzing the first thirty minutes of London session, it places two bidirectional pending orders. One of pending order is eventually canceled after realizing the market direction with certainty. It has been strictly tested and developed for EUR/JPY using 30-Min Time Frame. You can expe
KT Support and Resistance Levels
KEENBASE SOFTWARE SOLUTIONS
KT Auto Support Resistance Levels: MetaTrader 4/5용 멀티 타임프레임 S&R, Smart Zones 및 레벨 대시보드 스윙 고점. 피벗. 오더블록. 이전 고점과 저점. 트레이더마다 시장을 표시하는 방식은 조금씩 다르고, 그 대가는 결국 차트가 치르게 됩니다. 한 화면에 너무 많은 방법을 쌓아 올리면 차트는 더 이상 지도가 아닙니다. 그냥 소음이 됩니다. KT Auto Support Resistance Levels 는 이 문제를 해결합니다. 월간, 주간, 일간, 그리고 현재 타임프레임을 동시에 스캔한 뒤, 실제로 중요한 레벨을 MetaTrader 차트 위에 자동으로 그려 줍니다. 차트가 복잡해지면 한 번의 클릭으로 모든 레벨을 깔끔한 Smart Zones로 병합할 수 있습니다. 또한 실시간 패널이 항상 현재 가격 위와 아래의 가장 가까운 레벨을 보여 주기 때문에, 차트에서 계속 찾아다닐 필요가 없습니다. 지치지 않고 계속해서 중요 레벨을 표시해 주
MACD Divergence Seeker
KEENBASE SOFTWARE SOLUTIONS
KT MACD Divergence Seeker trades the regular and hidden divergence signals generated by our free indicator named KT MACD Divergence indicator. Trading the standalone divergences can be a risky affair that's why the KT MACD Divergence Seeker combines the standard divergence signals with an advanced analysis module to exploit the price inefficiencies on some FX pairs. What is the Divergence exactly? As a general conception if the price is making higher highs, then macd should also be making hig
KT Asian Breakout Indicator
KEENBASE SOFTWARE SOLUTIONS
KT Asian Breakout 지표는 아시아 세션의 중요한 부분을 분석하여 가격 돌파 방향에 따라 매수 및 매도 신호를 생성합니다. 가격이 세션 최고점을 돌파하면 매수 신호가 발생하며, 가격이 세션 최저점을 돌파하면 매도 신호가 발생합니다. 유의 사항 세션 박스의 높이가 너무 넓다면, 대부분의 가격 움직임이 이미 세션 내에서 발생했기 때문에 새로운 거래를 피하는 것이 좋습니다. 돌파 캔들이 너무 크면, 가격이 신호 방향으로 계속 진행하기 전에 일시적인 되돌림이 발생할 가능성이 높습니다. 기능 매수/매도 신호에 스톱로스 및 목표 이익 수준이 포함됩니다. KT Asian Breakout 지표는 첫 번째, 두 번째 또는 세 번째 목표 이익을 기준으로 성과를 지속적으로 확인합니다. 승/패 신호 수, 성공률, 신호당 평균 핍스와 같은 세 가지 주요 성과 지표를 표시합니다. 돌파 캔들이 너무 크면 차트에 경고 메시지가 표시됩니다. 추천 설정 시간 프레임: 15분. 통화쌍: 모든 JPY
MACD Divergence MT4
KEENBASE SOFTWARE SOLUTIONS
KT MACD 다이버전스는 가격과 오실레이터 사이에 형성되는 일반 다이버전스와 숨겨진 다이버전스를 보여줍니다. 만약 당신의 거래 전략이 추세 반전을 예측한다면, MACD의 일반 다이버전스를 활용하여 잠재적인 전환 지점을 예측할 수 있습니다. 추세 지속을 기반으로 하는 전략이라면 MACD의 숨겨진 다이버전스가 적합합니다. KT MACD 다이버전스의 한계 MACD 다이버전스를 단독 진입 신호로 사용하는 것은 위험할 수 있습니다. 모든 다이버전스가 반전 신호로 해석될 수는 없습니다. 더 나은 결과를 얻으려면 가격 행동 및 기타 분석 기법과 함께 사용하는 것이 좋습니다. 기능 소개 가격과 오실레이터 간의 일반 및 숨겨진 다이버전스를 표시합니다. 비대칭 다이버전스는 정확도를 높이고 혼란을 줄이기 위해 제거됩니다. 추세 반전 및 추세 지속 전략 모두에 사용할 수 있습니다. EA(Expert Advisor)에 완벽하게 통합 가능합니다. 진입뿐만 아니라 청산 시점에도 활용할 수 있습니다. 모든
KT Bollinger Bands Trader MT4
KEENBASE SOFTWARE SOLUTIONS
KT Bollinger Bands Trader는 100% 자동화된 전문가용 어드바이저(EA)로, 낮은 변동성 구간에서 볼린저 밴드를 활용한 평균 회귀 전략을 기반으로 작동합니다. 가격은 종종 볼린저 밴드의 상단 또는 하단 라인에서 반응하지만, 항상 반전이 일어나는 것은 아닙니다. 하지만 낮은 변동성일수록 반전 가능성은 더 높아집니다. 진입 조건 가격이 볼린저 밴드의 하단선 아래에 정확히 위치할 경우 매수 포지션이 실행됩니다. 가격이 볼린저 밴드의 상단선 위에 정확히 위치할 경우 매도 포지션이 실행됩니다. 청산 조건 낮은 변동성 구간이 종료되면 기존 포지션이 자동으로 종료됩니다. 또는 지정된 손절선(Stop Loss)이나 이익 실현선(Take Profit)에 도달하면 종료됩니다. 이 EA는 널리 알려진 볼린저 밴드 전략에 기반하면서도, 트렌드 필터, 변동성 필터, Vortex, MMI, 요일 필터 등 다양한 고급 필터 기능을 내장하여 전략을 세밀하게 조정할 수 있는 유연함을 제공합니
KT CCI Divergence MT4
KEENBASE SOFTWARE SOLUTIONS
KT CCI Divergence shows the regular and hidden divergence created between the price and CCI oscillator. Divergence is one of the vital signals that depicts the upcoming price reversal in the market. Manually spotting the divergence between price and CCI can be a hectic and ambiguous task. Limitations of KT CCI Divergence   Using the CCI divergence as a standalone entry signal can be risky. Every divergence can't be interpreted as a strong reversal signal. For better results, try to combine it w
KT MA Crossover MT4
KEENBASE SOFTWARE SOLUTIONS
KT MA Crossover는 사용자가 선택한 이동 평균선의 교차를 기반으로 매수 및 매도 화살표를 차트에 표시합니다. 또한 각 연속적인 신호에 대해 적절한 알림을 생성하며, MFE(최대 유리 변동값)도 함께 표시하여 트레이더가 가능한 최대 이익 범위를 파악할 수 있도록 도와줍니다. 이동 평균 교차 전략은 전 세계 트레이더들이 가장 많이 사용하는 기본적인 거래 전략 중 하나입니다. 일반적으로 빠른 이동 평균선과 느린 이동 평균선을 조합하여 교차 방향에 따라 매수 또는 매도 진입 신호를 식별합니다. 매수 신호 – 빠른 MA가 느린 MA를 상향 돌파할 때. 매도 신호 – 빠른 MA가 느린 MA를 하향 돌파할 때. 기능 각 이동 평균의 속성을 자유롭게 설정할 수 있습니다. 각 신호에 대해 MFE 값을 제공합니다. 가볍고 효율적으로 작동하는 인디케이터로 시스템 리소스 사용이 적습니다. MetaTrader의 모든 경고 기능이 포함되어 있습니다. 단점  이동 평균은 과거 데이터를 기반으로
필터:
리뷰 없음
리뷰 답변