Divergence for Many Indicators MT4
- 지표
-
Evgeniy Zhdan
 ➖➖➖➖➖➖➖➖➖➖➖➖➖➖➖➖➖➖➖➖➖➖
Products: https://www.mql5.com/en/users/trendhunter/seller
➖➖➖➖➖➖➖➖➖➖➖➖➖➖➖➖➖➖➖➖➖➖ - 버전: 2.0
- 업데이트됨: 23 4월 2024
- 활성화: 5
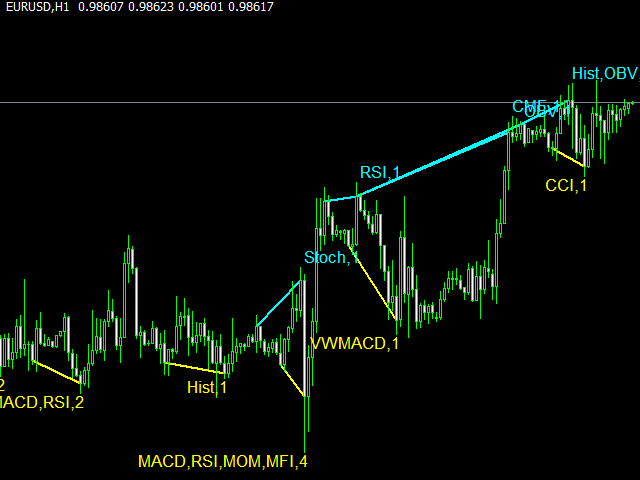
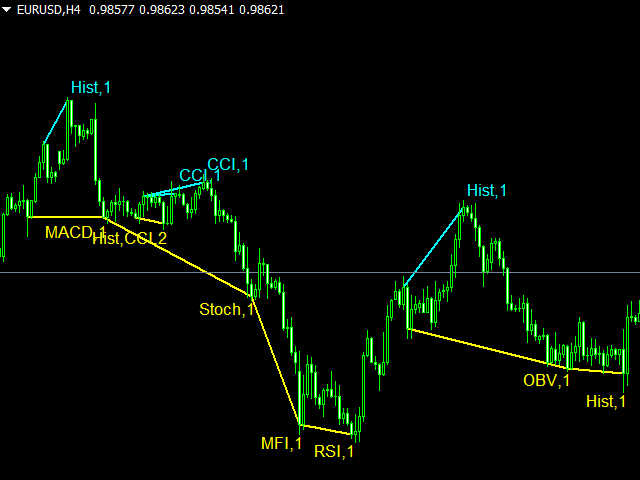
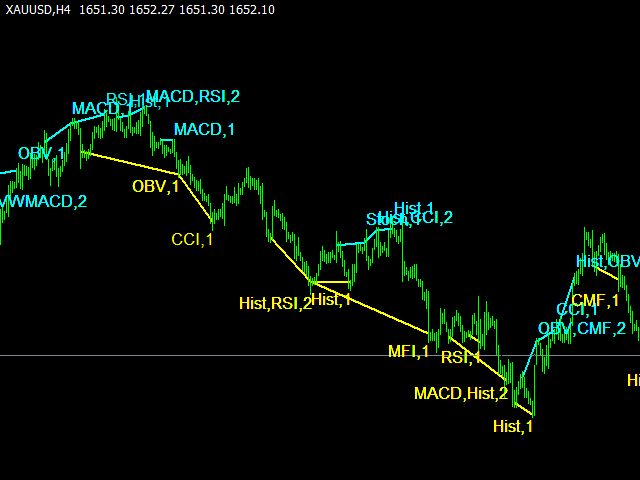
Divergence indicator 10 different indicators. Finding and displaying classic and hidden divergences.
Indicators in which divergences are searched:
- MACD
- MACD Histogram;
- RSI;
- Stochastic;
- CCI;
- momentum;
- OBV;
- VWmacd;
- Chaikin Money Flow;
- Money Flow Index.
This is a replica of the indicator from the tradingview resource, adapted for the MT4 terminal.
MT5 version available here: https://www.mql5.com/en/market/product/87879
Settings:
- Bars in history for analysis - number of bars for analysis;
- Divergence Type - divergence type;
- Show Indicator Names - display mode of the indicator name on the chart;
- Show Divergence Number - show the number of divergences on one candle;
- Show Only Last Divergence - show only the last divergence;
- Show Divergence Lines - display of lines;
- MACD yes/no - MACD indicator divergence;
- MACD Histogram yes/no - divergence according to the histogram of the MACD indicator;
- RSI yes/no - divergence of the RSI indicator;
- Stochastic yes/no - RSI indicator divergence;
- CCI yes/no - divergence of the CCI indicator;
- Momentum yes/no - divergence of the Momentum indicator;
- OBV yes/no - OBV indicator divergence;
- VWmacd yes/no - divergence of the Volume weighted MACD indicator;
- Chaikin Money Flow yes/no - divergence of the Chaikin Money Flow indicator;
- Money Flow Index yes/no - divergence of the Money Flow Index indicator;
- Positive Regular Divergence - Color for displaying classic upward divergence;
- Negative Regular Divergence - Color for displaying the classic downward divergence;
- Positive Hidden Divergence - Display color for hidden upward divergence;
- Negative Hidden Divergence - Display color for hidden downward divergence;
- Regular Divergence Line Style - style of classic divergence lines;
- Hidden Divergence Line Style - style of hidden divergence lines;
- Regular Divergence Line Width - thickness of classical divergence lines;
- Hidden Divergence Line Width - Hidden Divergence Line Style.
Very good indicator. It fully reflects the tradingview version used in the various strategies. Excellent support from the developer.