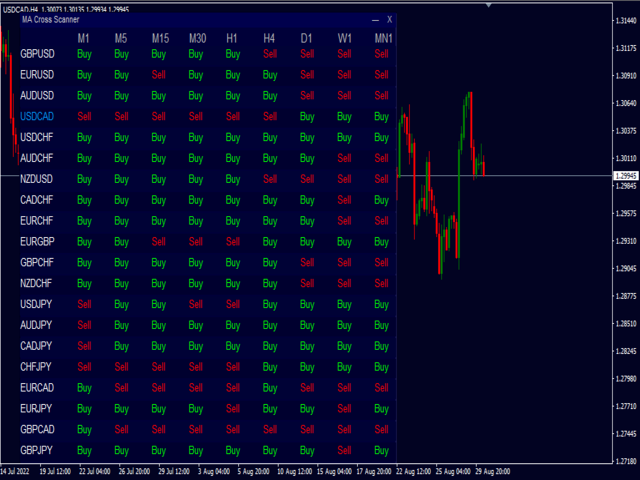
Moving Average Crossing Scanner

4.33
This indicator scans the Moving Average values for 2 Moving Averages on multiple pairs and multiple timeframes in realtime and displays a Buy signal when the fast MA is above the slow MA and a Sell signal when the fast MA is below the slow MA. 

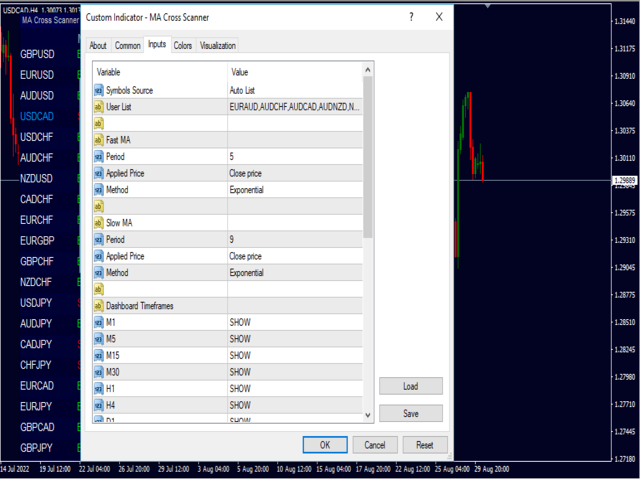
-All the MA parameters(Period, Method and Applied price) can be changed from the inputs window.

-You can either add your own list of pairs to scan or set the scanner to automatically use the pairs in the market watch using the Symbols Source input.

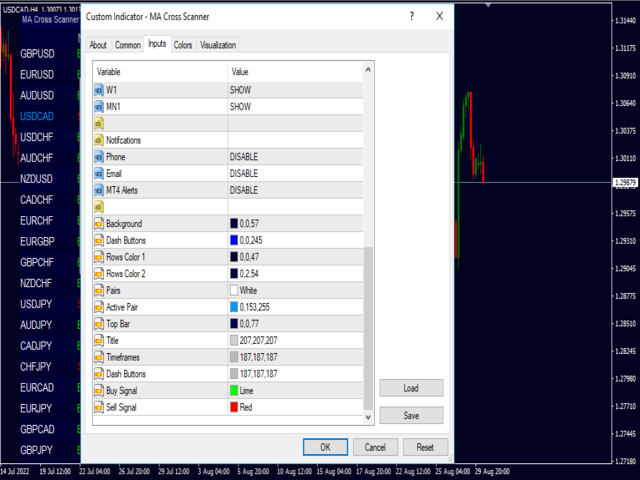
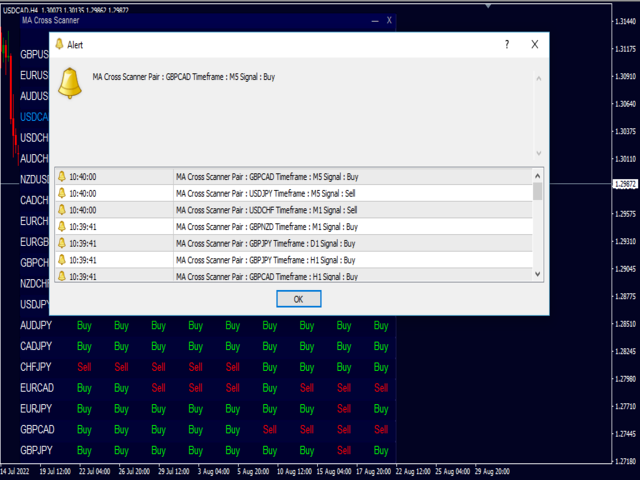
-The scanner can send MT4 Alerts/Email/Phone Notifications when the Moving Average lines cross.

-The dashboard rows have alternating colors to enhance visibility

-The current pair is marked with a different color

-All the dashboard colors can be adjusted in the indicator inputs window.

-To move the dashboard, left click on the top bar(containing the dashboard name), drag the dashboard and once it's in the desired position, release your mouse click.

-You can open a pair on the current chart by clicking on it(Pair name on the first column)
리뷰 5
Abraham Correa
4594
Abraham Correa 2024.06.23 04:58 
 

Advanced coding doesn't seem to be unsatisfying. The rating is self explanatory!

Xavipas
187
Xavipas 2023.04.03 17:51 
 

Sencillo y eficaz. Para mi se ha convertido en un indispensable en el comercio forex. Gracias!!!

추천 제품
GTAS STrend
Riviera Systems
4.5 (2)
GTAS S-Trend is a momentum indicator that helps to determine trends using combination of MACD, RSI and moving averages. This indicator was created by Bernard Prats Desclaux, proprietary trader and ex-hedge fund manager, founder of E-Winvest. Description The indicator oscillates between -65 and +65 with a neutral zone between -25 and +25 around a 0 equilibrium line. S-Trend between -25 and +25 indicates congestion zones with a bullish bias between 0 and +25, and a bearish bias between 0 and -25.
FREE
The Crossing
Anton Iudakov
5 (2)
+ 2 bonus strategies! Alerts! I recommend watching my advisor -   Night Zen EA The indicator combines the most popular moving average strategies: Simple moving average crossover. Moving average crossover relative to the position of the slower moving average. 2 bonus strategies : The crossing of the fast moving average with the calculation of the opening prices of the slow moving average with the calculation of the closing prices taking into account the slower moving average. (The settings for th
FREE
Email Drawdown Alert
Roman Starostin
5 (12)
Free informative Indicator-helper. It'll be usefull for traders who trade many symbols or using grid systems (Averaging or Martingale). Indicator counts drawdown as percent and currency separate. It has a number of settings: Count deposite drawdown according equity value and send e-mail or notifications to user if DD more than set; Sending e-mail when max open orders reached; Shows price and remaining pips amount before MarginCall on current chart and Account generally; Display summary trade lot
FREE
Free automatic fibonacci
Tonny Obare
4.67 (49)
Free automatic Fibonacci is an indicator that automatically plots a Fibonacci retracement based on the number of bars you select on the BarsToScan setting in the indicator. The Fibonacci is automatically updated in real time as new highest and lowest values appears amongst the selected bars. You can select which level values to be displayed in the indicator settings. You can also select the color of the levels thus enabling the trader to be able to attach the indicator several times with differe
FREE
RSI Arrows MTF
Yuriy Shatsckiy
The RSI Arrows MTF indicator is based on the RSI indicator. Represents input signals in the form of arrows. It has 6 types of calculation. All signals are generated on the current bar of the selected period. Signals do not redraw in the first 4 modes! But it is possible to redraw in cases of a sharp change in market movement.  All signals in MTF mode correspond to signals of the period specified in MTF. It is maximally simplified to use both for trading with only one indicator and for using t
FREE
Smart RSI MT4
Mostafa Saad Saeed Shawara
제품 제목 Smart RSI (MT4) – SmartView 시리즈의 일부 간단한 설명 MetaTrader 플랫폼에서 독특한 사용자 경험을 제공하는 RSI 지표입니다. 이전에 사용할 수 없었던 고급 기능을 제공하며, 더블 클릭으로 설정 열기, 삭제하지 않고 지표 숨기기/표시하기, 지표 창을 전체 차트 크기로 표시하기 등의 기능을 포함합니다. SmartView Indicators 시리즈의 나머지 부분과 원활하게 작동하도록 설계되었습니다. 개요 SmartView 시리즈는 혁신적인 기능을 통해 MetaTrader 플랫폼의 지표에 독특하고 독특한 사용자 경험을 제공하여 지표 관리를 더 빠르고 쉽게 만듭니다. 각 지표는 차트에 스마트 제어 패널이 장착되어 있어 필수 정보를 표시하고 모든 중요한 기능에 빠르게 액세스할 수 있습니다. 이전에 사용할 수 없었던 고유한 기능 SmartView 시리즈는 지표 작업을 더 쉽고 빠르게 만드는 고급 기능을 제공합니다: 더블 클릭으로 설정 열기: 지표 목록을
FREE
The Scaled Awesome Oscillator (SAO) represents a refined adaptation of the Awesome Oscillator, aimed at establishing consistent benchmarks for identifying market edges. Unlike the standard Awesome Oscillator, which records the variation in pips across different commodities, the only unchanging reference point is the zero line. This limitation hampers investors and traders from pinpointing specific levels for trend reversals or continuations using the traditional Awesome Indicator, a creation of
FREE
FTU idioteg i jipyoneun MT4 peullaespom-yong-imyeo dandog-eulo sayonghal su issjiman daleun jipyo ttoneun jeonlyaggwa gyeolhabhaneun geos-i gajang johseubnida. macd, adx deung dayanghan jipyoleul gyeolhabhayeo jin-ib ttoneun chuse byeonhwa jean-eul wihan hwasalpyo geuligi YouTubeeseo jjalb-eun sogae bidioleul sicheonghaseyo: https://youtu.be/lCRJ3mFNyOQ pyosigi gineung: panmae mich gumae hwasalpyo sigag mich cheong-gag gyeong-go chuse jisog / chogi chuse byeonhwa sinho saeloun gineung: gilog ma
FREE
Donchian Trend Histogram
Mariusz Piotr Rodacki
Donchian channels are a tool in technical analysis used to determine the relative volatility of a market and the potential for price breakouts. Can help identify potential breakouts and reversals in price, which are the moments when traders are called on to make strategic decisions. These strategies can help you capitalize on price trends while having pre-defined entry and exit points to secure gains or limit losses. Using the Donchian channel can thus be part of a disciplined approach to managi
FREE
Crossover MA Histogram
Mariusz Piotr Rodacki
The Cossover MA Histogram indicator is a simple tool showing the trend based on crossover of moving averages. Simply specify two mobving averages and addicional parameters like MA method and Applied price. When fast MA is above slow MA the histogram is green, indicating an uptrend. When MA fast is below MA slow the histogram is red, indicating an downtrend.
FREE
무한대에서 통화의 강도를 측정하는이 혁신적인 지표는 오랫동안 거래하는 암표 및 거래자에게 없어서는 안될 조수입니다. 통화의 강도/약점을 분석하는 시스템은 오랫동안 알려져 있으며 세계 최고의 거래자들에 의해 시장에서 사용되었습니다. 이 분석 없이는 차익 거래가 완료되지 않습니다. 우리의 지표는 서로 관련하여 기본 통화의 강도를 쉽게 결정합니다. 표시 라인에 차트에 대한 모든 또는 현재 통화 쌍의 수 있도록 즉각적인 분석 및 검색에 대한 강한 진입 점. 표시등,직관적 인 사용하면 신속하게 찾아와 스위치는 모든 쌍,모바일 패널 배치할 수 있는 모두에서 지하실에는 기본 차트. 통화의 강도의 변화의 통지의 타이머 모드는 상인에게 전화로 알림을받을 수있는 기회를 제공합니다.  통화 전력계 무한대 표시기를 사용하기위한 몇 가지 전략: 1. 신흥 추세에 대한 신호로 교차점을 검색 할 통화의 강도의 선형 표시의 차트를 사용하여 2. 추세 반전 신호가 나타난 후 강한 통화 방향으로 두피 3.
FREE
This indicator calculates average speed of moving average indicator. Here is parameters: BarsToProcess - indicator calculating period; MaPeriod - period of Moving Average indicator; AveragingPeriod - period (MA values) of the basis of which the average value is calculated; MA_Method, MA_Apply_to - using to set MA indicator parameters; Thats all! Good luck.
FREE
Double HMA lines MTF
Pavel Zamoshnikov
5 (1)
This is a multi-timeframe version of the popular Hull Moving Average (HMA). The Double HMA MTF Light indicator combines two timeframes on a single chart. The HMA of the higher timeframe defines the trend, and the HMA of the current timeframe defines short-term price movements. The indicator is freely distributed and hasn't audio signals or messages. Its main function is the visualization of price movements. If you need advanced functionality of the HMA multi-timeframe indicator (information ab
FREE
User friendly indicator.  This indicator will help you catch the trend an fast as possible. Indicator developed based on moving averages. User can select which type of moving averages they want to use. Indicator draws an arrow when the moving average crosses. The moving average cross over arrow can be filtered with RSI, OsMA, and Parabolic Sar. There are options for selecting specific criteria for the filters.  Such as period of Rsi and Rsi levels. OsMA and Parabolic Sar criteria can also be sel
Zig Zag Repainting Tracker
Sunderalingam A/l Vellasamy
This indicator highlights the exact points on the chart where the built-in ZigZag indicator repainted its peaks or troughs. Grey-colored arrows are plotted to show where a previously confirmed high or low was later shifted — a behavior known as repainting . Why it’s important: Repainting can mislead traders by altering historical signals, giving a false impression of past accuracy. This tool helps traders visually track and understand when and where ZigZag repaints , improving strategy evaluati
FREE
Tipu Heikin Ashi Panel
Kaleem Haider
4.56 (18)
Tipu Heikin-Ashi Panel is the modified version of the original Heiken Ashi indicator published by MetaQuotes here . A professional version of this indicator is available here . Features An easy to use Panel that shows the Heiken Ashi trend of selected timeframe. Customizable Buy/Sell alerts, push alerts, email alerts, or visual on-screen alerts. Customizable Panel. The panel can be moved to any place on the chart or minimized to allow more space. Heikin means "the average", and Ashi means "foot
FREE
This is simple indicator for displaying Multi Moving Average line in chart, with one single Indicator. Just place the indicator in your chart, select how many MAs you want to display.  And you are ready to go. Parameters can be changed on the fly by the control panel provided by the Indicator. This indicator are still in development, if you have any further feature request, please let me know in the comment.
FREE
Traditional MACD MT4
Daniel Lewis
4.58 (55)
MACD indicator in MetaTrader 4/5 looks different than MACD does in most other charting software. That is because the MetaTrader 4/5 version of MACD displays the MACD line as a histogram when it is traditionally displayed as a line. Additionally, the MetaTrader 4/5 version computes the Signal line using an SMA, while according to MACD definition it is supposed to be an EMA. The MetaTrader 4/5 version also does not compute a true MACD Histogram (the difference between the MACD/Signal lines). This
FREE
This indicator is based on Guppy's GMMA Strategy. And shows arrows when GMMA lines cross up or down. To have this indicator and get alerts for Multiple Timeframes and multiple Pairs you can check out the demo of this GMMA Trend Scanner indicator: https://www.mql5.com/en/market/product/38747 About GMMA In Brief: GMMA attempts to identify trends by combining two groups of moving averages with differing time periods: The long-term EMAs (30, 35, 40, 45, 50, and 60) the behaviors of investors that h
FREE
Follow The Line
Oliver Gideon Amofa Appiah
3.94 (16)
FOLLOW THE LINE GET THE FULL VERSION HERE: https://www.mql5.com/en/market/product/36024 This indicator obeys the popular maxim that: "THE TREND IS YOUR FRIEND" It paints a GREEN line for BUY and also paints a RED line for SELL.  It gives alarms and alerts of all kinds. IT DOES NOT REPAINT and can be used for all currency pairs and timeframes. Yes, as easy and simple as that. Even a newbie can use it to make great and reliable trades. NB: For best results, get my other premium indicators for more
FREE
MACD Jurik
Augustine Kamatu
Introducing MACD Jurik—an advanced indicator designed to enhance your forex trading strategy by integrating custom moving averages based on the Moving Average Convergence Divergence (MACD) with the MetaTrader 4 indicator, MACD. Jurik moving averages are renowned for their accuracy and reliability in analyzing price movements in the forex market. They offer traders smoother representations of price action, reducing noise and providing clearer signals for identifying trends and potential reversa
FREE
MTF Heiken Ashi MA is a multiple timeframe Heiken Ashi & Moving Average indicator. Fully customizable for advanced & unique Heiken Ashi & Moving Average calculations. Key Features Modified appearance and appeal from the traditional using only H eiken Ashi MA bodies. MTF Higher or lower timeframes available making this it great for trends and scalping. There are many settings that can be non-repaint for signals at a new bar and at bar 0. Inputs Timeframe  = PERIOD_CURRENT - timeframe of Moving
FREE
SMA Indicator
Nitu Brijesh Yadav
Arrow Indicator (Buy/Sell Alerts) – Simple Yet Powerful Tool!             Product Version: 1.01           Indicator Type: Trend Reversal Signals           Timeframes Supported: All (Recommended: H1, H4, D1)           Key Features: Buy Signal: Green upward arrow () appears below the candle  Sell Signal : Red downward arrow () appears above the candle Accurate Trend Reversal Detection – Based on tried and tested SMA strategy. ️ Clean Chart View – Minimalist, non-i
FREE
High Low Open Close MT4
Alexandre Borela
4.81 (21)
이 프로젝트를 좋아한다면 5 스타 리뷰를 남겨주세요. 이 지표는 열리고, 높은, 낮은 및 마감 가격을 지정합니다. 기간과 그것은 특정한 시간대를 위해 조정될 수 있습니다. 이들은 많은 기관 및 전문가에 의해 보는 중요한 수준입니다 상인은 당신이 더 많은 것일 수있는 장소를 알고 도움이 될 수 있습니다 이름 * 사용 가능한 기간: 이전 날. 이전 주. 지난 달. 이전 분기. 이전 연도. 또는: 현재 날. 현재 주. 현재 달. 현재 분기. 현재 년.
FREE
Coloured Bollinger Bands
Moegamat Luqmaan Titus
Coloured Bollinger Bands The Coloured Bollinger Bands indicator is an enhanced version of the standard Bollinger Bands, offering customizable features to suit your trading needs. It uses the classic Simple Moving Average (SMA) as the middle band, and allows you to easily change the appearance of the bands, including the option to select colors and line types, ensuring better visual clarity and adaptability on your charts
FREE
StrikePin
Mike Pascal Plavonil
1 (1)
The StrikePin indicator is a technical, analytical tool designed to identify trend reversals and find optimal market entries.  The StrikePin indicator is based on the pin bar pattern, which is the Price Action reversal pattern. An entry signal, in a trending market, can offer a very high-probability entry and a good risk to reward scenario. Be careful: the indicator is repainting since it is looking for highest high and lowest lows.  You should avoid to use it in experts but you can use it in
FREE
Trendline indicator
David Muriithi
2 (1)
Are you tired of drawing trendlines every time you're analyzing charts? Or perhaps you would like more consistency in your technical analysis. Then this is for you. This indicator will draw trend lines automatically when dropped on a chart. How it works Works similar to standard deviation channel found on mt4 and mt5. It has 2 parameters: 1. Starting Bar 2. Number of bars for calculation The   starting bar   is the bar which drawing of the trend lines will begin, while the   number of bars for c
FREE
OsMA Arrow MTF
Pavel Shutovskiy
3.9 (10)
The indicator displays crossing zero level by Moving Average of Oscillator (OsMA) in the form of arrows. The this is a multi-timeframe indicator, and it displays signals from other timeframes. The indicator notifies about a signal by means of a pop-up Alert window, or sending notification to e-mail. Parameters Time-frame - select timeframe to show indicator signals. Fast EMA Period - fast EMA. This is an exponential moving average from a price with a short period. Slow EMA Period - slow EMA. Th
FREE
Extremum by trend
Anton Iudakov
5 (2)
Looking for entry points along the local trend without repaint! Arrows indicate entry points. Based on classic indicators. The indicator is easy to use. Settings Наименование Описание Frequency factor Signal frequency. The less, the more often. This affects the quality. Recommendations Recommended for use on major currency pairs. Timeframe from m5, m15, m30 Subscribe to my telegram channel, where we discuss intraday trading, ideas, indicators, etc., a link in my profile contacts.
FREE
RelicusRoad MACD v2
Relicus LLC
4.6 (5)
이동 평균 수렴 발산(MACD) 거래 전략은 추세와 흐름 방향의 변화를 식별하는 데 사용되는 인기 있는 기술 분석 도구입니다. MACD는 12기간의 지수 이동 평균(EMA)에서 26기간의 EMA를 빼서 계산됩니다. "신호 선"이라고 불리는 9기간의 EMA는 MACD 위에 표시되어 매수 및 매도 신호를 트리거로 작용합니다. MACD 선이 신호 선 위에 있으면 매수 트렌드로 간주되고, 신호 선 아래에 있으면 매도 트렌드로 간주됩니다. 거래자들은 종종 이 정보를 사용하여 잠재적인 매수 및 매도 기회를 파악합니다. MACD는 다양한 방식으로 사용될 수 있는 다재다능한 지표입니다. 일반적으로 사용되는 몇 가지 방법은 다음과 같습니다. 교차: MACD 선이 신호 선 위로 크로스되면 매수 교차가 발생하고, MACD 선이 신호 선 아래로 크로스되면 매도 교차가 발생합니다. 발산: MACD가 새로운 고점을 형성하면서 기초 자산이 그렇지 않은 경우 매수 발산이 발생하고, MACD가 새로운 저점을 형성
FREE
이 제품의 구매자들이 또한 구매함
Gann Made Easy
Oleg Rodin
4.83 (161)
Gann Made Easy 는 mr.의 이론을 사용하여 최고의 거래 원칙을 기반으로 하는 전문적이고 사용하기 쉬운 Forex 거래 시스템입니다. W.D. 간. 이 표시기는 Stop Loss 및 Take Profit Levels를 포함하여 정확한 BUY 및 SELL 신호를 제공합니다. PUSH 알림을 사용하여 이동 중에도 거래할 수 있습니다. 구매 후 거래 방법 안내 및 유용한 추가 지표를 무료로 받으시려면 저에게 연락주세요! 아마도 Gann 거래 방법에 대해 이미 여러 번 들었을 것입니다. 일반적으로 Gann의 이론은 초보자 거래자뿐만 아니라 이미 거래 경험이 있는 사람들에게도 매우 복잡한 것입니다. Gann의 거래 방식은 이론적으로 적용하기 쉽지 않기 때문입니다. 나는 그 지식을 연마하고 Forex 지표에 최고의 원칙을 적용하기 위해 몇 년을 보냈습니다. 표시기는 적용하기가 매우 쉽습니다. 차트에 첨부하고 간단한 거래 권장 사항을 따르기만 하면 됩니다. 지표는 지속적으로 시장 분석
Ultimate Sniper Dashboard
Hispraise Chinedum Abraham
4.82 (22)
299달러로 할인! 추후 가격이 인상될 수 있습니다! 아래 설명을 읽어보세요! Ultimate Sniper Dashboard를 위한 최고의 엔트리 시스템: ULTIMATE DYNAMIC LEVELS. (내 제품을 확인하십시오) Ultimate Sniper Dashboard는 MT4 다중 통화 테스트 제한으로 인해 라이브 시장에서만 작동합니다. Ultimate-Sniper 대시보드를 소개합니다! HA-Sniper와 MA-Sniper를 모두 포함하는 최고의 제품입니다. 그리고 많은 특수 모드. Ultimate Sniper Dashboard는 절대 야수입니다! 초보자 또는 전문가 트레이더를 위한 최고의 솔루션! 다시 움직임을 놓치지 마세요! 단순함과 핍을 좋아하는 트레이더를 위해 특별한 제품을 준비했습니다. 본질적으로 단순한 대시보드는 여러 사용자 지정 알고리즘을 기반으로 28개의 통화 쌍을 살펴보는 모든 작업을 수행합니다. 단 하나의 차트로 전문가처럼 시장을 읽을 수 있습니다. 움직이기
M1 Sniper
Oleg Rodin
5 (21)
M1 SNIPER 는 사용하기 쉬운 거래 지표 시스템입니다. M1 시간대에 맞춰 설계된 화살표 지표입니다. 이 지표는 M1 시간대 스캘핑을 위한 단독 시스템으로 사용할 수 있으며, 기존 거래 시스템의 일부로도 사용할 수 있습니다. 이 거래 시스템은 M1 시간대 거래용으로 특별히 설계되었지만, 다른 시간대에도 사용할 수 있습니다. 원래는 XAUUSD와 BTCUSD 거래를 위해 이 방법을 설계했지만, 다른 시장 거래에도 유용하다는 것을 알게 되었습니다. 이 지표의 신호는 추세 방향과 반대로 거래될 수 있습니다. 저는 지표의 신호를 활용하여 양방향으로 거래할 수 있도록 돕는 특별한 거래 기법을 알려드립니다. 이 방법은 특별한 동적 지지선과 저항선 가격 영역을 활용하는 것을 기반으로 합니다. 구매하시면 M1 SNIPER 화살표 지표를 바로 다운로드하실 수 있습니다. 또한, 아래 스크린샷에 표시된 Apollo Dynamic SR 지표는 M1 SNIPER 도구를 사용하는 모든 사용자에게 무료로
Scalper Inside PRO
Alexey Minkov
4.74 (69)
Scalper Inside PRO – Since 2020. An exclusive indicator that utilizes an innovative algorithm to swiftly and accurately determine the market trend. The indicator automatically calculates opening, closing, and profit levels, providing detailed trading statistics. With these features, you can choose the most appropriate trading instrument for the current market conditions. Additionally, you can easily integrate your own arrow indicators into Scalper Inside Pro to quickly evaluate their statistics
Market Makers
Mohamed Hassan
5 (3)
After purchase, contact me privately to receive 1 month of free testing with EA Forex Proton! This advanced MT4 trading robot automatically executes signals from any MT4 indicator, including Market Makers. The latest version also includes AI integration, allowing each trade signal to be analyzed using Artificial Intelligence. Live Signal with EA Forex Proton: Click here Market Makers is a powerful price action trading system designed to identify high-probability Buy and Sell opportunities based
Smart Price Action Concepts
Issam Kassas
4.77 (13)
우선적으로, 이 거래 도구는 전문적인 거래에 이상적인 비-다시 그리기 및 지연되지 않는 지표입니다.  온라인 강좌, 사용자 매뉴얼 및 데모. 스마트 가격 액션 컨셉트 인디케이터는 신규 및 경험 많은 트레이더 모두에게 매우 강력한 도구입니다. Inner Circle Trader Analysis 및 Smart Money Concepts Trading Strategies와 같은 고급 거래 아이디어를 결합하여 20가지 이상의 유용한 지표를 하나로 결합합니다. 이 인디케이터는 스마트 머니 컨셉트에 중점을 두어 대형 기관의 거래 방식을 제공하고 이동을 예측하는 데 도움을 줍니다.  특히 유동성 분석에 뛰어나 기관이 어떻게 거래하는지 이해하는 데 도움을 줍니다. 시장 트렌드를 예측하고 가격 변동을 신중하게 분석하는 데 탁월합니다. 귀하의 거래를 기관 전략에 맞추어 시장의 동향에 대해 더 정확한 예측을 할 수 있습니다. 이 인디케이터는 시장 구조를 분석하고 중요한 주문 블록을 식별하고 다양한
Dynamic Scalper System
Vitalyi Belyh
5 (1)
" Dynamic Scalper System " 지표는 추세 파동 내에서 스캘핑 방식으로 거래하도록 설계되었습니다. 주요 통화쌍 및 금에서 테스트되었으며, 다른 거래 상품과의 호환성이 가능합니다. 추가적인 가격 변동 지원을 통해 추세에 따라 단기 포지션 진입 신호를 제공합니다. 지표의 원리 큰 화살표는 추세 방향을 결정합니다. 작은 화살표 형태의 스캘핑 신호를 생성하는 알고리즘은 추세 파동 내에서 작동합니다. 빨간색 화살표는 상승 방향을, 파란색 화살표는 하락 방향을 나타냅니다. 민감한 가격 변동선은 추세 방향으로 그려지며, 작은 화살표의 신호와 함께 작용합니다. 신호는 다음과 같이 작동합니다. 적절한 시점에 선이 나타나면 진입 신호가 형성되고, 선이 있는 동안 미결제 포지션을 유지하며, 완료되면 거래를 종료합니다. 권장되는 작업 시간대는 M1~H4입니다. 화살표는 현재 캔들에 형성되며, 다음 캔들이 이미 시작되었더라도 이전 캔들의 화살표는 다시 그려지지 않습니다. 입력 매개
Ultimate Dynamic Levels
Hispraise Chinedum Abraham
4.7 (10)
現在、ホリデーディスカウントで399ドル! 今後値上がりする可能性があります。以下の説明をお読みください。 Ultimate Dynamic Levelsの紹介 - Ultimate Sniper DashboardのBESTエントリーインジケーター! 極めてローリスクなタイムリーエントリーと高RR!!! アルティメットスナイパーダッシュボードはこちら。 初心者はもちろん、プロのトレーダーにとっても最も重要な能力は、いつどこで相場が転換するかを正確に判断し、いかに安全に参入し、利益を得て退場するかを見極めることです。 アルティメット・ダイナミック・レベルズ・インディケーターは、相場が転換する可能性が最も高い場所を簡単に教えてくれるので、極めてローリスクなトレードを自信を持って行うことができ、同時にチャートをクリーンでシンプルに保ちながら、$$$を稼ぐことができるのです! アルティメット・ダイナミック・レベルズ・インディケーターは、複数の時間枠で重要な隠れたレベルを一度に見つけるユニークで強力なアルゴリズムを持っています。また、他の典型的なSRインジケーターのように、レベルを再描
Route Lines Prices - 은 가격 방향을 찾는 데 사용되는 지표입니다. 간단한 인터페이스에는 가격 움직임 및 미래 방향 계산을 위한 다양한 알고리즘이 포함되어 있습니다. 이러한 알고리즘에는 사용된 시간대에 따른 변동성 계산 및 가격 평활화 기능이 있습니다. 이 지표는 " Calculating price values " 값을 변경하는 단일 매개변수를 제공합니다. 기본값인 1은 균형 잡힌 자동 계산을 제공하며, 별도의 설정 없이 바로 사용할 수 있습니다. 2에서 500 사이의 값을 수동으로 변경하여 자신만의 거래 시스템에 맞게 지표를 맞춤 설정할 수 있습니다. 이 지표는 M1부터 H4까지의 시간대에서 사용을 권장합니다. 모든 거래 상품에 적용 가능합니다. 신호 화살표는 캔들 종가에 생성되며, 과거 차트에는 다시 그려지지 않습니다. 메인 차트에 동일한 화살표가 표시됩니다. 다양한 유형의 알림을 사용할 수 있으며, 내장된 라인 궤적 카운터는 종가를 기반으로 작동합니다. 이는
ON Trade Waves Patterns Harmonic Elliot Wolfe를 소개합니다. 이는 수동 및 자동 방법을 사용하여 다양한 시장 패턴을 감지하기 위해 개발된 고급 지표입니다. 다음은 그 작동 방식입니다: 조화적 패턴: 이 지표는 차트에 나타나는 조화적 패턴을 식별할 수 있습니다. 이러한 패턴은 Scott Carney의 "Harmonic Trading vol 1 및 2"에서 설명한 것처럼 조화적 거래 이론을 연습하는 트레이더에게 중요합니다. 수동으로 그리든 자동 감지를 사용하든 ON Trade Waves Patterns가 도움을 줄 것입니다. 컨트롤 패널: 이 지표에는 사용자 친화적인 컨트롤 패널이 있습니다. 차트 및 시간 프레임 설정을 저장하여 다양한 구성 간에 쉽게 전환할 수 있습니다. 차트 공간을 최대화하려면 최소화할 수도 있습니다. 다른 분석 도구를 사용하는 것을 선호하는 경우 닫기 버튼을 클릭하여 모든 지표 데이터를 숨길 수 있습니다. 템플릿 저장: 설정을 사
Currency Strength Exotics
Bernhard Schweigert
4.88 (33)
현재 20% 할인! 초보자 또는 전문가 트레이더를 위한 최고의 솔루션! 이 표시기는 Exotic Pairs Commodities, Indexes 또는 Futures와 같은 기호에 대한 통화 강도를 표시하는 데 특화되어 있습니다. 금, 은, 석유, DAX, US30, MXN, TRY, CNH 등의 진정한 통화 강도를 보여주기 위해 9번째 줄에 모든 기호를 추가할 수 있습니다. 이것은 독특하고 고품질이며 저렴한 거래 도구입니다. 우리는 많은 독점 기능과 새로운 공식을 통합했습니다. 새로운 추세 또는 스캘핑 기회의 정확한 트리거 포인트를 정확히 찾아낼 수 있기 때문에 거래가 어떻게 개선될지 상상해 보십시오. 사용 설명서: 여기를 클릭 https://www.mql5.com/en/blogs/post/708876 모든 시간대에 작동합니다. TREND를 빠르게 확인할 수 있습니다! 새로운 기본 알고리즘을 기반으로 설계되어 잠재적인 거래를 더욱 쉽게 식별하고 확인할 수 있습니다. 8개의
Currency Strength Wizard
Oleg Rodin
4.85 (59)
통화 강도 마법사는 성공적인 거래를 위한 올인원 솔루션을 제공하는 매우 강력한 지표입니다. 표시기는 여러 시간 프레임의 모든 통화 데이터를 사용하여 이 또는 해당 외환 쌍의 힘을 계산합니다. 이 데이터는 특정 통화의 힘을 확인하는 데 사용할 수 있는 사용하기 쉬운 통화 지수 및 통화 전력선의 형태로 표시됩니다. 필요한 것은 거래하려는 차트에 표시기를 부착하는 것뿐입니다. 표시기는 거래하는 통화의 실제 강세를 보여줍니다. 지표는 또한 추세와 거래할 때 유리하게 사용할 수 있는 구매 및 판매 거래량 압력의 극한값을 보여줍니다. 지표는 또한 피보나치에 기반한 가능한 대상을 보여줍니다. 표시기는 PUSH 알림을 포함한 모든 유형의 알림을 제공합니다. 구매 후 연락주세요. 나는 당신과 거래 팁을 공유하고 당신에게 무료로 훌륭한 보너스 지표를 줄 것입니다! 나는 당신에게 행복하고 유익한 거래를 기원합니다!
TPSpro RFI Levels
Roman Podpora
4.86 (28)
러시아어 설명서  /  영어   설명서  /  MT5 버전 주요 기능: 판매자와 구매자의 활동 영역을 표시합니다! 이 지표는 매수 및 매도에 대한 모든 올바른 첫 번째 임펄스 레벨/존을 표시합니다. 진입점 검색이 시작되는 이러한 레벨/존이 활성화되면 레벨의 색상이 바뀌고 특정 색상으로 채워집니다. 상황을 더욱 직관적으로 파악할 수 있도록 화살표도 표시됩니다. LOGIC AI - 템플릿 활성화 시 진입점 검색을 위한 영역(원) 표시 시각적 명확성을 개선하기 위해 인공지능을 사용하여 진입점을 검색한 영역을 표시하는 기능이 추가되었습니다. 더 높은 시간대의 레벨/존 표시(MTF 모드) 더 높은 시간 간격을 사용하여 레벨/존을 표시하는 기능이 추가되었습니다. 또한, 이 지표는 자동 추세 감지 기능(   TPSproTREND PRO   )을 구현했습니다. 거래를 위한 별도의 전문적인 단계별 알고리즘 이 알고리즘은 추세 방향과 반대 방향으로의 당일 거래 모두에 적합하도록 설계되었습니다. 각
Linear Trend Predictor - 진입 지점과 방향성 지원선을 결합한 추세 지표입니다. 고가/저가 채널을 돌파하는 원칙에 따라 작동합니다. 지표 알고리즘은 시장 노이즈를 걸러내고 변동성과 시장 역학을 고려합니다. 표시기 기능  평활화 방법을 사용하여 시장 추세와 BUY 또는 SELL 주문을 시작하기 위한 진입 시점을 보여줍니다.  모든 기간의 차트를 분석하여 단기 및 장기 시장 움직임을 파악하는 데 적합합니다.  어떠한 시장과 시간대에도 적용할 수 있으며, 입력 매개변수를 통해 거래자는 자신에게 맞게 지표를 독립적으로 사용자 지정할 수 있습니다.  설정된 지표 신호는 사라지거나 다시 그려지지 않습니다. 이는 캔들 마감 시 결정됩니다.  여러 유형의 알림이 화살표와 결합되어 있습니다.  이 지표는 독립적인 거래 시스템으로 사용할 수도 있고, 다른 거래 시스템에 추가하는 용도로도 사용할 수 있습니다.  모든 수준의 경험을 가진 거래자가 사용할 수 있습니다. 주요 매
Trend Screener
STE S.S.COMPANY
4.79 (95)
트렌드 표시기, 트렌드 트레이딩 및 필터링을 위한 획기적인 고유 솔루션, 하나의 도구 안에 내장된 모든 중요한 트렌드 기능! Forex, 상품, 암호 화폐, 지수 및 주식과 같은 모든 기호/도구에 사용할 수 있는 100% 다시 칠하지 않는 다중 시간 프레임 및 다중 통화 표시기입니다. 기간 한정 특가: 지원 및 저항 스크리너 지표는 단 100달러에 평생 제공됩니다. (원래 가격 50 달러) (제안 연장) Trend Screener는 차트에 점이 있는 화살표 추세 신호를 제공하는 효율적인 지표 추세 추종 지표입니다. 추세 분석기 표시기에서 사용할 수 있는 기능: 1. 트렌드 스캐너. 2. 최대 이익 분석이 있는 추세선. 3. 추세 통화 강도 측정기. 4. 경고가 있는 추세 반전 점. 5. 경고가 있는 강력한 추세 점. 6. 추세 화살표 Trend Screener Indicator가 있는 일일 분석 예, 일일 신호 성능...등은 여기에서 찾을 수 있습니다.   여기를 클릭하십시오. L
Advanced Currency Strength28 Indicator
Bernhard Schweigert
4.91 (657)
현재 40% 할인 초보자 또는 전문가 트레이더를 위한 최고의 솔루션! 이 지표는 우리가 독점 기능과 새로운 공식을 통합했기 때문에 독특하고 고품질이며 저렴한 거래 도구입니다. 단 하나의 차트로 28 Forex 쌍의 통화 강도를 읽을 수 있습니다! 새로운 추세 또는 스캘핑 기회의 정확한 트리거 포인트를 정확히 찾아낼 수 있기 때문에 거래가 어떻게 개선될지 상상해 보십시오. 사용 설명서: 여기를 클릭  https://www.mql5.com/en/blogs/post/697384 그것이 첫 번째, 원본입니다! 쓸모없는 지망생 클론을 사지 마십시오. 더 스페셜  강력한 통화 모멘텀을 보여주는 하위 창의 화살표 GAP가 거래를 안내합니다! 기본 또는 호가 통화가 과매도/과매도 영역(외부 시장 피보나치 수준)에 있을 때 개별 차트의 기본 창에 경고 표시가 나타납니다. 통화 강도가 외부 범위에서 떨어질 때 풀백/반전 경고. 교차 패턴의 특별 경고 추세를 빠르게 볼 수 있는 다중 시간
Auto Optimized Parabolic RSI: 고급 3D 모멘텀 엔진 대부분의 개인 투자자용 보조지표는 시장의 변동성이 변하는 순간 무용지물이 되는 정적인 입력값에 의존하기 때문에 실패합니다. Auto Optimized Parabolic RSI는 자체적인 수학적 우위를 지속적으로 재계산하여 "보조지표 노후화" 문제를 해결하며, 기관급 퀀트 트레이딩의 적응력을 귀하의 MT5 터미널에 직접 제공합니다. 핵심 이점: 맞춤형 인메모리 3D 최적화   표준 자동 최적화 도구들은 일반적인 보조지표 호출로 터미널에 과부하를 일으켜 MT5 플랫폼을 멈추게 하는 경우가 많습니다. 이 도구는 이러한 병목 현상을 완전히 우회합니다. 맞춤형 네이티브 RAM 기반 계산기로 구축된 내부 엔진은 차트를 로드하거나 타임프레임을 변경할 때마다 빛처럼 빠른 3D 그리드 검색을 실행합니다. RSI 기간(주기), SAR 스텝(가속도) 및 SAR 최대치(속도 제한)를 동시에 스캔하여 플랫폼 지연 없이 수만 개의
Atomic Analyst
Issam Kassas
5 (5)
우선적으로 언급할 점은이 거래 지표가 다시 그리지 않고 지연되지 않으며 이를 통해 수동 및 로봇 거래 모두에 이상적이라는 점입니다. 사용자 매뉴얼: 설정, 입력 및 전략. Atomic Analyst는 가격의 강도와 모멘텀을 활용하여 시장에서 더 나은 이점을 찾는 PA Price Action Indicator입니다. 고급 필터를 장착하여 잡음과 거짓 신호를 제거하고 거래 잠재력을 높이는 데 도움이 됩니다. 복잡한 지표의 다중 레이어를 사용하여 Atomic Analyst는 차트를 스캔하고 복잡한 수학적 계산을 간단한 신호와 색상으로 변환하여 초보 트레이더가 이해하고 일관된 거래 결정을 내릴 수 있도록합니다. "Atomic Analyst"는 새로운 및 경험이 풍부한 트레이더를위한 종합적인 거래 솔루션입니다. 프리미엄 지표와 최고 수준의 기능을 하나의 거래 전략에 결합하여 모든 종류의 트레이더에 대한 다재다능한 선택지가되었습니다. 인트라데이 거래 및 스캘핑 전략 : 빠르고 정확한 일일
Trend indicator AI
Ramil Minniakhmetov
4.53 (83)
트렌드 인공 지능 지표는 실행 가능한 진입 점 및 반전 경고와 추세 식별을 결합하여 상인의 시장 분석을 향상시킬 훌륭한 도구입니다. 이 표시기는 사용자가 자신감과 정밀도로 외환 시장의 복잡성을 탐색 할 수 있도록 지원합니다 기본 신호 외에도 트렌드 인공 지능 지표는 풀백 또는 되돌림 중에 발생하는 2 차 진입 점을 식별하여 거래자가 기존 트렌드 내에서 가격 수정을 활용할 수 있도록합니다. 중요한 장점: ·작동 4 및 5 *명확한 구매 또는 판매 신호 *다시 칠하지 않습니다 *모든 자산에서 작동 나는 전보 사기에 개 또는 세트를 판매하지 않도록주의. 모든 설정은 블로그에 여기에 무료.  중요! 지침 및 보너스를 얻기 위해 구입 후 즉시 저에게 연락! 진짜 가동 감시는 뿐 아니라 나의 다른 제품 여기에서 찾아낼 수 있습니다: https://www.mql5.com/en/users/mechanic/seller&nbsp ; 설정 및 입력: 모든 자산에 대해 기본 설정을 권
Order Block Hunter
Noha Mohamed Fathy Younes Badr
5 (10)
Order block hunter indicator is the best indicator for  hunt the order blocks that area where there has been a large concentration of limit orders waiting to be executed Order blocks are identified on a chart by observing previous price action and looking for areas where the price experienced significant movement or sudden changes in direction .This indicator does that for you by using very complicated codes and helps you to take the best areas To buy and sell because it make marks at the best a
GOLD Impulse with Alert
Bernhard Schweigert
4.67 (12)
이 지표는 Advanced Currency IMPULSE with ALERT  +   Currency Strength Exotics  의 2가지 제품의 슈퍼 조합입니다. 그것은 모든 시간 프레임에 대해 작동하며 8개의 주요 통화와 하나의 기호에 대한 강약의 충동을 그래픽으로 보여줍니다! 이 표시기는 금, 이국적인 쌍, 상품, 지수 또는 선물과 같은 기호에 대한 통화 강도 가속을 표시하는 데 특화되어 있습니다. 금, 은, 오일, DAX, US30, MXN, TRY, CNH 등의 진정한 통화 강도 가속(충동 또는 속도)을 표시하기 위해 9번째 줄에 모든 기호를 추가할 수 있습니다. 새로운 기본 알고리즘을 기반으로 구축되어 잠재적인 거래를 훨씬 더 쉽게 식별하고 확인할 수 있습니다. 이는 통화의 강세 또는 약세가 가속되는지 여부를 그래픽으로 표시하고 가속 속도를 측정하기 때문입니다. 자동차의 속도계처럼 생각하면 됩니다. 가속화할 때 Forex 시장에서 동일한 일이 분명히 더 빠르
Apollo SR Master
Oleg Rodin
5 (1)
Apollo SR Master는 지지/저항 구간에서의 거래를 더욱 쉽고 안정적으로 만들어 주는 특수 기능을 갖춘 지지/저항 지표입니다. 이 지표는 지역 가격의 고점과 저점을 감지하여 시간 지연 없이 실시간으로 지지/저항 구간을 계산합니다. 새롭게 형성된 저항 구간을 확인하기 위해 지표는 해당 저항 구간을 실제 매도 또는 매수 신호로 활용할 수 있음을 나타내는 특수 신호를 표시합니다. 이 경우, 저항 구간의 강도가 높아지고, 따라서 저항 구간에서의 성공적인 거래 가능성도 높아집니다. 이것이 바로 이 지표의 핵심 아이디어입니다. SR 존은 손절매와 이익실현을 더욱 쉽게 할 수 있도록 해줍니다. 신호 방향에 따라 SR 존 위 또는 아래 공간을 손절매로 활용할 수 있습니다. 또한, 반대쪽 SR 존은 잠재적 이익실현 영역으로 활용할 수 있습니다. 또한 Apollo SR Master 지표를 사용하는 모든 사용자에게 "Apollo Price Action System" 지표를 무료로 제공합니다.
Advanced Supply Demand
Bernhard Schweigert
4.91 (299)
현재 40% 할인! 초보자나 전문 트레이더를 위한 최고의 솔루션! 이 보조지표는 우리가 다수의 독창적 기능과 새로운 공식을 통합한 독특하고 고품질이며 저렴한 거래 도구입니다. 이 업데이트를 통해 이중 시간대를 표시할 수 있습니다. 더 높은 TF를 표시할 수 있을 뿐만 아니라 차트 TF와 더 높은 TF 모두를 표시할 수 있습니다: 중첩 영역 표시. 모든 Supply Demand 트레이더들이 좋아할 것입니다. :) 중요한 정보 공개 Advanced Supply Demand의 잠재력을 극대화하려면 다음을 방문하십시오. https://www.mql5.com/ko/blogs/post/720245   진입 또는 목표의 명확한 트리거 포인트를 정확히 찾아냄으로 해서 거래가 어떻게 개선될지 상상해 보십시오. 새로운 알고리즘을 기반으로 매수자와 매도자 간의 잠재적인 불균형을 훨씬 더 쉽게 분간할 수 있습니다. 왜냐하면 가장 강한 공급영역과 가장 강한 수요 영역과 과거에 어떻게 진행 되었는지를(이전
PRO Renko System
Oleg Rodin
5 (30)
PRO Renko System 은 RENKO 차트 거래를 위해 특별히 고안된 매우 정확한 거래 시스템입니다. 이것은 다양한 거래 상품에 적용될 수있는 보편적 인 시스템입니다. 체계는 효과적으로 당신에게 정확한 반전 신호에 접근을 주는 소위 시장 소음을 중화합니다. 이 표시기는 사용하기가 매우 쉽고 신호 생성을 담당하는 매개 변수가 하나만 있습니다. 당신은 쉽게 당신의 선택의 어떤 무역 계기에 공구를 적응시킬 수 있고 renko 막대기의 크기. 나는 항상 당신이 내 소프트웨어로 수익성있게 거래 할 수 있도록 추가 지원을 제공 할 준비가되어 있습니다! 나는 당신에게 행복하고 수익성있는 거래를 기원합니다! 구매 후 저에게 연락하십시오! 내 렌코 차트 생성기를 보내드립니다. 또한 내 개인 권장 사항 및 시스템의 다른 모듈을 무료로 공유 할 것입니다!
Volatility Trend System - a trading system that gives signals for entries. The volatility system gives linear and point signals in the direction of the trend, as well as signals to exit it, without redrawing and delays. The trend indicator monitors the direction of the medium-term trend, shows the direction and its change. The signal indicator is based on changes in volatility and shows market entries. The indicator is equipped with several types of alerts. Can be applied to various trading ins
MBFX Timing
Mohamed Hassan
5 (3)
After purchase, contact me in private to get 7 days of FREE testing with EA Forex Proton where the robot automatically takes the trade alerts from MBFX Timing! MBFX Timing is an indicator that was developed and created by Mostafa Belkhayate, one of the best traders in the world. We decided to create a modified version that takes inspiration from the Stochastic Oscillator and the Relative Strength Quality Index indicators to improve your trading.  One of the main reasons we released MBFX Timing
Easy Reversal
Mohamed Hassan
Easy Reversal is designed to help traders spot turning points in the market with clear buy and sell signals. The indicator is based on the Keltner Channel but improved with a custom calculation that uses ATR and EMA confirmation. This makes it more reliable and less noisy than standard reversal tools.  The signals from Easy Reversal appear directly from peak candlestick behavior, showing you when price action is reaching exhaustion. A buy signal is generated when a candlestick forms a strong r
- Real price is 80$ - 40% Discount (It is 49$ now) Contact me for instruction, add group and any questions! - Non-repaint - I just sell my products in Elif Kaya profile, any other websites are stolen old versions, So no any new updates or support. - Lifetime update free Related product:   Bitcoin Expert Introduction The breakout and retest strategy is traded support and resistance levels. it involves price breaking through a previous level.  The break and retest strategy is designed to help tr
Miraculous Indicator – Gann Square of Nine 기반 100% 비리페인트 Forex 및 바이너리 도구 이 영상은 Miraculous Indicator 를 소개합니다. 이 지표는 Forex 및 바이너리 옵션 트레이더를 위해 특별히 개발된 매우 정확하고 강력한 트레이딩 도구입니다. 이 지표가 독특한 이유는 전설적인 **Gann Square of Nine(Gann 9의 사각형)**과 **Gann's Law of Vibration(Gann 진동의 법칙)**에 기반을 두고 있기 때문입니다. 이는 현대 트레이딩에서 가장 정밀한 예측 도구 중 하나로 손꼽힙니다. Miraculous Indicator는 완전히 비리페인트(non-repaint) 됩니다. 즉, 캔들이 마감된 후에도 신호가 변경되거나 사라지지 않습니다. 보이는 것이 곧 결과입니다. 이는 트레이더가 자신감을 가지고 거래에 진입하고 청산할 수 있는 신뢰할 수 있고 일관된 기반을 제공합니다. 주요 특징: Gann
Pips Generator
Oleg Rodin
4.6 (10)
Apollo Pips Generator 는 추세의 방향으로 신호를 제공하는 지표입니다. 표시기는 여러 진입점을 제공하므로 항상 이익을 얻을 수 있는 거래 기회를 찾을 수 있습니다. 스크린샷에 주의하세요. 스크린샷은 상단과 하단을 나타내는 별 신호가 있는 채널로 표시되는 다른 도구와 함께 Pips Generator 도구를 보여줍니다. 이 조합은 시스템을 적용할 수 있는 여러 방법을 제공합니다. 구매 후 두 번째 표시기를 무료로 받으려면 저에게 연락하십시오. 스크린샷에 나와 있는 것과 완전히 동일한 시스템을 갖게 될 것입니다. 또한 최상의 결과를 얻기 위해 이 시스템을 사용하는 방법에 대한 지침도 제공합니다. 두 도구 모두 PUSH 알림을 포함한 모든 유형의 경고를 제공합니다. 나는 당신에게 행복한 거래를 기원합니다!
제작자의 제품 더 보기
ATR Bands Indicator
Teddy Mutugi Mworia Teddy Mutugi Mworia
5 (3)
In many strategies, it's quite common to use a scaled ATR to help define a stop-loss, and it's not uncommon to use it for take-profit targets as well. While it's possible to use the built-in ATR indicator and manually calculate the offset value, it's not particularly intuitive or efficient, and has the potential for miscalculations.  Features Configurable ATR offset Upper and Lower Band. configurable ATR scaling factor alternate(non-chart) ATR timeframe explicitly defined input types to improv
FREE
Color Gradient Background
Teddy Mutugi Mworia Teddy Mutugi Mworia
이 지표는 사용자가 원하는 두 가지 색상 간의 부드러운 전환을 적용하여 차트의 외관을 완전히 변화시킬 수 있도록 설계되었습니다. 이 기능을 통해 차트의 배경에 매력적인 그래디언트를 추가하면 차트가 더욱 신선하고 현대적인 느낌을 주게 됩니다. 시각적으로 더 매력적인 차트를 만들어 거래를 할 때 더욱 쾌적한 경험을 제공할 것입니다. 지표가 차트에 첨부되면 현재 차트에 있는 모든 지표 창에 그래디언트가 자동으로 적용됩니다. 이후에 추가되는 새로운 지표 창에도 동일한 그래디언트 효과가 적용되므로, 모든 지표가 일관된 외관을 유지하게 됩니다. 이 지표를 한 번 사용해 보세요! 차트의 외관을 새롭게 변화시켜 더 매력적이고 눈에 띄는 거래 환경을 만들어 보세요. 그래픽적으로 개선된 차트는 거래에 대한 집중력을 높이고 더 나은 결정을 내리는 데 도움이 될 것입니다.
FREE
MT5 CCI Dashboard Scanner
Teddy Mutugi Mworia Teddy Mutugi Mworia
MT5 CCI 대시보드 스캐너 MT5 CCI 대시보드 스캐너는 다양한 시간대와 금융 상품에서 상품 채널 지수(CCI) 수준을 추적하는 데 도움을 주며 새로운 신호가 감지될 때 실시간 경고를 제공하는 도구입니다. 사용하기 쉽고 컴퓨터의 계산 자원을 적게 사용하여 모든 컴퓨터에서 원활한 성능을 보장합니다. 주요 기능 자동 기구 그룹화 : 스캐너는 시장 관찰 목록의 모든 기구를 수집하고 이를 카테고리(메이저, 마이너, 엑조틱, 기타)로 정리합니다. 설정에서 간단한 체크박스 인터페이스를 사용하여 스캔할 기구를 쉽게 선택할 수 있습니다. 사용자 지정 가능한 시간대 선택 : 스캔을 위해 21개의 서로 다른 시간대 중에서 선택할 수 있습니다. 선택한 모든 시간대는 대시보드에 표시되며, 각 시간대에 대해 새로운 신호 알림이 전송됩니다. 쉬운 CCI 설정 : 기간 및 적용 가격을 포함한 CCI 설정을 조정하고 매수/매도 수준을 설정할 수 있습니다. 현재 캔들이나 가장 최근에 닫힌 캔들에 따라 스캔할
FREE
RSI Dashboard Scanner
Teddy Mutugi Mworia Teddy Mutugi Mworia
5 (1)
거래를 향상시키고 새로운 RSI 스캐너 버전으로 더 많은 흥미를 더하세요! 자동 기기 그룹화 : 스캐너는 자동으로 모든 기기를 시장 감시에서 수집하고, 이를 주요(Majors), 보조(Minors), 외래(Exotics), 기타(Others) 네 가지 카테고리로 조직합니다. 신호 선택 맞춤화 : 설정 페이지에서 어떤 기기를 신호 스캔 대상으로 선택할지 결정할 수 있습니다. 유연한 시간 프레임 선택 : 모니터링할 시간 프레임을 지정할 수도 있습니다. RSI 매개변수 구성 : 기간(Period) 및 적용 가격(Applied Price)을 포함한 RSI 매개변수를 쉽게 설정하고, 매수 및 매도 레벨을 정의할 수 있습니다. 현재 캔들 데이터를 사용할지, 아니면 캔들이 닫힐 때까지 기다릴지 선택할 수 있습니다. 개인화된 색상 맞춤화 : 전경, 배경, 매수 화살표 및 매도 화살표의 색상을 사용자 정의할 수 있습니다. 스캐너는 각 요소의 색상을 자동으로 조정하여 미적으로 만족스러운 인터페이스를
FREE
MT4 CCI Dashboard Scanner
Teddy Mutugi Mworia Teddy Mutugi Mworia
MT4 CCI 대시보드 스캐너는 다양한 시간대와 상품에 걸쳐 상품 채널 지수(CCI) 수준을 추적하고 새로운 신호가 감지될 때 실시간 경고를 제공합니다. 사용자 친화적이며 컴퓨터의 계산 능력에 부담을 주지 않아 어떤 컴퓨터에서도 원활한 성능을 보장합니다. 주요 기능: 자동 기기 그룹화 : 스캐너는 시장 감시 목록에서 모든 기기를 수집하고 주요, 보조, 이국적인, 기타 등으로 카테고리화합니다. 이후 설정에서 간단한 체크박스 인터페이스를 사용하여 스캔할 기기를 쉽게 선택할 수 있습니다. 사용자 정의 가능한 시간대 선택 : 설정 페이지에서 9개의 서로 다른 시간대 중에서 스캔할 시간을 선택할 수 있습니다. 선택한 모든 시간대는 대시보드에 표시되며, 각 시간대에 대한 새로운 신호 알림이 전송됩니다. 간편한 CCI 설정 : CCI 설정(기간 및 적용 가격)을 조정하고 매수/매도 수준을 설정할 수 있습니다. 현재 캔들 또는 가장 최근에 닫힌 캔들을 기준으로 스캔할지 선택할 수 있습니다. 색상
FREE
MT4 MA Tuner
Teddy Mutugi Mworia Teddy Mutugi Mworia
5 (1)
이동 평균선을 정밀 조정하는 궁극의 도구 이 도구는 이동 평균선 설정을 간소화하고 최적화하도록 설계된 고급 도구입니다. MA Tuner를 사용하면 사용자 친화적인 패널을 통해 핵심 매개변수(기간, 이동, 방법 및 가격)를 손쉽게 조정할 수 있으며, 촛대가 MA 선을 교차하는 빈도와 그에 대한 개방 및 종가 위치에 대한 자세한 통계 정보를 즉시 확인할 수 있습니다. 표준 이동 평균선 지표와 비교할 때 MA Tuner는 두드러진 장점을 제공합니다. 비록 MA Tuner가 표준 이동 평균선 지표와 동일한 MA 선을 그리지만, MA Tuner를 사용하면 매번 기간을 1로 증가시키거나 이동할 때마다 지표 창을 열 필요가 없습니다. 이러한 설계는 조작의 편리성과 효율성을 크게 향상시켜 주며, 복잡한 설정 조정에 시간을 낭비할 필요 없이 거래 전략 최적화에 더욱 집중할 수 있게 합니다. MA Tuner의 기능은 시장 동향 분석을 더욱 향상시킬 뿐만 아니라 실시간 거래 중에도 즉시 피드백을 제공
FREE
필터:
Abraham Correa
4594
Abraham Correa 2024.06.23 04:58 
 

Advanced coding doesn't seem to be unsatisfying. The rating is self explanatory!

Xavipas
187
Xavipas 2023.04.03 17:51 
 

Sencillo y eficaz. Para mi se ha convertido en un indispensable en el comercio forex. Gracias!!!

Youngon
152
Youngon 2022.12.04 17:09 
 

Powerful indicator when used together with others trading becomes a little easier

DennissKimani
26
DennissKimani 2022.08.31 16:37 
 

사용자가 평가에 대한 코멘트를 남기지 않았습니다

Teddy Mutugi Mworia Teddy Mutugi Mworia
5116
개발자의 답변 Teddy Mutugi Mworia Teddy Mutugi Mworia 2022.09.02 12:04
More on the way. Stay tuned 😊
Ricky Balozi
31
Ricky Balozi 2022.08.30 11:23 
 

사용자가 평가에 대한 코멘트를 남기지 않았습니다

리뷰 답변