Coloured Bollinger Bands
- 지표
- 버전: 1.3
- 업데이트됨: 26 1월 2025
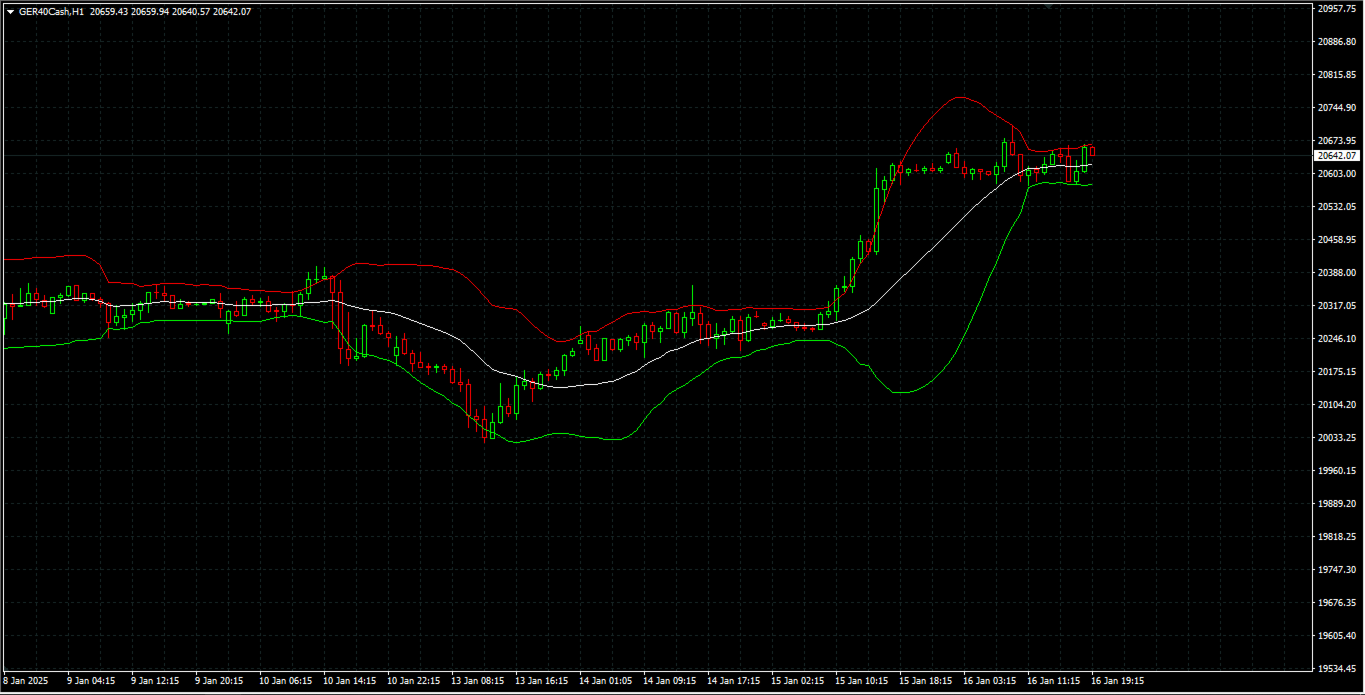
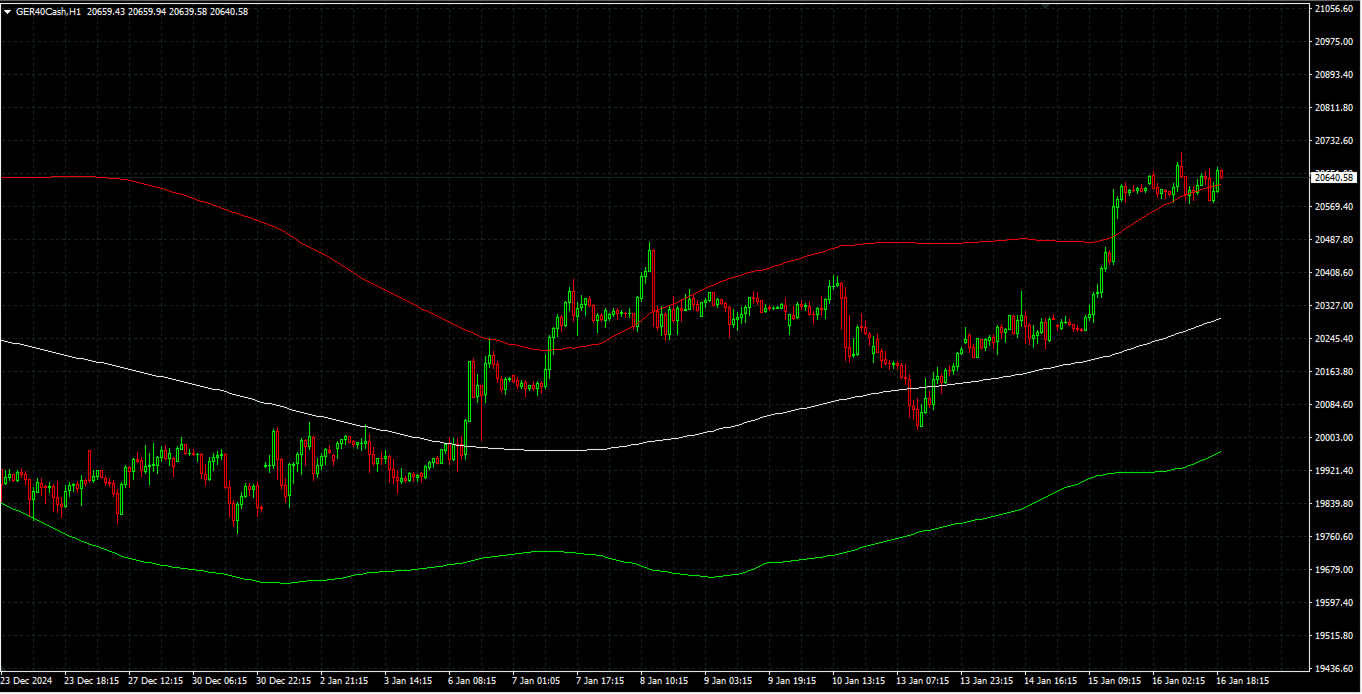
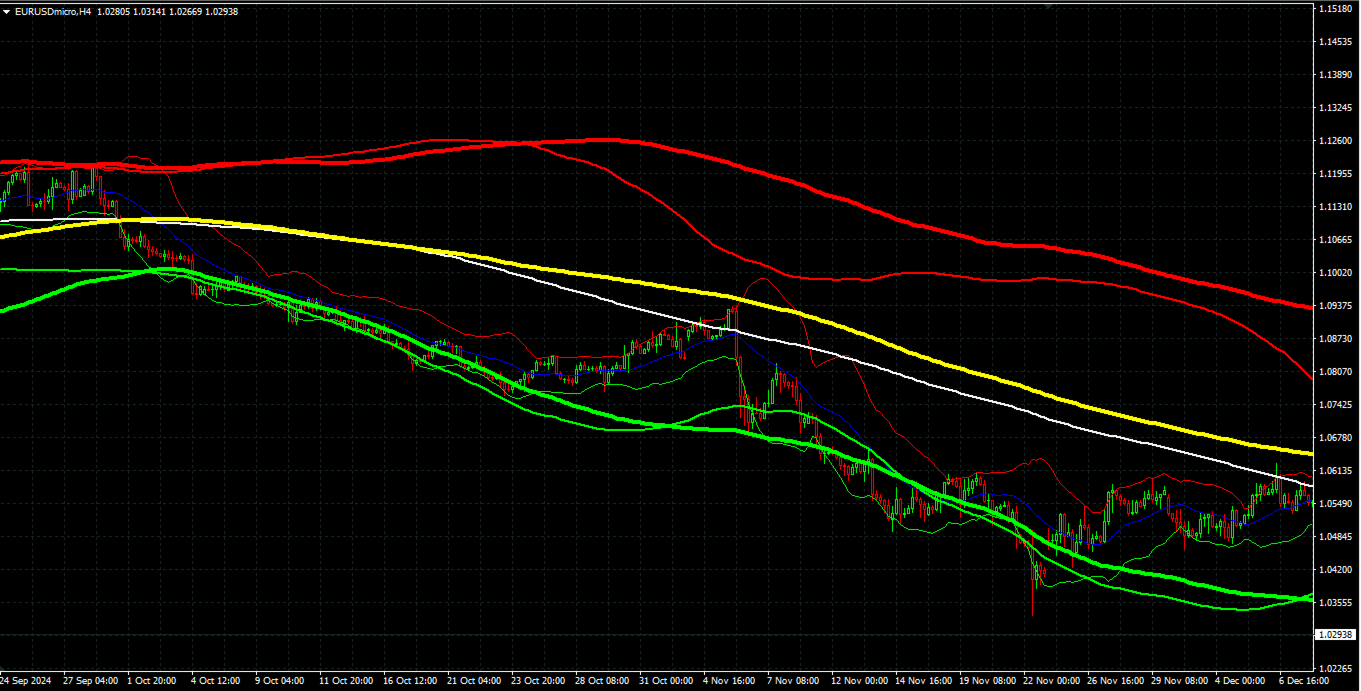
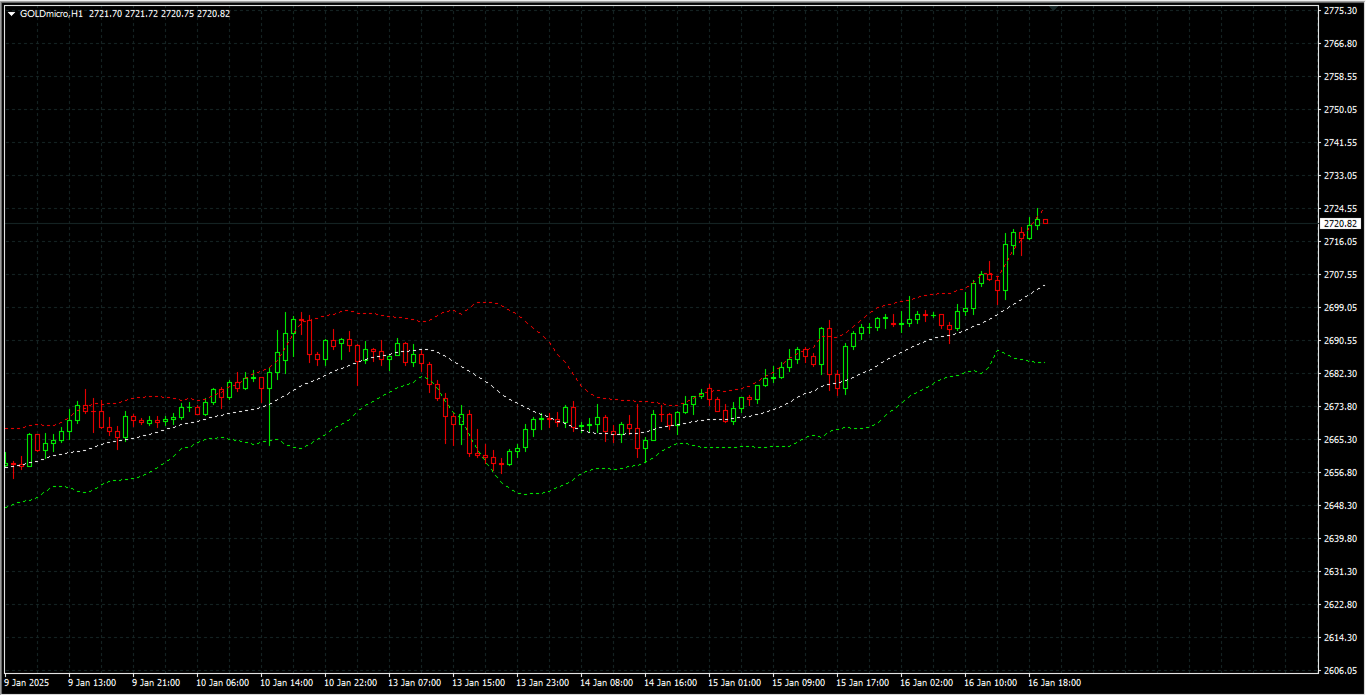
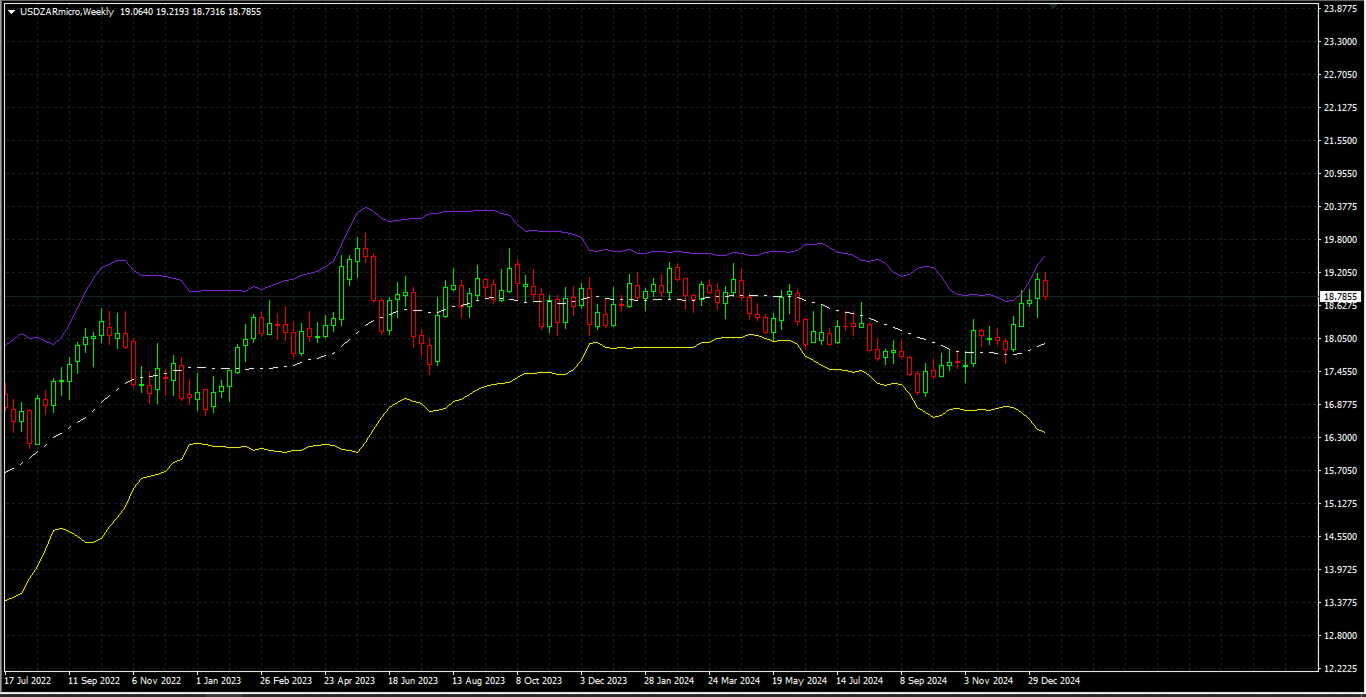
Coloured Bollinger Bands
The Coloured Bollinger Bands indicator is an enhanced version of the standard Bollinger Bands, offering customizable features to suit your trading needs. It uses the classic Simple Moving Average (SMA) as the middle band, and allows you to easily change the appearance of the bands, including the option to select colors and line types, ensuring better visual clarity and adaptability on your charts