Multi Timeframe charts
- 지표
- 버전: 1.1
- 활성화: 5

다른 시간 프레임의 최대 3개 추가 차트 분석, 기본 차트를 변경하지 않고.
다기능 유틸리티: 66+ 기능, 이 도구 포함 | 질문이 있으면 저에게 연락하세요 | MT4 버전
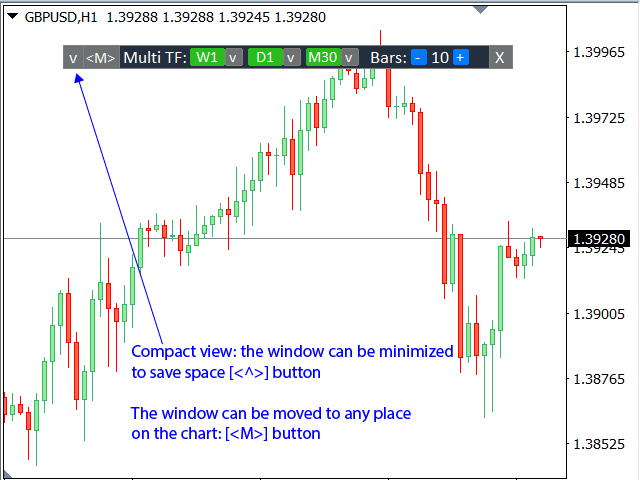
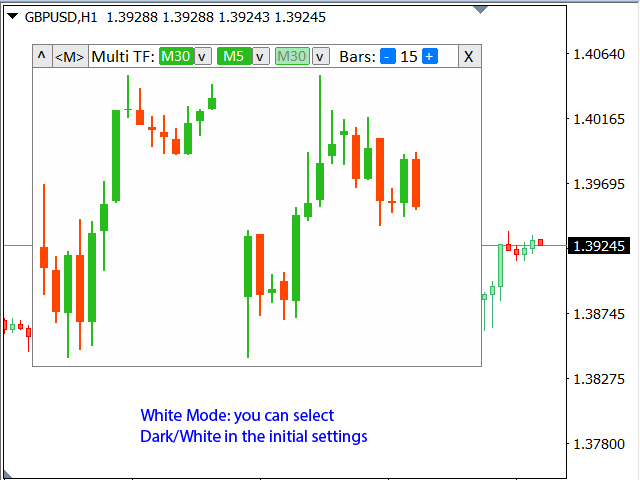
이 인디케이터는 별도 창에서 열립니다:
- 창 을 이동 할 수 있음 ( [<M>] 버튼 사용).
- 창은 공간을 절약하기 위해 최소화할 수도 있음 ([<^>] 버튼)
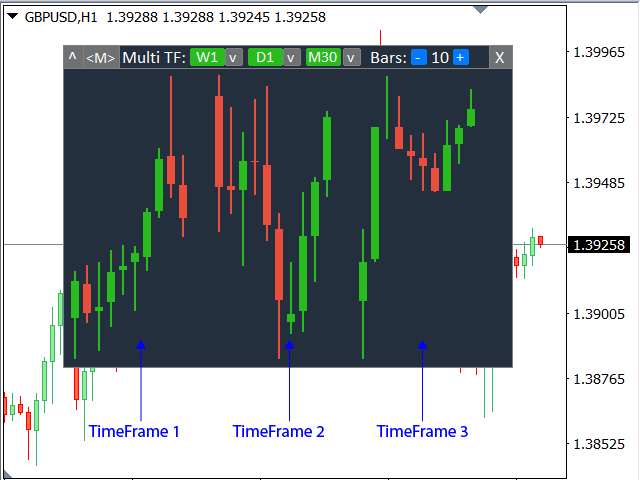
나타난 창에서 다음을 설정할 수 있습니다:
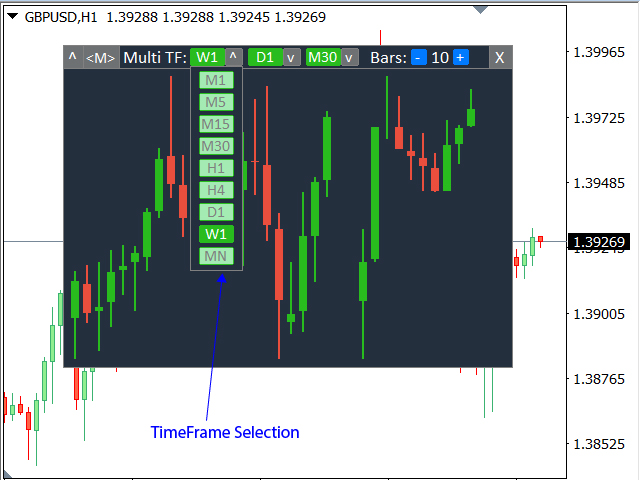
- 1번째 차트 의 기간 (왼쪽);
- 2번째 차트 의 기간 (중앙);
- 3번째 차트 의 기간 (오른쪽);
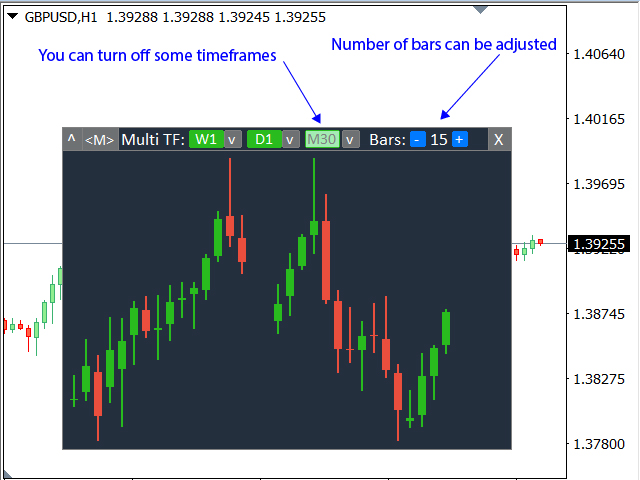
(각 시간 프레임은 비활성화 가능); - 각 시간 프레임의 바 수 。
최대 바 수:
a) 3개의 활성 차트: 30;
b) 2개의 활성 차트: 45;
c) 1개의 활성 차트: 90;
다기능 유틸리티: 66+ 기능, 이 도구 포함 | 질문이 있으면 저에게 연락하세요 | MT4 버전