Auto Zig HTF Vwap Midas

5

The best Vwap Midas coding for Metatrader 5 you can find in White Trader indicators.

The indicator has been optimized not to recalculate (improving performance) and has several visual settings for you to adapt in your own way.
TRY IT FOR FREE by clicking the free demo button

Where and why to use

Vwap Midas (and Auto Zig Vwap Midas) can be used on a variety of indices, currencies, forex, cryptocurrencies, stocks, indices and commodities.

Many successful traders use price and volume to get their results. Others use the concept of waves as in the Theory of Down or Eliott's Waves or even Wyckoff who analyzes market cycles.

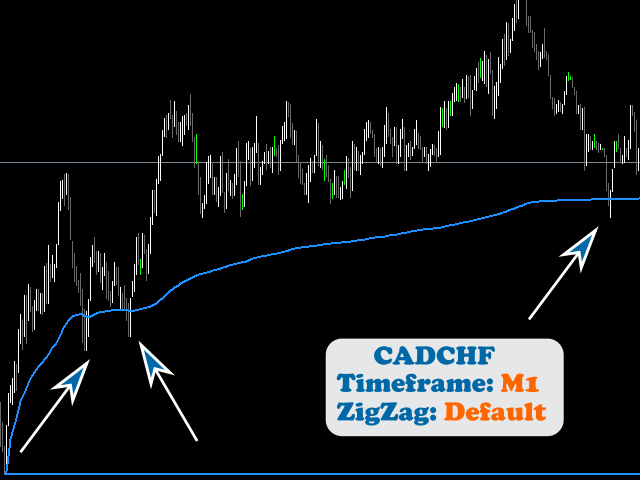
Vwap Custom (Midas) shows the average price of large investors as it is a volume weighted average. Combined with Zig Zag we will have automatic plotting on the last tops or bottoms.

Stop, Take Profit and risk/return


Getting the exact timing of the reversal is tricky, but catching the pullback (bullish or bearish) gives many opportunities where the stop is short (as it is close to the extreme) and the profit can be big. The Auto Zig Midas indicator will help you to find these moments on the chart, whether through the Vwap Midas or the tops formed by the ZigZag indicator. The stop and take markings will be well defined, and after evaluating the risk return you can decide to enter the trade.

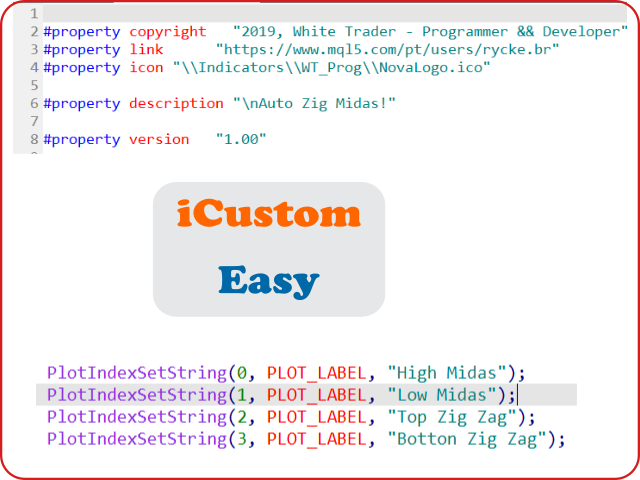
Use in Expert Advisors

Using it in Expert Advisors is simple as it is enough to read the vwap and zigzag top/bottom buffers. I will leave an image below where you can easily identify.

Unique (and TOP) functionality

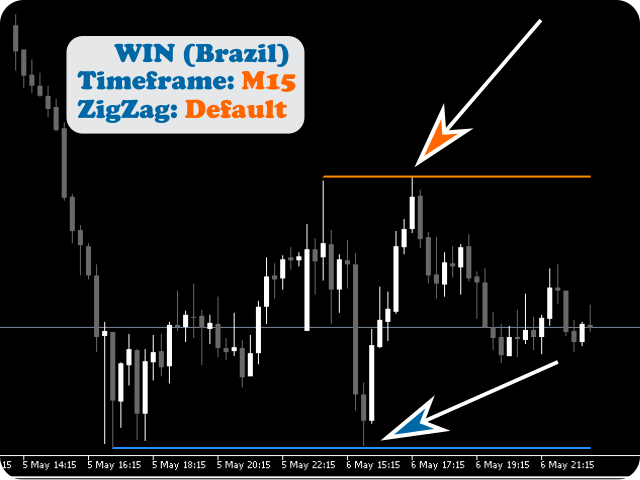
The Vwap Midas plot and top and bottom markings do not only rely on the last confirmed top/bottom. I added the possibility to choose the highest of the 3 tops and the lowest of the 3 most recent bottoms in the indicator. So, if you want to plot more than one indicator on the screen, you can monitor the most relevant tops of the moment.

Multi Timeframe (MTF - HTF)

The reading of the ZigZag indicator can happen on a Timeframe larger than the Timeframe of the chart. I like to use Midas at 1 minute, but I might want to read the tops and bottoms on a longer timeframe.

Finishing

Question: How is it possible to have so much functionality in a single indicator?

Answer: This is another indicator that comes up after talking to trades that were already operating like this consistently. The creation of the indicator is to help real traders make their trades easier.

Tips:

1) By changing the Zig Zag parameters you will be able to see movements of greater amplitude and relevance.

2) Whenever you have any doubts as to why the indicator has not plotted something, check the expert tab. The expert tab is my way of communicating to you what happened.

Oops:

When working with HTF (upper time frame) or MTF (multiple time frames) in metatrader 5 indicators we may encounter certain difficulties because the price series called by the indicator has not yet been delivered by mt5. Even more so with the auction closed.

I got around these difficulties, but I can't, for example, plot the zig zag of the top time frame on the screen.

If, with the trading session closed, the line does not plot, it is also because of this. By right clicking on the chart and then clicking refresh, mt5 displays the data it was unable to display previously.

Settings:

Midas  

Volume type 
tick or real volume
Price plot type
High & Low, Inverted High & Low, Median price, ...
  Show Midas Top    
  Show Midas Botton   true or false
               

ZigZag   

Backstep            
Depht
 It's up to you
Deviation           
 It's up to you
  Backstep It's up to you
Show ZZ (Current TF)
if you have it on the current timeframe you can choose to see the zigzag on the screen
 ► ► Timeframe Zig Zag  Here you choose the zigzag timeframe, which will determine the Vwap Midas anchor location and the top or bottom location
 ► ► Number of top/bottom  First, major/minor of the first two or major/minor of the first three?
 Show top and bottom
 true or false
                

Visual   


Color top
Color of your choice to mark the top and top Vwap Midas
Color botton
Color of your choice to mark the top and botton Vwap Midas
Width line
It's up to you
Style line
It's up to you

Sucess and good trades!

Discover the other indicators based on Midas Vwap by clicking on the left side on "More from the Author"!!!

And others!


리뷰 1
Diego Santiago De Meneses Carvalho
593
 

Ótimo indicador.

추천 제품
Accumulated Aggression
Edson Cavalca Junior
The indicator measures the accumulated balance of aggression. The formula is as follows:  Accumulated   = Previous Candle Accumulated + Purchase Volume - Sales Volume. Know our products    *** Did you like the product? Then, help us doing review in the " Reviews " tab. The indicator sends information to your email or cell phone when the accumulated balance changes direction. Example : Accumulated seller becomes a buyer. Note : It is recommended to use the default configuration and VPS valu
Value Chart Candlesticks
Flavio Javier Jarabeck
4.69 (13)
The idea of a Value Chart indicator was presented in the very good book I read back in 2020 , " Dynamic Trading Indicators: Winning with Value Charts and Price Action Profile ", from the authors Mark Helweg and David Stendahl. The idea is simple and the result is pure genius: Present candlestick Price analysis in a detrended way! HOW TO READ THIS INDICATOR Look for Overbought and Oversold levels. Of course, you will need to test the settings a lot to find the "correct" one for your approach. It
FREE
White Weis Volume Ticks
Ricardo Almeida Branco
5 (4)
White Weis Volume This indicator shows the sum of the volume in each wave, bulish or bearish, as idealized by David Weis , but it brings an important addition , which is the marking of the bar with the highest volume of the wave (White Bar)! In coding the indicator, it was sought to optimize the code to require minimal processing during use and not to overload mt5. The indicator can be used for pre-trading analysis and study, where the trader analyzes possible points of support and resistance
Weis Waves(와이스 웨이브) 는 데이비드 와이스(David Weis)가 개발하고 리차드 와이코프(Richard Wyckoff)의 원리에 기반한 기술적 지표입니다. 전통적인 거래량이 캔들마다 표시되는 것과 달리, Weis Waves는 거래량을 상승 또는 하락 “파동”으로 누적하며, 가격 방향이 바뀔 때마다 계산을 새로 시작합니다. 이 방법은 트레이더가 시장 움직임의 실제 힘 을 명확하게 파악할 수 있게 해줍니다. 각 파동은 일련의 캔들을 지탱하는 거래량의 강도를 보여줍니다. 주요 특징: 거래량을 매수 및 매도 파동으로 그룹화. 지배적인 압력(매수세 또는 매도세)을 강조. 추세 지속 또는 잠재적 반전 을 식별하는 데 도움. 와이코프 방법론에 기반하며, 거래량 및 흐름 분석에 널리 사용됨. Weis Waves는 가격과 거래량의 균형을 평가하기 위해 많은 전문 트레이더들이 활용하며, 시장 역학에 대한 더 깊은 통찰을 제공합니다.
FREE
The indicator enables very quick orientation in the market phase (re/accumulation, re/distribution, up/down trend). It is counted only from price data (without volume). It is based on the assumptions of Wyckoff's law of Causa and Effect. Oscillations are an expression of the level of market uncertainty and point to the presence of Big Money. Such a "storm" is followed by a calmer trend that needs to be exited. You need to use other tools or shorter period of the same indicator for that. I keep t
Weis Waves
Flavio Javier Jarabeck
2.83 (18)
The original author is David Weis, an expert in the Wyckoff Method. The Weis Wave is a modern adaptation of the 1930's Wyckoff Method, another expert in Tape Reading techniques and Chart Analysis. Weis Waves takes market volume and stacks it into waves according to price conditions giving the trader valuable insights about the market conditions. If you want to learn more about this subject you can find tons of videos in YouTube. Just look for "The Wickoff Method", "Weis Wave" and "Volume Spread
FREE
Volume-to-Price Movement Oscillator (VP Oscillator) for MT5 The VP Oscillator highlights the balance (or imbalance) between trading volume and price movement, helping traders spot hidden accumulation, distribution, or weakening trends. How It Works: Calculates each bar’s price range (High–Low) and tick volume. Normalizes both values over a set period (default: 14). Plots the absolute difference between them ×100 — showing how closely price action aligns with trading activity. Interpretation: Hig
FREE
Easy VWAP
Luca Spinello
VWAP Indicator, the short form of Volume Weighted Average Price, is similar to a moving average but takes into consideration the tick volume of the candles. The indicator calculates the moving average multiplying the price of each candle for the tick volume in the candle. Said calculation weighs with more significance price where more transactions were made. Features: Visual styling customizable Period customizable Ease of use
FREE
LT Weis Waves
Thiago Duarte
5 (11)
The Weis Wave first takes the market volume and then organizes it with the price into Wave charts. It is the only software that will present the true picture of the market before you. If anyone of you, has watched an intraday price movement then you must know that it unfolds in a series of selling as well as buying waves-a procedures tearing down and building up. Wave analysis is an integral part of the trading method. The indicator helps to deal with today’s volatile market. Moreover, it works
FREE
Friend of the trend
Anderson De Assis
Friend of the Trend: Your Trend Tracker Master the market with Friend of the Trend , the indicator that simplifies trend analysis and helps you identify the best moments to buy, sell, or wait. With an intuitive and visually striking design, Friend of the Trend analyzes price movements and delivers signals through a colorful histogram: Green Bars : Signal an uptrend, indicating buying opportunities. Red Bars : Alert to a downtrend, suggesting potential selling points. Orange Bars : Represent cons
FREE
SMC Order Block Zone
Faath Pondu Veettil
SMC Order Block Zones (MT5) is a Smart Money Concept (SMC) analytical indicator specially designed and optimized for Gold (XAUUSD) . It automatically detects Order Blocks and displays them as Supply & Demand zones , helping traders identify potential institutional price levels on Gold. The indicator uses volatility-adaptive logic , making it highly suitable for the fast and aggressive movements of XAUUSD. Key Features (XAUUSD Optimized) Specially designed for Gold (XAUUSD) Automatic Order Block
FREE
Time and Sales Tick
Pablo Filipe Soares De Almeida
Time & Sales Tick Indicator 는 MetaTrader 5 차트에서 실시간 거래 틱 정보를 표시하는 지표입니다. 가격, 틱 거래량 및 시간을 시각적으로 보여주며, 사용자가 시장 미세 구조를 분석할 수 있도록 도와줍니다. 기능 설명 가격, 거래량 및 시간을 포함한 틱 데이터를 차트 내 패널에 실시간으로 표시합니다. 틱 데이터를 사용자가 지정한 시간 또는 수량 간격으로 그룹화하고, 상승 틱은 녹색, 하락 틱은 빨간색으로 구분하여 표시합니다. 패널은 차트의 네 모서리 중 원하는 위치로 자유롭게 이동할 수 있으며, 표시 크기와 글꼴도 사용자 설정이 가능합니다. 모든 통화쌍 및 상품에 대응하며 MetaTrader 5 플랫폼 내에서 안정적으로 작동합니다. 이 인디케이터는 스캘핑 및 틱 기반 전략을 사용하는 트레이더에게 유용합니다.
AvgVolumes
Marco Montemari
5 (1)
This indicator is based on Volumes standard indicator, calculates the average of Volumes based on the last N bars set by users, and if the value of the volume is bigger then a set % respect the average a different color will be used. The indicator is shown in a separate indicator window. This version has now a limitation in setting the % about the threshold. If you are interested to set threshold consider to buy the PRO version ( https://www.mql5.com/en/market/product/35925 ) If you want to use
FREE
Indicador de Volume
Devscode Desenvolvimento de Softwares LTDA
4.5 (2)
This indicator is a volume indicator it changes the color of the candles according to a certain number of ticks, and this number of ticks can be informed by the user both the number of ticks and the color of the candles, this indicator works in any graphical time or any asset, provided that the asset has a ticker number to be informed. This indicator seeks to facilitate user viewing when analyzing candles with a certain number of ticks.
FREE
Gekko ADX Plus
Rodrigo Galeote
This is Gekko's Cutomized Cutomized Average Directional Index (ADX), a customized version of the famous ADX indicator. Use the regular ADX and take advantage two entry signals calculations and different ways of being alerted whenever there is potential entry or exit point. Inputs Period: Period for the ADX calculation; PlotSignalType: How will the indicator calculate entry (swing) signals: 1- ShowSwingsOnTrendLevel : Show Signals for Trend Confirmation Swings; 2- ShowSwingsOnTrendLevelDirection
This indicator calculates the difference between the SELL aggression and the BUY aggression that occurred in each Candle, plotting the balance of each one graphically. Note: This indicator DOES NOT WORK for Brokers and/or Markets WITHOUT the type of aggression (BUY or SELL). Be sure to try our   Professional   version with configurable features and alerts:   Delta Agression Volume PRO Settings Aggression by volume (Real Volume) or by number of trades (Tick Volume) Start of the Aggression Delta
FREE
MW Volume
Martin Bittencourt
3.8 (5)
The Martinware Volume indicator plots a colored moving average over volume bars. The coloring uses three colors and can be done in different ways choosable by the user and is applied both to the average as to the volume bars. Three types of coloring are possible: None: no coloring is done Increasing or decreasing: changes the color depending on the current value being bigger or lesser than the previous one Volume relative to average: colors vary if the current volume is bigger or lesser then
FREE
High Low Open Close
Alexandre Borela
4.98 (42)
이 프로젝트를 좋아한다면 5 스타 리뷰를 남겨주세요. 이 지표는 열리고, 높은, 낮은 및 마감 가격을 지정합니다. 기간과 그것은 특정한 시간대를 위해 조정될 수 있습니다. 이들은 많은 기관 및 전문가에 의해 보는 중요한 수준입니다 상인은 당신이 더 많은 것일 수있는 장소를 알고 도움이 될 수 있습니다 이름 * 사용 가능한 기간: 이전 날. 이전 주. 지난 달. 이전 분기. 이전 연도. 또는: 현재 날. 현재 주. 현재 달. 현재 분기. 현재 년.
FREE
Aggression Volume
Flavio Javier Jarabeck
4.29 (17)
Aggression Volume Indicator is the kind of indicator that is rarely found in the MQL5 community because it is not based on the standard Volume data provided by the Metatrader 5 platform. It requires the scrutiny of all traffic Ticks requested on the platform... That said, Aggression Volume indicator requests all Tick Data from your Broker and processes it to build a very special version of a Volume Indicator, where Buyers and Sellers aggressions are plotted in a form of Histogram. Additionally,
FREE
Cumulative Delta MT5
Evgeny Shevtsov
4.55 (60)
The indicator analyzes the volume scale and splits it into two components - seller volumes and buyer volumes, and also calculates the delta and cumulative delta. The indicator does not flicker or redraw, its calculation and plotting are performed fairly quickly, while using the data from the smaller (relative to the current) periods. The indicator operation modes can be switched using the Mode input variable: Buy - display only the buyer volumes. Sell - display only the seller volumes. BuySell -
FREE
Waves Sizer
Flavio Javier Jarabeck
3.86 (7)
Wyckoff fans, enjoy! Ideally to be used with the Weis Waves indicator, but it can be easily used alone, the Waves Sizer puts the range (in resulting Price movement) done by the Price on its market swings. You can control how accurate or loose will be the swings. This tool is very helpful for visually know how much the Price has traveled in your Timeframe. This way you can confront this level of effort with the resulting Volume, etc... Weis Waves indicator: https://www.mql5.com/en/market/produc
FREE
BoxInside MT5
Evgeny Shevtsov
5 (4)
This indicator calculates the volume profile and places labels that correspond to the VAH, VAL and POC levels, for each candle individually. Indicator operation features The indicator works on the timeframes from M3 to MN, but it uses the history data of smaller periods: M1 - for periods from M3 to H1, M5 - for periods from H2 to H12, M30 - for the D1 period, H4 - for the W1 period, D1 - for the MN period. The color and location of the VAL, VAH and POC labels on the current candle are considere
FREE
Aggression Volume Profile
Edson Cavalca Junior
4.55 (11)
This indicator plots the volume profile by Price on the chart There are 5 ways to view it: By Total Volume Traded (Premium Version); Volume Ticks(Forex) Separated by Buyers and Sellers (Premium Version); Buyers Only (Premium Version); Sellers Only (Premium Version); Business balance (Buyers - Sellers) (Premium Version); . It is possible to select how many days the profiles will be calculated.( Premium Version) On the current day it recalculates the histogram data for each new candlestick.
FREE
CMF Scalping Indicator
Thiago Pereira Pinho
Dynamic CMF Calculation: Customize the period for the Chaikin Money Flow (CMF) to fine-tune your analysis and maximize signal precision. Intuitive Color-Coded Alerts: Instantly interpret market conditions with clear visual cues: Green Alert: Indicates the Overbought zone – signaling a potential selling opportunity. Red Alert: Indicates the Oversold zone – suggesting a potential buying opportunity. Gray Alert: Represents the Neutral zone – a signal to wait for a confirmed trend or reversal. Autom
FREE
True Support Resistance Indicator: Your Ultimate Tool for Precise Trading Decisions​ Quick Overview ​ It's a simple indicator that elevates your trading strategy.  True Support Resistance Indicator​ ​ is a powerful tool designed to identify key support/resistance levels in real-time. Experience clean visuals, instant alerts on breakouts, and dynamic updates that keep you ahead of market movements. Why Choose True Support Resistance Indicator? 1. Simplicity Meets Precision -  Two clearly colored
FREE
ATR crossover histogram
Mattia Impicciatore
5 (1)
MT5 ATR 변동성 히스토그램 – 기술적 변동성 분석 이 지표는 빠른 ATR과 느린 ATR의 차이를 계산하여 히스토그램 형태로 표시하며, 시장 변동성 변화를 실시간으로 시각화할 수 있습니다. 계산 방법 변동성 차이 = 빠른 ATR - 느린 ATR 해석 양수 값(녹색 바)은 변동성이 증가하고 있음을 나타내며, 돌파(momentum)를 확인할 수 있습니다. 음수 값(빨간색 바)은 변동성이 감소하고 있음을 나타내며, 조정 또는 모멘텀 약화를 시사합니다. 활용 예시 가격 돌파 시 변동성이 증가하는지 확인하여 신뢰도를 높임 모멘텀 변화가 녹색 바와 함께 나타날 경우 추세 전환 신호를 강화 가격이 신고가 또는 신저가를 기록하더라도 변동성이 동반 상승하지 않으면 다이버전스 가능성 탐지 캔들 패턴이나 프라이스 액션과 결합하여 강한 변동성 기반의 진입 신호만 선별 추천 보조 도구 이 지표는 "캔들스틱 패턴 인식" 도구와 함께 사용할 수 있습니다: https://www.mql5.com/en/m
FREE
Color Histogram Volume Set
Ricardo Almeida Branco
Do you use volume in your reading of the market? Certainly many traders use it, and do not imagine operating without it. The Color Histogram Volume Set indicator allows the user to choose the value that he considers interesting to monitor. When you pass this you will have visual confirmation and if you want you will also have the audible alert that is given by the indicator. Of course, there are other ways to try to find a high volume, such as assessing whether the volume is above av
XbigCandleFibo
Alex Sandro Aparecido
This indicator marks the 50% mark of each candle. It will help you make profitable scalping trades. If the next candle opens above the 50% mark of the previous candle, you should open a BUY position, and if the next candle opens below the 50% mark of the previous candle, you should open a SELL position. This strategy is very profitable. To make the most of it, keep an eye on the candle contexts on the left. Good luck!
FREE
VWAP Personnal Custom
Vincent Jose Proenca
VWAP_PC_MQL5 — a simple home-built VWAP indicator showing real-time volume-weighted price levels directly on your MT5 chart. TF: Works on all timeframes. Pair: Compatible with all symbols — Forex, indices, commodities, and stocks. Settings: Applied Price – price type used for VWAP calculation (Close, Typical, Weighted, etc.) Line Color / Width / Style – customize VWAP line appearance Session Reset – optional reset per day or continuous mode How it works (VWAP principle): VWAP (Volume Weighted
FREE
VwapBandsIndicator
Samuel De Souza Ferreira
VWAP Bands Indicator – The Revolution in Trend Analysis! The VWAP Bands Indicator is the ultimate tool for traders seeking precision and clarity in market analysis! Based on the Volume-Weighted Average Price (VWAP) , this indicator not only displays the main trend but also adds three dynamic bands to capture volatility and identify strategic buy and sell zones . Why Use the VWAP Bands Indicator? Professional Accuracy – Identifies support and resistance areas based on real volume. Th
FREE
이 제품의 구매자들이 또한 구매함
이 지표를 구매하면 제 프로페셔널 트레이드 매니저를 무료로 드립니다. 우선 이 거래 시스템이 리페인팅, 리드로잉 및 레이그 인디케이터가 아니라는 점을 강조하는 것이 중요합니다. 이는 수동 및 로봇 거래 모두에 이상적인 것으로 만듭니다. 온라인 강좌, 설명서 및 프리셋 다운로드. "스마트 트렌드 트레이딩 시스템 MT5"은 새로운 및 경험이 풍부한 트레이더를 위해 맞춤형으로 제작된 종합적인 거래 솔루션입니다. 10개 이상의 프리미엄 인디케이터를 결합하고 7개 이상의 견고한 거래 전략을 특징으로 하여 다양한 시장 조건에 대한 다목적 선택이 가능합니다. 트렌드 추종 전략: 효과적인 트렌드 추이를 타기 위한 정확한 진입 및 손절 관리를 제공합니다. 반전 전략: 잠재적인 트렌드 반전을 식별하여 트레이더가 범위 시장을 활용할 수 있게 합니다. 스캘핑 전략: 빠르고 정확한 데이 트레이딩 및 단기 거래를 위해 설계되었습니다. 안정성: 모든 인디케이터가 리페인팅, 리드로잉 및 레이그가 아니므로 신뢰
ARIPoint
Temirlan Kdyrkhan
1 (1)
ARIPoint is a powerful trading companion designed to generate high-probability entry signals with dynamic TP/SL/DP levels based on volatility. Built-in performance tracking shows win/loss stats, PP1/PP2 hits, and success rates all updated live. Key Features: Buy/Sell signals with adaptive volatility bands Real-time TP/SL/DP levels based on ATR Built-in MA Filter with optional ATR/StdDev volatility Performance stats panel (Success, Profit/Loss, PP1/PP2) Alerts via popup, sound, push, or email Cu
SuperScalp Pro
Van Minh Nguyen
5 (2)
SuperScalp Pro – 고급 다중 필터 스캘핑 인디케이터 시스템 SuperScalp Pro는 클래식 Supertrend와 여러 지능형 확인 필터를 결합한 고급 스캘핑 인디케이터 시스템입니다. 해당 인디케이터는 M1부터 H4까지 모든 타임프레임에서 효율적으로 작동하며, 특히 XAUUSD, BTCUSD 및 주요 외환 통화쌍에 적합합니다. 독립형 시스템으로 사용하거나 기존 거래 전략에 유연하게 통합할 수 있습니다. 이 인디케이터는 11개 이상의 필터를 통합하며, 빠른/느린 EMA, 추세 판별용 3개의 EMA, EMA 기울기(EMA slope), RSI, ADX, 거래량(Volume), VWAP, 볼린저 밴드 돌파(Bollinger Bands Breakout) 및 MACD 다이버전스 필터 등을 포함합니다. 스마트 캔들 필터는 캔들 종가를 확인하여 약한 신호를 제거하고, 3 EMA와 MACD 다이버전스 필터를 결합한 추세 인식 메커니즘은 더 높은 승률의 신호를 선별하는 데 도움을 줍니
Divergence Bomber
Ihor Otkydach
4.89 (82)
이 지표를 구매하신 분께는 다음과 같은 혜택이 무료로 제공됩니다: 각 거래를 자동으로 관리하고, 손절/익절 수준을 설정하며, 전략 규칙에 따라 거래를 종료하는 전용 도우미 툴 "Bomber Utility" 다양한 자산에 맞게 지표를 설정할 수 있는 셋업 파일(Set Files) "최소 위험", "균형 잡힌 위험", "관망 전략" 모드로 설정 가능한 Bomber Utility의 셋업 파일 이 전략을 빠르게 설치, 설정, 시작할 수 있도록 돕는 단계별 영상 매뉴얼 주의: 위의 모든 보너스를 받기 위해서는 MQL5 개인 메시지 시스템을 통해 판매자에게 연락해 주세요. 독창적인 커스텀 지표인 “Divergence Bomber(다이버전스 봄버)”를 소개합니다. 이 지표는 MACD 다이버전스(괴리) 전략을 기반으로 한 올인원(All-in-One) 거래 시스템입니다. 이 기술 지표의 주요 목적은 가격과 MACD 지표 간의 다이버전스를 감지하고, **향후 가격이 어느 방향으로 움직일지를 알려주는
Game Changer Indicator mt5
Vasiliy Strukov
5 (12)
Game Changer는 모든 금융 상품에 사용하도록 설계된 혁신적인 추세 지표로, 메타트레이더를 강력한 추세 분석기로 탈바꿈시켜 줍니다. 이 지표는 재작성이나 지연 현상이 발생하지 않습니다. 모든 시간대에서 작동하며 추세 파악을 지원하고, 잠재적 반전 신호를 제공하며, 트레일링 스톱 메커니즘으로 활용되고, 신속한 시장 반응을 위한 실시간 알림을 제공합니다. 숙련된 투자자, 전문가, 또는 우위를 점하려는 초보자 등 누구나 이 도구를 통해 자신감과 원칙을 바탕으로, 그리고 근본적인 추세 역학에 대한 명확한 이해를 바탕으로 거래할 수 있습니다. 구매 후 바로 연락 주시면 개인 보너스를 드립니다! 강력한 지지선과 추세 스캐너 지표를 무료로 받으실 수 있습니다. 개인 메시지로 알려주세요 저는 텔레그램에서 EA나 특별 세트를 판매하지 않습니다. Mql5에서만 사용 가능하며, 세트 파일은 제 블로그에서만 볼 수 있습니다 . 사기꾼을 조심하시고 다른 사람에게서 세트를 구매하지 마세요 설정 추세
Entry In The Zone and SMC Multi Timeframe is a real-time market analysis tool developed based on Smart Money Concepts (SMC). It is designed to analyze market structure, price direction, reversal points, and key zones across multiple timeframes in a systematic way. The system displays Points of Interest (POI) and real-time No Repaint signals, with instant alerts when price reaches key zones or when signals occur within those zones. It functions as both an Indicator and a Signal System (2-in-1), c
Power Candles MT5
Daniel Stein
5 (5)
Power Candles – 모든 시장을 위한 강도 기반 진입 신호 Power Candles 는 Stein Investments의 검증된 강도 분석을 가격 차트에 직접 제공합니다. 가격 움직임에만 반응하는 대신, 각 캔들은 실제 시장 강도를 기준으로 색상화되어 모멘텀 형성, 강도 가속, 명확한 추세 전환을 즉시 파악할 수 있습니다. 모든 시장을 위한 단일 로직 Power Candles는 모든 거래 심볼 에서 자동으로 작동합니다. 현재 심볼이 Forex인지 비-Forex 시장인지 자동으로 감지하여 내부적으로 적절한 강도 모델을 적용합니다. Forex 및 Gold 는 FX Power Delta 값을 사용합니다 (절대값 범위 최대 100) 지수, 크립토 및 CFD 는 IX Power Strength 값을 사용합니다 (절대값 범위 최대 50) 필요한 강도 계산은 Power Candles에 완전히 내장되어 있습니다. 캔들 색상이나 신호 로직을 위해 추가 인디케이터는 필요하지 않습니다. 가격
Azimuth Pro
Ottaviano De Cicco
5 (3)
LAUNCH PROMO Azimuth Pro price is initially set at 299$ for the first 100 buyers. Final price will be 499$ . THE DIFFERENCE BETWEEN RETAIL AND INSTITUTIONAL ENTRIES ISN'T THE INDICATOR — IT'S THE LOCATION. Most traders enter at arbitrary price levels, chasing momentum or reacting to lagging signals. Institutions wait for price to reach structured levels where supply and demand actually shift. Azimuth Pro maps these levels automatically: swing-anchored VWAP, multi-timeframe structure lines, an
FX Power MT5 NG
Daniel Stein
5 (31)
FX Power: 통화 강세 분석으로 더 스마트한 거래 결정을 개요 FX Power 는 어떤 시장 상황에서도 주요 통화와 금의 실제 강세를 이해하기 위한 필수 도구입니다. 강한 통화를 매수하고 약한 통화를 매도함으로써 FX Power 는 거래 결정을 단순화하고 높은 확률의 기회를 발견합니다. 트렌드를 따르거나 극단적인 델타 값을 사용해 반전을 예측하고자 한다면, 이 도구는 귀하의 거래 스타일에 완벽히 적응합니다. 단순히 거래하지 말고, FX Power 로 더 스마트하게 거래하세요. 1. FX Power가 거래자에게 매우 유용한 이유 통화와 금의 실시간 강세 분석 • FX Power 는 주요 통화와 금의 상대적 강세를 계산하고 표시하여 시장 역학에 대한 명확한 통찰력을 제공합니다. • 어떤 자산이 앞서고 있고 어떤 자산이 뒤처지는지 모니터링하여 보다 현명한 거래 결정을 내릴 수 있습니다. 포괄적인 멀티 타임프레임 뷰 • 단기, 중기 및 장기 타임프레임에서 통화와 금의 강세를
TrendMaestro5
Stefano Frisetti
note: this indicator is for METATRADER4, if you want the version for METATRADER5 this is the link:  https://www.mql5.com/it/market/product/108106 TRENDMAESTRO ver 2.5 TRENDMAESTRO recognizes a new TREND from the start, he never makes mistakes. The certainty of identifying a new TREND is priceless. DESCRIPTION TRENDMAESTRO identifies a new TREND in the bud, this indicator examines the volatility, volumes and momentum to identify the moment in which there is an explosion of one or more of these da
Grabber System MT5
Ihor Otkydach
4.82 (22)
탁월한 기술적 지표인 Grabber를 소개합니다. 이 도구는 즉시 사용 가능한 “올인원(All-Inclusive)” 트레이딩 전략으로 작동합니다. 하나의 코드 안에 강력한 시장 기술 분석 도구, 매매 신호(화살표), 알림 기능, 푸시 알림이 통합되어 있습니다. 이 인디케이터를 구매하신 모든 분들께는 다음의 항목이 무료로 제공됩니다: Grabber 유틸리티: 오픈 포지션을 자동으로 관리하는 도구 단계별 영상 매뉴얼: 설치, 설정, 그리고 실제 거래 방법을 안내 맞춤형 세트 파일: 인디케이터를 빠르게 자동 설정하여 최고의 성과를 낼 수 있도록 도와줍니다 다른 전략은 이제 잊어버리세요! Grabber만이 여러분을 새로운 트레이딩의 정점으로 이끌어 줄 수 있습니다. Grabber 전략의 주요 특징: 거래 시간 프레임: M5부터 H4까지 거래 가능한 자산: 어떤 자산이든 사용 가능하지만, 제가 직접 테스트한 종목들을 추천드립니다 (GBPUSD, GBPCAD, GBPCHF, AUDCAD, AU
Atomic Analyst MT5
Issam Kassas
4.07 (28)
우선적으로 언급할 점은이 거래 지표가 다시 그리지 않고 지연되지 않으며 이를 통해 수동 및 로봇 거래 모두에 이상적이라는 점입니다. 사용자 매뉴얼: 설정, 입력 및 전략. Atomic Analyst는 가격의 강도와 모멘텀을 활용하여 시장에서 더 나은 이점을 찾는 PA Price Action Indicator입니다. 고급 필터를 장착하여 잡음과 거짓 신호를 제거하고 거래 잠재력을 높이는 데 도움이 됩니다. 복잡한 지표의 다중 레이어를 사용하여 Atomic Analyst는 차트를 스캔하고 복잡한 수학적 계산을 간단한 신호와 색상으로 변환하여 초보 트레이더가 이해하고 일관된 거래 결정을 내릴 수 있도록합니다. "Atomic Analyst"는 새로운 및 경험이 풍부한 트레이더를위한 종합적인 거래 솔루션입니다. 프리미엄 지표와 최고 수준의 기능을 하나의 거래 전략에 결합하여 모든 종류의 트레이더에 대한 다재다능한 선택지가되었습니다. 인트라데이 거래 및 스캘핑 전략 : 빠르고 정확한 일일
Super Signal – Skyblade Edition 전문가용 노리페인트 / 노래그 트렌드 신호 시스템, 뛰어난 승률 제공 | MT4 / MT5용 1분, 5분, 15분과 같은 낮은 타임프레임에서 가장 좋은 성능을 보입니다. 핵심 기능: Super Signal – Skyblade Edition은 추세 매매를 위해 설계된 스마트 신호 시스템입니다. 이 시스템은 다중 필터 로직을 활용하여, 명확한 방향성과 실질적인 모멘텀이 수반된 고품질 추세만을 감지합니다. 이 시스템은   고점 또는 저점을 예측하지 않으며 , 다음 세 가지 조건이 모두 충족될 때만 신호를 발생시킵니다: 명확한 추세 방향 강화되는 모멘텀 건전한 변동성 구조 또한, 시장 세션 기반의 유동성 분석을 통해 신호의 신뢰성과 타이밍을 더욱 향상시킵니다. 신호 특성: 모든 화살표 신호는 100% 리페인트 없음 / 지연 없음 신호가 한 번 발생하면 고정되며, 깜빡이거나 사라지지 않음 차트 상의 시각적 화살표, 정보 패널, 팝업
Trend Screener Pro MT5
STE S.S.COMPANY
4.84 (100)
트렌드 표시기, 트렌드 트레이딩 및 필터링을 위한 획기적인 고유 솔루션, 하나의 도구 안에 내장된 모든 중요한 트렌드 기능! Forex, 상품, 암호 화폐, 지수 및 주식과 같은 모든 기호/도구에 사용할 수 있는 100% 다시 칠하지 않는 다중 시간 프레임 및 다중 통화 표시기입니다. Trend Screener는 차트에 점이 있는 화살표 추세 신호를 제공하는 효율적인 지표 추세 추종 지표입니다. 추세 분석기 표시기에서 사용할 수 있는 기능: 1. 트렌드 스캐너. 2. 최대 이익 분석이 있는 추세선. 3. 추세 통화 강도 측정기. 4. 경고가 있는 추세 반전 점. 5. 경고가 있는 강력한 추세 점. 6. 추세 화살표 Trend Screener Indicator가 있는 일일 분석 예, 일일 신호 성능...등은 여기에서 찾을 수 있습니다. 여기를 클릭하십시오. LIMITED TIME OFFER : Trend Screener Indicator는 50$ 및 평생 동안만 사용할 수 있습니다.
Smart Stop Indicator – 차트 위에서 직접 작동하는 지능형 스톱로스 시스템 개요 Smart Stop Indicator는 감이나 추측이 아닌 명확하고 체계적인 방식으로 스톱로스를 설정하고 싶은 트레이더를 위한 맞춤형 솔루션입니다. 이 도구는 클래식 프라이스 액션 논리(고점, 저점 구조)와 현대적인 브레이크아웃 인식을 결합하여 실제로 가장 논리적인 다음 스톱 레벨을 정확히 식별합니다. 추세, 박스권, 빠른 브레이크아웃 상황 등 어떤 시장에서도 인디케이터는 최적의 SL 구역과 상태(“new”, “broken”, “valid”)를 차트에 직접 표시합니다. 새로운 기능으로 SL 거리의 %ADR 표시가 추가되었습니다. 핵심 기능 자동 시장구조 기반 스톱 설정 • 시장 구조와 실시간 가격 움직임을 기반으로 의미 있는 스톱로스 레벨을 자동으로 탐지합니다. 스마트 브레이크아웃 감지 • 빠른 방향 변화나 돌파 상황에서도 불필요한 조기 스톱 조정을 강요하지 않으며 유연하게 반응합
RelicusRoad Pro MT5
Relicus LLC
5 (24)
RelicusRoad Pro: 퀀트 시장 운영 체제 70% 할인 평생 이용권 (한정 시간) - 2,000명 이상의 트레이더와 함께하세요 왜 대부분의 트레이더는 "완벽한" 지표를 가지고도 실패할까요? 진공 상태에서 단일 개념 만으로 거래하기 때문입니다. 문맥 없는 신호는 도박입니다. 지속적인 승리를 위해서는 컨플루언스(중첩) 가 필요합니다. RelicusRoad Pro는 단순한 화살표 지표가 아닙니다. 완전한 퀀트 시장 생태계 입니다. 독점적인 변동성 모델링을 사용하여 가격이 이동하는 "공정 가치 로드"를 매핑하고, 단순 노이즈와 실제 구조적 돌파를 구분합니다. 추측은 그만두세요. 기관급 로드 로직으로 거래를 시작하세요. 핵심 엔진: "Road" 알고리즘 시스템의 중심에는 시장 상황에 실시간으로 적응하는 동적 변동성 채널인 Road Algo 가 있습니다. 세이프 라인(평형) 과 가격이 수학적으로 반전될 가능성이 높은 확장 레벨 을 투영합니다. Simple Road: 일반적인 시장을 위
Trend indicator AI mt5
Ramil Minniakhmetov
5 (14)
트렌드 인공 지능 지표는 실행 가능한 진입 점 및 반전 경고와 추세 식별을 결합하여 상인의 시장 분석을 향상시킬 훌륭한 도구입니다. 이 표시기는 사용자가 자신감과 정밀도로 외환 시장의 복잡성을 탐색 할 수 있도록 지원합니다 기본 신호 외에도 트렌드 인공 지능 지표는 풀백 또는 되돌림 중에 발생하는 2 차 진입 점을 식별하여 거래자가 기존 트렌드 내에서 가격 수정을 활용할 수 있도록합니다. 중요한 장점: ·작동 4 및 5 *명확한 구매 또는 판매 신호 *다시 칠하지 않습니다 *모든 자산에서 작동 나는 전보 사기에 개 또는 세트를 판매하지 않도록주의. 모든 설정은 블로그에 여기에 무료.  중요! 지침 및 보너스를 얻기 위해 구입 후 즉시 저에게 연락! 진짜 가동 감시는 뿐 아니라 나의 다른 제품 여기에서 찾아낼 수 있습니다: https://www.mql5.com/en/users/mechanic/seller&nbsp ; 설정 및 입력: 모든 자산에 대해 기본 설정을 권
Quantum TrendPulse
Bogdan Ion Puscasu
5 (20)
SuperTrend   ,   RSI   ,   Stochastic   의 힘을 하나의 포괄적인 지표로 결합하여 트레이딩 잠재력을 극대화하는 궁극의 트레이딩 도구   인 Quantum TrendPulse를   소개합니다. 정밀성과 효율성을 추구하는 트레이더를 위해 설계된 이 지표는 시장 추세, 모멘텀 변화, 최적의 진입 및 종료 지점을 자신 있게 식별하는 데 도움이 됩니다. 주요 특징: SuperTrend 통합:   주요 시장 추세를 쉽게 따라가고 수익성의 물결을 타세요. RSI 정밀도:   매수 과다 및 매도 과다 수준을 감지하여 시장 반전 시점을 파악하는 데 적합하며 SuperTrend 필터로 사용 가능 확률적 정확도:   변동성이 큰 시장에서 숨겨진 기회를 찾기 위해 확률적 진동   을 활용하고 SuperTrend의 필터로 사용 다중 시간대 분석:   M5부터 H1 또는 H4까지 다양한 시간대에 걸쳐 시장을 최신 상태로 유지하세요. 맞춤형 알림:   맞춤형 거래 조건이 충족되면
Dark Support Resistance  is an Indicator for intraday trading. This Indicator is programmed to identify  Support and Resistance Lines , providing a high level of accuracy and reliability. Key benefits Easily visible lines Only the most important levels will be displayed Automated adjustment for each timeframe and instrument Easy to use even for beginners Never repaints, never backpaints, Not Lag 100% compatible with Expert Advisor development All types of alerts available: Pop-up, Email, Push
TPSproTREND PrO MT5
Roman Podpora
4.74 (19)
TPSproTrend PRO는 시장이 실제로 방향을 바꾸는 순간을 포착하여 움직임의 시작점에서 진입점을 형성합니다. 가격이 움직이기 시작할 때 시장에 진입해야 하며, 이미 가격 변동이 일어난 후에 진입해서는 안 됩니다.   (지표)       신호를 다시 그리지 않고 진입점, 손절매, 이익실현을 자동으로 표시하여 거래를 명확하고 시각적이며 체계적으로 만들어줍니다. 설명서 (러시아어)   -   MT4 버전 주요 장점 신호 재표시 없이 신호가 표시됩니다.   모든 신호는 고정되어 있습니다. 화살표가 나타나면 -       그것은 더 이상 변하거나 사라지지 않을 것입니다. 잘못된 신호의 위험 없이 안정적인 데이터를 기반으로 거래 결정을 내릴 수 있습니다. 바로 사용 가능한 매수/매도 진입점 이 지표는 거래 진입에 가장 적합한 시점을 자동으로 판단하여 차트에 화살표로 표시합니다. 추측이나 주관적인 분석이 아닌, 명확한 신호만 있습니다. 자동 손절매 및 이익실현 영역 신호 직후에 다음
The AX Forex Indicator MT5 is a sophisticated trading tool designed to provide traders with a comprehensive analysis of multiple currency pairs. This   powerful indicator   simplifies the complex nature of the forex market, making it accessible for both novice and experienced traders. AX Forex Indicator uses   advanced algorithms   to detect trends, patterns and is an essential tool for traders aiming to enhance their forex trading performance. With its robust features, ease of use, and reliabl
Weis Wave with Alert MT5
Trade The Volume Waves Single Member P.C.
4.94 (17)
Rental/Lifetime Package Options and Privileges  Rent Monthly Six Months   Yearly/Lifetime Weis Wave with Speed with Alert+Speed Index x x x Manual  x x x Quick Set up Video x x x Blog x x x Lifetime Updates x x x Setup and Training Material x x Discord Access Channel "The SI traders"          x Rectangle Break Alert Tool      x How to trade with it:    http://www.tradethevolumewaves.com   ** If you purchase please contact me to setup your  : Training Room and  complete manual access.  Wei
Advanced Supply Demand MT5
Bernhard Schweigert
4.5 (14)
현재 33% 할인! 초보자나 전문 트레이더를 위한 최고의 솔루션! 이 보조지표는 우리가 다수의 독창적 기능과 새로운 공식을 통합한 독특하고 고품질이며 저렴한 거래 도구입니다. 이 업데이트를 통해 이중 시간대를 표시할 수 있습니다. 더 높은 TF를 표시할 수 있을 뿐만 아니라 차트 TF와 더 높은 TF 모두를 표시할 수 있습니다: 중첩 영역 표시. 모든 Supply Demand 트레이더들이 좋아할 것입니다. :) 중요한 정보 공개 Advanced Supply Demand의 잠재력을 극대화하려면 다음을 방문하십시오. https://www.mql5.com/ko/blogs/post/720245   진입 또는 목표의 명확한 트리거 포인트를 정확히 찾아냄으로 해서 거래가 어떻게 개선될지 상상해 보십시오. 새로운 알고리즘을 기반으로 매수자와 매도자 간의 잠재적인 불균형을 훨씬 더 쉽게 분간할 수 있습니다. 왜냐하면 가장 강한 공급영역과 가장 강한 수요 영역과 과거에 어떻게 진행 되었는지를(이전
El magiciann
Abdelhak Benazizi
EL MAGICIAN – 전문 수요·공급 존 인디케이터 모든 통화쌍에서 고확률의 수요·공급 존을 자동으로 탐지하는 전문 멀티 타임프레임 인디케이터로, 수동 존 그리기의 추측과 주관성을 완전히 제거합니다. EL MAGICIAN이란? EL MAGICIAN 은 기관급 수요·공급 존을 정밀하게 자동 식별하는 프로급 인디케이터입니다. 존 식별의 주관성을 제거하고, 가격이 반응할 가능성이 높은 핵심 레벨을 명확히 보여줍니다. 과거에는 검증된 성과의 무료 인디케이터로 제공되었으며, 현재는 진지한 트레이더를 위한 유료 도구로 제공됩니다. 수동 그리기 vs 자동 감지 수동으로 존을 그리는 방식은 주관적이고 시간이 많이 소요됩니다. 상위 타임프레임의 컨플루언스를 놓치거나, 이미 깨진 존에서 거래하며, 소중한 시간을 낭비하기 쉽습니다. EL MAGICIAN 은 여러 타임프레임을 동시에 분석하는 객관적 알고리즘을 사용하여 신선한 존만 식별하고, 각 존에 1~5성 의 강도 등급을 부여하며, 즉각적인 결과를
ARIScalping
Temirlan Kdyrkhan
ARIScalp is a powerful trading companion designed to generate high-probability entry signals with dynamic TP/SL/DP levels based on volatility. Built-in performance tracking shows win/loss stats, PP1/PP2 hits, and success rates all updated live. Key Features: Buy/Sell signals with adaptive volatility bands Real-time TP/SL/DP levels based on ATR Built-in MA Filter with optional ATR/StdDev volatility Performance stats panel (Success, Profit/Loss, PP1/PP2) Alerts via popup, sound, push, or email Cus
M1 Scalper Pro MT5
Elif Kaya
4.64 (11)
- Real price is 80$ - 45% Discount (It is 45$ now) Contact me for extra bonus   indicator, instruction or any questions! - Lifetime update free - Non-repaint - Related product: Gann Gold EA - I just sell my products in Elif Kaya Profile, any other websites are stolen old versions, So no any new updates or support. Advantages of  M1 Scalper Pro  Profitability: M1 Scalper Pro is highly profitable with a strict exit strategy. Frequent Opportunities: M1 Scalper Pro  takes advantage of numerous smal
Algo Pumping
Ihor Otkydach
4.75 (20)
PUMPING STATION – 당신만을 위한 올인원(All-in-One) 전략 PUMPING STATION은 당신의 외환 거래를 더욱 흥미롭고 효과적으로 바꿔줄 혁신적인 인디케이터입니다. 단순한 보조 도구가 아니라, 강력한 알고리즘을 갖춘 완전한 거래 시스템으로서 보다 안정적인 트레이딩을 시작할 수 있도록 도와줍니다. 이 제품을 구매하시면 다음의 혜택을 무료로 받으실 수 있습니다: 전용 설정 파일: 자동 설정으로 최대의 퍼포먼스를 제공합니다. 단계별 동영상 가이드: PUMPING STATION 전략으로 거래하는 법을 배워보세요. Pumping Utility: PUMPING STATION과 함께 사용하도록 설계된 반자동 거래 봇으로, 거래를 더욱 쉽고 편리하게 만들어줍니다. ※ 구매 후 바로 저에게 메시지를 보내주세요. 추가 자료에 대한 접근 권한을 제공해드립니다. PUMPING STATION은 어떻게 작동하나요? 트렌드 컨트롤: 시장의 추세 방향을 즉시 파악합니다. 추세는 최고의
AW Trend Predictor MT5
AW Trading Software Limited
4.76 (54)
하나의 시스템에서 추세와 고장 수준의 조합입니다. 고급 지표 알고리즘은 시장 노이즈를 필터링하고 추세, 진입점 및 가능한 출구 수준을 결정합니다. 표시기 신호는 통계 모듈에 기록되어 가장 적합한 도구를 선택하여 신호 기록의 효율성을 보여줍니다. 이 표시기는 이익 실현 및 손절매 표시를 계산합니다. 매뉴얼 및 지침 ->   HERE   / MT4 버전 ->   HERE 지표로 거래하는 방법: Trend Predictor로 거래하는 것은 3단계로 간단합니다. 1단계 - 포지션 열기 70% 이상의 성공률로 매수 신호를 받았습니다. 2단계 - StopLoss 결정 반대 신호로 트렁크 선택 3단계 - 이익 실현 전략 정의 전략 1: TP1 도달 시 전체 포지션 청산 전략 2: TP1 도달 시 포지션의 50% 청산 및 TP2 도달 시 나머지 50% 청산 전략 3: 추세 반전 시 전체 포지션 청산 이익: 결과를 다시 그리지 않음, 신호는 엄격하게 양초가 닫힐 때 어드바이저에서 사용할 수 있습니
Break Out Explosion MT5
Hamed Dehgani
5 (2)
심볼: USDCHF, USDJPY, XAUUSD, GBPUSD, EURUSD, AUDUSD, GBPJPY ( 저는 USDCHF_H1을 좋아합니다 ) 시간 프레임: M15, H1, H4, D1 주요 특징: 리페인트 없음, 지연 없음, 방향 신호, 다중 확인 안전성: 신호에는 손절매, 이익실현이 포함되어 있으며, 위험 대비 보상 규칙을 준수함 포함: 무료 멀티 타임프레임 스캐너 (이 제품 구매 후, 개인 메시지로 스크린샷만 보내주시면 제가 직접 스캐너 파일을 보내드립니다.) 완전한 거래 시스템 개념: 기사 읽기 (전체 개념은 이 기사에서 설명됩니다) 제품이 1.5 버전으로 업그레이드되었습니다 (저는 매일 실계좌에서 수동으로 거래하며 이 인디케이터를 계속 개선하고 있습니다) Break Out Explosion의 MT4 버전이 제공됩니다: https://www.mql5.com/en/market/product/155132 1000달러 계좌에서 진행되는 제 실제 거래를 보여주는 라이브
PZ Day Trading MT5
PZ TRADING SLU
2.83 (6)
Effortless trading: non-repainting indicator for accurate price reversals This indicator detects price reversals in a zig-zag fashion, using only price action analysis and a donchian channel. It has been specifically designed for short-term trading, without repainting or backpainting at all. It is a fantastic tool for shrewd traders aiming to increase the timing of their operations. [ Installation Guide | Update Guide | Troubleshooting | FAQ | All Products ] Amazingly easy to trade It provides
제작자의 제품 더 보기
Start Vwap Custom Midas
Ricardo Almeida Branco
5 (3)
Attention: New update - 4 major practicality improvements! 1) Alarm 2) Midas text value 3) Click panel 4) Can be connected to an EA to operate in semi-automatic mode Attention - This indicator does not work perfectly in backtest due to MT5 peculiarities (Reading hotkeys or panel clicks) . My suggestion is that you test Automatic Vwap Midas which has automatic operation to analyze the calculation and then buy Start if you think the indicator will match your operating.     This indicator is use
Display N Bars
Ricardo Almeida Branco
4.88 (8)
The Display N Bars utility is a simple tool designed to help identify candles. If a trader tries to share knowledge with a colleague but it is difficult to pinpoint exactly the desired candle, just say the corresponding candle number. The candle count is reset every day. Seeking to offer a good customization the inputs are: Display type -> Display only odd, only odd, or both candles? Direction -> Horizontal or Vertical? Display multiples of: (display frequency) -> Display all number
FREE
Haos MT5
Ricardo Almeida Branco
5 (1)
The Haos oscillator coded for the MT5! This oscillator allows to verify overbought / oversold regions in two periods (14 and 96, for example), making it possible to anticipate a reversal. Possibility to activate an audible alert when it reaches a defined level. Possibility to choose the alert sound by placing a .wav song in each asset or timeframe. (save a .wav file to the MQL5 \ Files folder) Possibility to activate / deactivate histogram and levels to make the screen cleaner. Customizable col
White Trader Clock
Ricardo Almeida Branco
5 (1)
Simple countdown indicator for the next candle. Only claim is to be light! The indicator inserts a text object to the right of the current price and calculates how much time is left for the new bar, showing this to the trader. Leave your comment if the indicator helped you in any way! If you have any suggestions, let me know to evaluate the improvements. Success and Good Trades!
FREE
Volume Doji
Ricardo Almeida Branco
Hey guys. This indicator will show you, in the volume histogram, if the candle was a Doji, a bullish candle, or a bearish candle. The construction of this indicator was requested by a trader who uses other indicators from my catalog, and I decided to release it free to help traders who think that the indicator can contribute to their operations. The parameters are: Volume Type: Real Volume or Tick Volume. Color if the candle is bearish: select the color. Color if the candle is high: select
FREE
Automatic Vwap Midas
Ricardo Almeida Branco
5 (1)
The 3 Automatic Vwap (Midas) Indicator can be used for Price and Volume studyers to map the movement of market drivers. It automatically plots 3 Vwaps, two of which are dynamic and will be updated throughout the day if new highs or new lows emerge. The third Vwap is daily and can help if the trend is up or down. Also, an auxiliary indicator that plots (also dynamic) points of interest with OHLC prices (Open, High and Low of the current day and Close of the previous day) was inserted. Success and
O HL2 C Lines
Ricardo Almeida Branco
5 (2)
If you consider the extremes of the daily price as important points, this indicator will help in your trades. Now, instead of manually drawing lines that mark daily highs and lows, you can use the O (HL) ² C Lines indicator. Thus, the OHLC Lines indicator automatically plots the lines O (Open for the current day), H (High for the current day), L (Low for the current day) and C (Close for the previous day). Plot also the high and low of the previous day. Thus, we have 4 static lines and tw
PVA Dragon
Ricardo Almeida Branco
Users of PVRSA / PVA certainly already know the Dragon indicator and its use. The Dragon works as dynamic support and resistance and can be used for scalper or trend follower. In addition to the Dragon we have the WGT (fast) and EMA (slow) averages that can show immediate movement and also trend movement. Stay tuned for the Dragon's inclination! The indicator can be used on any asset/currency pair and can be customized according to the trader's interest. See also my volume analysis indicato
PVA Color Candle
Ricardo Almeida Branco
Several techniques use volume as an important point in the trade. Whether to indicate strength, exhaustion, pullback weakness, among others. In chief I quote Richard Wyckoff's theory, which said about the importance of looking price and volume. However, there are several possibilities to filter what is volume that should be noticed. PVRSA/PVA users use an indicator with specific colors, which assist in identifying the volume and type of movement that the price has made. Will the high volume
PVA Color Volume Histograma
Ricardo Almeida Branco
Several techniques use volume as an important point in the trade. Whether to indicate strength, exhaustion, pullback weakness, among others. In chief I quote Richard Wyckoff's theory, which said about the importance of looking price and volume. However, there are several possibilities to filter what is volume that should be noticed. PVRSA/PVA users use an indicator with specific colors, which assist in identifying the volume and type of movement that the price has made. Will the high volume
Color Histogram Volume Set
Ricardo Almeida Branco
Do you use volume in your reading of the market? Certainly many traders use it, and do not imagine operating without it. The Color Histogram Volume Set indicator allows the user to choose the value that he considers interesting to monitor. When you pass this you will have visual confirmation and if you want you will also have the audible alert that is given by the indicator. Of course, there are other ways to try to find a high volume, such as assessing whether the volume is above av
Color Candle Volume Set
Ricardo Almeida Branco
Do you use volume in your reading of the market? Certainly many traders use it, and do not imagine operating without it. The Color Candle Volume Set indicator allows the user to choose the value that he considers interesting to monitor. When you pass this you will have visual confirmation on the price chart and if you want you will also have the audible alert that is given by the indicator. Of course, there are other ways to try to find a high volume, such as assessing whether the vol
WT Vwap Bands
Ricardo Almeida Branco
The WT Vwap Bands indicator is an indicator that combines price and volume, helping to show whether the price is within the "fair price", overbought or oversold. The indicator code was designed for performance and has already been tested in a real trading account. In addition to the visual inputs (color, thickness and line style), the user can define a% value that depends on the price. The default values work with the most distant band at 1% of the price and then dividing this distance in
Fibo Z
Ricardo Almeida Branco
5 (1)
With it, you leave pre-configured two expansion settings and one fibo retraction configuration to use via keyboard shortcut and mouse click. That is, the Fibo_Z utility facilitates the use of MT5's native functions. The shortcut keys are: "Z" configuration 1 of the expansion. "X" expansion setting 2 "Z" retraction configuration. "V" clears objects from the screen. It is. Success and good trades!
Color HLC Bars and Candles
Ricardo Almeida Branco
Want to make the graph cleaner? Don't you use the opening price in your analysis? Want to use a chart model that was used by Richard Wyckoff? Then you need to know the Color HLC Candles and Bars indicator. In the same indicator you can switch to the display of candles or bars. Take a look at the other volume indicators to complement your operating. And don't forget to look at the best Vwap Custom (Midas)! Leave your comment! Success and good trades!
Vwap Freeze
Ricardo Almeida Branco
5 (1)
The previous day's vwap is used by some traders as a support and resistance point, after all it is one of the ways to consider the fair price of that asset or that pair the day before. Possible defenses can occur in this region indicating a reversal, or triggering stops starting a new, more directional movement. It is a matter of analyzing how it will add to your operational. To avoid manually drawing the previous day's vwaps and saving time for your analysis, use the Vwap Freeze indicator, as
Start Display N Bars
Ricardo Almeida Branco
5 (1)
Do you already know Display N Bars? Do you already know the Start tool (from Midas indicators)? In this indicator, we unified the two tools, allowing you to define which candle will start counting, or use the automatic numbering that was already available in the previous version. Description of the utility follows: Display N Bars The Display N Bars utility is a simple tool that aims to help identify candles. If a trader tries to share the knowledge with a colleague but it is difficult t
WT Vwap 5 Bands
Ricardo Almeida Branco
WT Vwap 5 Bands The WT Vwap Bands indicator is an indicator that combines price and volume, helping to show whether the price is within the "fair price", overbought or oversold. The indicator code was designed for performance and has already been tested in a real trading account. In addition to the visual inputs (color, thickness and line style), the user can define a% value that depends on the price. The default values work with the most distant band at 1% of the price and then dividing
WT Candle Color by Volume
Ricardo Almeida Branco
The White's Candle Color indicator (by volume) will color the candles based on the current candle's volume compared to the moving average of the volume. This will allow you to see clearly if the volume (real or tick) is within the normal range, whether it is high or low and bring very important information about the market. I hope that this indicator can help in your operational. Success and good trades!
Initial Balance MT5
Ricardo Almeida Branco
The Initial Balance (Initial Balance / Initial Balance) is a concept related to the study of volume (to learn more, study about Market Profile and Auction Market Theory. You can find some videos in English when searching for "Initial Balance Market Profile"). The IB defines a range in which prices were negotiated in the first hour of trading.The amplitude of the range is important and the break in the range defined by the Initial Balance may have occurred due to the movement of several players
VTC Volatility
Ricardo Almeida Branco
The VTC Volatility indicator was written to support a Brazilian stock market strategy in the WDO (USDBRL), but it can be adapted to other strategies and markets. In the new indicator update, it is now allowed to choose up to 4 levels to determine the range, and thus be more versatile. The Brazilian stock exchange (B3) has the VTC which is a "Structured Exchange Rate Volatility Transaction" (more information on the B3 website). At around 10:00 am, the VTC "Call" comes out and Brazilian broker
White Weis Volume Ticks
Ricardo Almeida Branco
5 (4)
White Weis Volume This indicator shows the sum of the volume in each wave, bulish or bearish, as idealized by David Weis , but it brings an important addition , which is the marking of the bar with the highest volume of the wave (White Bar)! In coding the indicator, it was sought to optimize the code to require minimal processing during use and not to overload mt5. The indicator can be used for pre-trading analysis and study, where the trader analyzes possible points of support and resistance
Vwap Standard Deviation
Ricardo Almeida Branco
O indicador Vwap Deviation Bands segue na mesma linha dos outros indicadores da White Trader, que buscam leveza, personalização e qualidade, para entregar o que há de melhor para o trader. Isto, além de combinar preço e volume (informações importantes para o trader) com uma medida estatística do desvio padrão. Este indicador já foi utilizado e testado por outros traders que deram sugestões, inclusive, para chegarmos nesta versão final (embora ainda esteja aceitando sugestões, sempre :)   ). O de
Midas is the acronym for Market Interpretation / Data Analysis System is a trade approach started in 1995 by technical analyst Paul Levine and later developed by Andrew Coles, PhD and David Hawkins. Learn more in the book MIDAS Technical Analysis: A VWAP Approach to Trading and Investing in Today's Markets , (I saw that it is possible buy via Amazon). The positive points in relation to the Midas-based indicators are the prediction of movement reversal points, the negative point is the subjectivi
Vwap Bands Auto
Ricardo Almeida Branco
The Vwap Bands Auto indicator seeks to automatically map the maximum market frequency ( automatic update of the outermost band ) and has two intermediate bands that also adjust to daily volatility. Another tool from White Trader that combines price and volume, in addition to mapping the daily amplitude. The external band is updated automatically when the daily maximum or minimum breaks the current frequency, and can be an input signal, seeking a return to the daily vwap. Thus, in addition t
Start Midas SD Channel
Ricardo Almeida Branco
5 (1)
Do you already know the Start Midas indicator? What about the Vwap Standard Deviation indicator? And I need to speak again in the book MIDAS Technical Analysis ... The Start Midas SD Channel indicator combines the two in one, bringing the practicality and efficiency of Midas with the statistical calculation of the standard deviation. All of this with the practicality of the White Trader Start indicators, where you can plot the indicator and move them on the screen using keyboard shortcuts
Start Midas Fibo Bands
Ricardo Almeida Branco
Here we have the Start Midas Fibo Bands , I confess that it is an indicator that excited me enough to operate because I was able to find more defined rules. Well, the indicator has the functions of the other indicators of the Start line , which is a possibility to plot several Midas on the screen, you can move the anchor point using keyboard shortcuts and use the legend to differentiate one anchor from another. The rules that I have analyzed for my possible setup are recommended to the entry, st
Prior Lines
Ricardo Almeida Branco
This indicator shows on the current day some lines of interest, such as maximum, minimum and closing of the previous day, as well as the opening, maximum and minimum price of the current day. It can also show the GAP (closing of the previous day and opening of the current day) and projections of the amplitude of the previous day, according to the value you choose in the multiplier. Oh, I was going to forget. It is also possible to determine the time frame, which is daily by default. If this i
Danko Trend Color
Ricardo Almeida Branco
The Danko Trend Color indicator is actually a candle coloring to bring practicality, ease and information to your charts. Danko Trend Color combines PRICE AND VOLUME indicators to define the prevailing trend, so the colors are: Blue (indicates an uptrend) Orange (indicates a downtrend) White (indicates undefined trend) I don't like to promise anything with my indicators, I ask you to download, test it for free (for use in backtesting) and see if the indicator can, in some way, help your oper
Danko DTC Panel
Ricardo Almeida Branco
Do not buy before seeing the Danko Trend Color product, as this panel is a way to view a summary of this indicator on various timeframes. The Danko DTC Panel utility allows you to look at the trend in up to 5 timeframes. When clicking on the timeframe texts, a new window will open with the indicator plotted on the screen so you can see the complete chart. The width of the panel, with the amount of candles you want to see, is customizable, see the images below. Ao clicar nos textos dos timeframe
필터:
Diego Santiago De Meneses Carvalho
593
 

Ótimo indicador.

Ricardo Almeida Branco
9949
개발자의 답변 Ricardo Almeida Branco 2022.05.10 22:51
Obrigado Diego! Espero que tenha ficado como você esperava!
리뷰 답변