KT Coppock Curve MT4

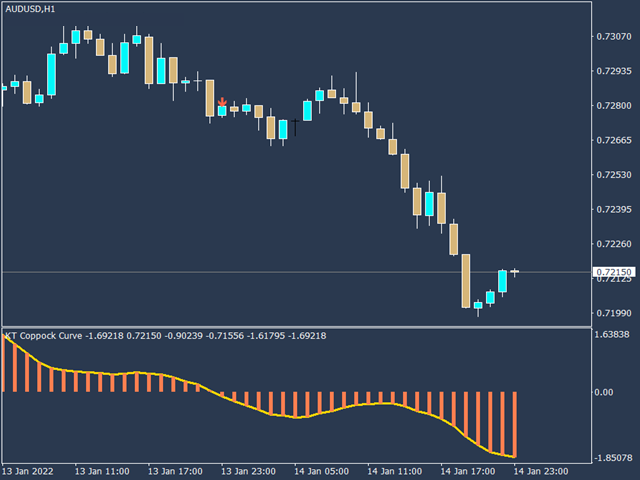
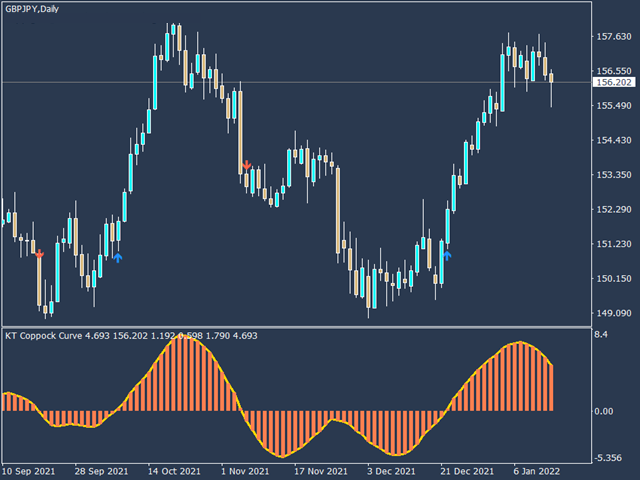
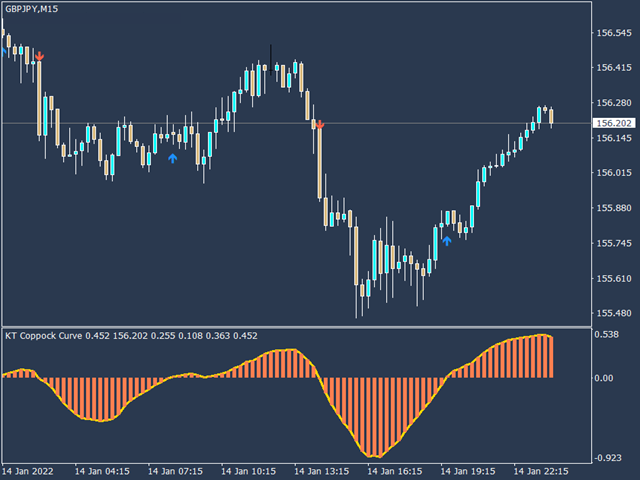
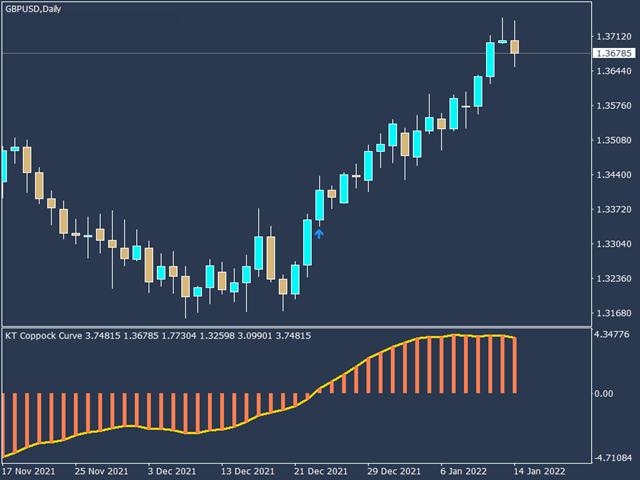
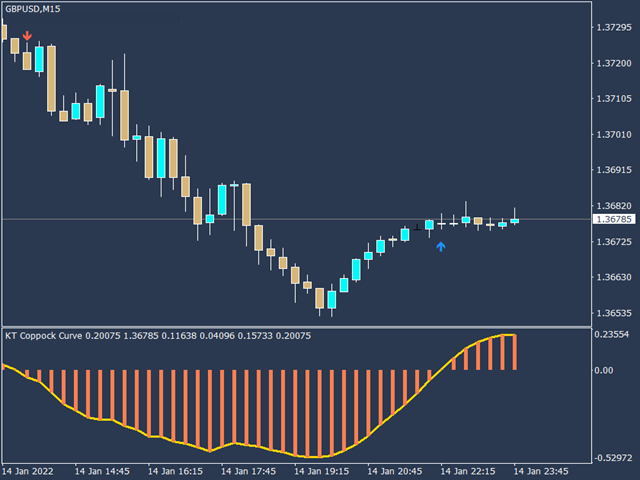
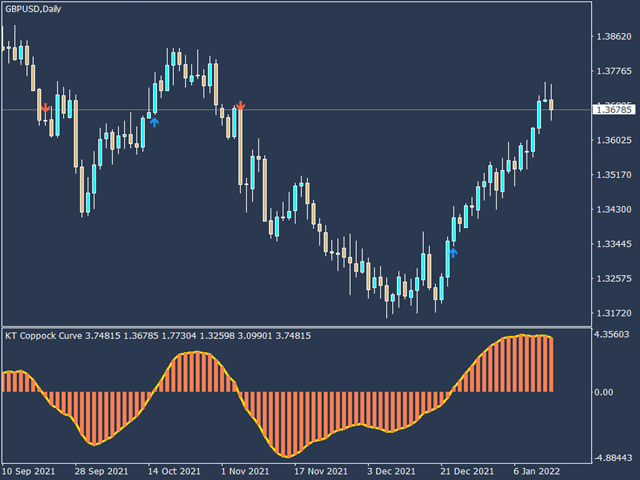
KT Coppock Curve is a modified version of the original Coppock curve published in Barron's Magazine by Edwin Coppock in 1962. The Coppock curve is a price momentum indicator used to identify the market's more prominent up and down movements.

Features

  • It comes with up & down arrows signifying the zero line crossovers in both directions.
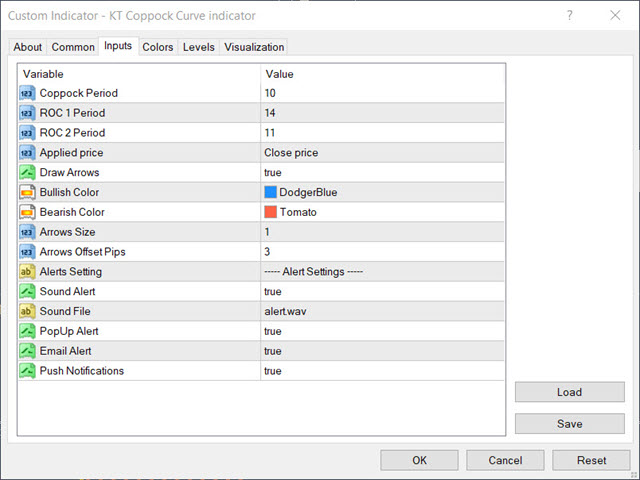
  • It uses a simplified color scheme to represent the Coppock curve in a better way.
  • It comes with all kinds of Metatrader alerts.

Applications

  • It can provide buy/sell signals such as buying when the Coppock curve crosses above zero and selling below zero.
  • One can also hold the stock for long-term stocks trading as long as the Coppock curve is above the zero line.
  • One can also use it to filter out the low probability trades by going long only if the Coppock curve is above zero and going short only if it's below zero.

Coppock Formula

The Coppock curve is based on the following mathematical equation:

Coppock Curve = 10-period weighted moving average of (14-period ROC + 11-period ROC)

추천 제품
Wise Men Indicator demo
Bohdan Kasyanenko
3 (2)
The indicator displays signals according to the strategy of Bill Williams on the chart. Demo version of the indicator has the same features as the paid, except that it can work only on a demo account . Signal "First Wise Man" is formed when there is a divergent bar with angulation.  Bullish divergent bar - with lower minimum and closing price in the upper half. Bearish divergent bar - higher maximum and the closing price at the bottom half. Angulation is formed when all three lines of Alligator
FREE
SMA Indicator
Nitu Brijesh Yadav
Arrow Indicator (Buy/Sell Alerts) – Simple Yet Powerful Tool!             Product Version: 1.01           Indicator Type: Trend Reversal Signals           Timeframes Supported: All (Recommended: H1, H4, D1)           Key Features: Buy Signal: Green upward arrow () appears below the candle  Sell Signal : Red downward arrow () appears above the candle Accurate Trend Reversal Detection – Based on tried and tested SMA strategy. ️ Clean Chart View – Minimalist, non-i
FREE
Free automatic fibonacci
Tonny Obare
4.67 (49)
Free automatic Fibonacci is an indicator that automatically plots a Fibonacci retracement based on the number of bars you select on the BarsToScan setting in the indicator. The Fibonacci is automatically updated in real time as new highest and lowest values appears amongst the selected bars. You can select which level values to be displayed in the indicator settings. You can also select the color of the levels thus enabling the trader to be able to attach the indicator several times with differe
FREE
UPD1 Rsi Dots Dashboard
Vitaliy Kuznetsov
5 (2)
이 표시기는 차트의 터미널 오실레이터를 기반으로 신호를 표시합니다. 반복되는 신호를 필터링 할 수 있습니다. 여기서 오실레이터는 역 신호를 검색하는 데 사용됩니다. 스윙 전략 및 거래 수준에서 진입 점으로 권장 됩니다. 다중 통화 대시 보드를 사용할 수 있습니다. 그것으로,당신은 쉽게 차트 사이를 전환 할 수 있습니다. 제품 토론에서 대시보드를 포함할 수 있는 알고리즘을 제안할 수 있습니다. 입력 매개변수. 기본 설정. Bars Count – 표시기가 작동하는 히스토리 바의 수. RSI Period – 발진기 기간. RSI Level – 발진기의 레벨. 오실레이터는 0 에서 100 사이입니다. 당신이 10 를 선정하는 경우에,신호는 10 의 위 그리고 90 이하 일 것입니다. RSI Applied Price. Repeat Signal - 반복 신호. Enable – 모든 반복 신호는 화살표/아이콘이 될 것입니다. No Signal – 반복되는 모든 것들은 무시됩니다. 시각
FREE
WAD Stoch
Yonny Pascal Ekwa Mezui
WAD Divergence + Stochastic Overview WAD Divergence + Stochastic is a technical indicator designed to assist traders in identifying potential market turning points. It combines price behavior with momentum confirmation to highlight areas where buying or selling pressure may be shifting. The indicator works directly on the chart and provides clear visual signals to support decision-making in fast-moving markets. How It Works The indicator analyzes the relationship between price movement and inte
FREE
This indicator is a perfect tool able to compare which brokers have the lower latency. It shows us immediately which brokers are slower or faster. When you see the dot icon on the line, it means this broker is the faster one and the red line (Broker_A) is the slower one. See the example on the screenshot. How It Works? This indicator shares the prices information to and from the "shared" common data folder. It compares all the prices. The price is based on average by (Ask + Bid) / 2. There are
FREE
Auto Supply and Demand Oscillator is an indicator for MetaTrader 4 and MetaTrader 5 that detects supply and demand zones automatically and displays them as a single oscillator value at the bottom of the chart, instead of drawing rectangles directly on price. Concept Supply zones are price areas where strong selling created a sharp downward move away from a balance area. Demand zones are price areas where strong buying created a sharp upward move. Traditional implementations draw boxes on the
FREE
Follow The Line
Oliver Gideon Amofa Appiah
3.94 (16)
FOLLOW THE LINE GET THE FULL VERSION HERE: https://www.mql5.com/en/market/product/36024 This indicator obeys the popular maxim that: "THE TREND IS YOUR FRIEND" It paints a GREEN line for BUY and also paints a RED line for SELL.  It gives alarms and alerts of all kinds. IT DOES NOT REPAINT and can be used for all currency pairs and timeframes. Yes, as easy and simple as that. Even a newbie can use it to make great and reliable trades. NB: For best results, get my other premium indicators for more
FREE
SuperTrend MT4
KEENBASE SOFTWARE SOLUTIONS
KT SuperTrend is a modified version of the classic SuperTrend indicator with new useful features. Whether its Equities, Futures, and Forex, the beginners' traders widely use the Supertrend indicator.  Buy Signal: When price close above the supertrend line. Sell Signal: When price close below the supertrend line. Features A multi-featured SuperTrend coded from scratch. Equipped with a multi-timeframe scanner. The last signal direction and entry price showed on the chart. All kinds of MetaTrader
FREE
Email Drawdown Alert
Roman Starostin
5 (12)
Free informative Indicator-helper. It'll be usefull for traders who trade many symbols or using grid systems (Averaging or Martingale). Indicator counts drawdown as percent and currency separate. It has a number of settings: Count deposite drawdown according equity value and send e-mail or notifications to user if DD more than set; Sending e-mail when max open orders reached; Shows price and remaining pips amount before MarginCall on current chart and Account generally; Display summary trade lot
FREE
Super Auto Fibonacci
Muhammed Emin Ugur
Discover the power of precision and efficiency in your trading with the " Super Auto Fibonacci " MT4 indicator. This cutting-edge tool is meticulously designed to enhance your technical analysis, providing you with invaluable insights to make informed trading decisions. Key Features: Automated Fibonacci Analysis: Say goodbye to the hassle of manual Fibonacci retracement and extension drawing. "Super Auto Fibonacci" instantly identifies and plots Fibonacci levels on your MT4 chart, saving you tim
FREE
Trendline indicator
David Muriithi
2 (1)
Are you tired of drawing trendlines every time you're analyzing charts? Or perhaps you would like more consistency in your technical analysis. Then this is for you. This indicator will draw trend lines automatically when dropped on a chart. How it works Works similar to standard deviation channel found on mt4 and mt5. It has 2 parameters: 1. Starting Bar 2. Number of bars for calculation The   starting bar   is the bar which drawing of the trend lines will begin, while the   number of bars for c
FREE
Pip Counter MT4
KEENBASE SOFTWARE SOLUTIONS
KT Pip Counter 는 실시간으로 핵심 데이터를 표시해 주는 간단하면서도 유용한 지표입니다. 수익·손실, 스프레드, 잔여 시간 같은 정보를 한눈에 파악할 수 있어, 급변하는 장세에서도 침착하게 대응하고 의사결정 속도를 높일 수 있습니다. 특징 현재 손익을 통화, 핍, 퍼센트로 동시에 표시. 실시간 스프레드를 표시.  현재 캔들이 마감될 때까지 남은 시간을 알려줌. 손익 상황에 따라 색상을 자동 변경. 텍스트 위치와 레이아웃을 자유롭게 설정 가능.  CPU 사용량이 매우 낮아 플랫폼이 느려지지 않음. 입력값 Account P&L:   true이면 계좌 전체 손익, false이면 현재 종목 손익만 표시. 색상 및 글꼴 크기 설정. Show After Current Bar: true이면 캔들 종료 후 정보 표시, 아니면 차트 구석에 고정. 나머지 입력값은 직관적으로 이해 가능.
FREE
OrderBlock TS Roman
Vladislav Vlastovskii
3.8 (5)
Индикатор строит блоки заказов (БЗ) по торговой системе (ТС) Романа. Поиск блоков осуществляется одновременно на двух таймфремах: текущем и старшем (определяемым в настройках). Для оптимизации и игнорирования устаревших блоков в настройках задается ограничение количества дней в пределах которых осуществляется поиск блоков. Блоки строятся по правилам ТС состоящем из трех шагов: какую свечу вынесли (что?); какой свечой вынесли (чем?); правило отрисовки (как?).
FREE
PPR and Engulfing
Yury Emeliyanov
5 (3)
PPR 및 Engulfing 은 MetaTrader 4 (MT4) 거래 플랫폼의 통화 차트에서 "PPR" 및 "Engulfing" 패턴을 식별하도록 설계된 독특한 기술 지표입니다. 이러한 패턴은 잠재적인 추세 반전 또는 지속을 나타낼 수 있으며, 트레이더에게 시장 진입 및 퇴출을 위한 귀중한 신호를 제공합니다. 주요 특징: 자동 패턴 감지 : 지표는 PPR 및 Engulfing 패턴을 자동으로 식별하고 차트에 화살표로 표시합니다. 시각적 신호 : 녹색 위쪽 화살표는 매수 지점을 나타내고, 빨간색 아래쪽 화살표는 매도 지점을 나타냅니다. 사용자 정의 가능한 화살표 색상 : 사용자는 지표 설정을 통해 강세 및 약세 신호의 화살표 색상을 선택할 수 있습니다. 모드 선택 : 세 가지 작동 모드 – PPR만, Engulfing만, 또는 두 패턴을 동시에 분석합니다. 사용 방법: 차트에 추가 : 지표를 원하는 통화 쌍 또는 금융 상품의 차트에 적용합니다. 신호 분석 : 차트에서 화살표의 출현을
FREE
Extremum Reverse Bar
Yurij Izyumov
2.8 (5)
This indicator has been created for finding the probable reversal points of the symbol price. A small candlestick reversal pattern is used it its operation in conjunction with a filter of extremums. The indicator is not redrawn! If the extremum filter is disabled, the indicator shows all points that have a pattern. If the extremum filter is enabled, the condition works – if the history Previous bars 1 candles back contains higher candles and they are farther than the Previous bars 2 candle, such
FREE
PZ Penta O MT4
PZ TRADING SLU
2.33 (3)
The Penta-O is a 6-point retracement harmonacci pattern which usually precedes big market movements. Penta-O patterns can expand and repaint quite a bit. To make things easier this indicator implements a twist: it waits for a donchian breakout in the right direction before signaling the trade. The end result is an otherwise repainting indicator with a very reliable trading signal. The donchian breakout period is entered as an input. [ Installation Guide | Update Guide | Troubleshooting | FAQ | A
FREE
Trend Mate
ANGEL CALLE CRUZ
1 (1)
TREND MATE is an useful indicator that will support your decision to trade according to the current trend. It is possible to configure alert and push notification to receive when entering to first candle for bull / bear trend. If you want to use this indicator for a EA, use the function iCustom as follows: DOWNTREND : iCustom(NULL,0,"Trend_Mate",0,0) . If downtrend result is "1", otherwise is "0". UPTREND : iCustom(NULL,0,"Trend_Mate",1,0) . If uptrend result is "1", otherwise is "0". For an
FREE
The indicator identifies when a divergence occurs between price and an indicator or oscillator. It identifies bullish and bearish hidden or regular (classical) divergences. Combined with your own rules and techniques, this indicator will allow you to create (or enhance) your own powerful system. For higher probability setups I can recommend you to use my  Supply Demand indicator  and trade only if the divergence occurs inside a zone. Supply zone for bearish div and demand zone for bullish div. T
FREE
Rainbow MT4
Jamal El Alama
Rainbow MT4 is a technical indicator based on Moving average with period 34 and very easy to use. When price crosses above MA and MA changes color to green, it’s a signal to buy. When price crosses below MA and MA changes color to red, it’s a signal to sell. The Expert advisor ( Rainbow EA MT4) based on Rainbow MT4 indicator, as you can see in the short video below is now available here .
FREE
AUD INDEX The Currency Index Project is ONE part of a thorough Forex study. Many people do not know the theoretical basis that drives currency exchange rates to move on the market. With this set of tools you will be able to have a more complete view of the entire market by analyzing not only the single currency of an exchange, but all the exchange rates that make up that currency by looking at a single window! The indicator faithfully represents the real index of a single currency present in a
FREE
The Day Scalping System
Anton Iudakov
3 (5)
Scalping indicator. It takes into account volatility, price movement in the local interval and the direction of the current trend. Recommended timeframe - M5. Advantages: Low volatility when a signal appears ensures minimal movement against an open position. The indicator does not redraw its signals. There are alert signals. It is a great tool for day trading. Settings: Name Description Period Indicator period Range of each bar in the period (pp.) The maximum size of each candle in the indicato
FREE
QualifiedEngulfing
Ashkan Hazegh Nikrou
QualifiedEngulfing - ProEngulfing 지표의 무료 버전입니다. ProEngulfing - Advance Engulf 지표의 유료 버전으로, 여기에서 다운로드할 수 있습니다. ProEngulfing 의 무료 버전과 유료 버전의 차이점은 무엇인가요? 무료 버전은 하루에 하나의 신호로 제한되어 있습니다. QualifiedEngulfing을 소개합니다 - MT4용 전문 Engulf 패턴 지표 QualifiedEngulfing을 사용하여 외환 시장에서 자격을 갖춘 Engulf 패턴을 식별하고 강조하는 혁신적인 지표로 정밀력의 힘을 발휘하세요. MetaTrader 4용으로 개발된 QualifiedEngulfing은 Engulf 패턴을 정확하게 인식하고 강조하기 위한 첨단 접근법을 제공하여 거래 결정에 대해 가장 신뢰할 수 있는 신호만을 제공합니다. QualifiedEngulfing 작동 방식: QualifiedEngulfing은 Engulf 패턴을 분석하기 위한 정교한
FREE
Traditional MACD MT4
Daniel Lewis
4.58 (55)
MACD indicator in MetaTrader 4/5 looks different than MACD does in most other charting software. That is because the MetaTrader 4/5 version of MACD displays the MACD line as a histogram when it is traditionally displayed as a line. Additionally, the MetaTrader 4/5 version computes the Signal line using an SMA, while according to MACD definition it is supposed to be an EMA. The MetaTrader 4/5 version also does not compute a true MACD Histogram (the difference between the MACD/Signal lines). This
FREE
Candle Countdown — MT4용 정확한 캔들 종료 시간 카운트다운 Candle Countdown은 차트 위에 현재 캔들이 종료될 때까지 남은 시간 을 표시하는 간단하고 정확한 도구입니다. 진입 시점이 캔들 마감에 의존하는 경우, 몇 초의 차이도 중요합니다. 이 인디케이터는 정확한 시간을 보여주어 서두르거나 추측하지 않고 결정을 내릴 수 있도록 도와줍니다. 캔들 종료 시간을 정확하게 제어하기 위한 인디케이터입니다. 표시 내용: 캔들 종료까지 남은 시간 현재 서버 시간 스프레드 Stop Level 타이머는 틱에 의존하지 않고 플랫폼의 내부 타이머를 통해 업데이트되므로, 시장 움직임이 적은 상황에서도 안정적으로 동작합니다. 이로 인해 낮은 변동성 구간에서도 부드럽고 안정적인 카운트다운을 제공합니다. 모든 정보는 배경 블록에 표시되어 어떤 차트 색상에서도 잘 보이며, 차트 분석을 방해하지 않습니다. 캔들 종료 시점이 가까워질수록 타이머 색상이 변경되어 빠르게 상황을 파악할 수
FREE
ZigZag Support Resistance MT4
Emmanuel Tshepang Mosweu
4.67 (3)
This indicator uses the Zigzag indicator to identify swing highs and swing lows in the price chart.    Once it has identified the swing highs and swing lows, it can use them to determine potential support and resistance levels. A support level is formed when the price drops and bounces back up from a swing low, indicating that there is buying pressure at that level. A resistance level is formed when the price rises and reverses downward from a swing high, suggesting selling pressure at that leve
FREE
하모닉 패턴은 시장 반전점을 예측하는 데 가장 적합합니다. 이러한 패턴은 높은 승률과 하루 동안 다양한 거래 기회를 제공합니다. 저희 인디케이터는 하모닉 트레이딩 문헌에 기반하여 가장 인기 있는 하모닉 패턴을 식별합니다. 중요 사항: 이 인디케이터는 다시 그리지 않으며 (D 지점에서 패턴을 감지함), 따라잡지 않습니다 (패턴이 유효하거나 취소됨). 사용 방법: MT5 차트에 인디케이터를 끌어다 놓으세요. 패턴 감지를 TRUE로 설정하세요 (ABCD; Gartley). 원하는대로 편차를 조정하세요 (높은 편차는 더 많은 패턴, 낮은 편차는 더 적은 패턴). 색상을 원하는 대로 사용자 정의하세요. 필요에 따라 ENTRY POINT, TP 및 SL에 대한 경고를 활성화하거나 비활성화하세요. 패턴 감지 시: 알고리즘은 D 지점에서 패턴을 감지합니다. 경고가 활성화되어 있으면 패턴 감지에 대한 알림을 보냅니다. 패턴이 무효화되면 "패턴 취소"라는 메시지가 포함된 경고가 트리거됩니다. 성공적인
FREE
The   OHLC indicator   shows the current and historical values of High, Low, Open, Close and Mid for a specific time period. It can plot the current values or the values from the previous session. The indicator's range can be calculated from a daily, weekly, monthly, or user-specified session. Levels High  of the current or previous session. Low  of the current or previous session. Open  of current or previous session. Close  of the current or previous session. Midpoint  of the current or prev
FREE
Check my paid tools they work great and I share Ea's based on them for free please r ate The Dual Timeframe RSI (Relative Strength Index) indicator is a novel trading tool that allows traders to monitor RSI readings from two different timeframes on a single chart. This dual perspective enables traders to identify potential trend confirmations and divergences more effectively. For instance, a trader might use a 1-hour RSI alongside a daily RSI to ensure that short-term trades align with the broa
FREE
WH Price Wave Pattern MT4
Wissam Hussein
4.4 (5)
Welcome to our   Price Wave Pattern   MT4 --(ABCD Pattern)-- The ABCD pattern is a powerful and widely used trading pattern in the world of technical analysis. It is a harmonic price pattern that traders use to identify potential buy and sell opportunities in the market. With the ABCD pattern, traders can anticipate potential price movements and make informed decisions on when to enter and exit trades. Send me a  Message and Get A Free Gift : ABCD  Symbol Scanner Dashboard! EA Version : Price
FREE
이 제품의 구매자들이 또한 구매함
Neuro Poseidon MT4
Daria Rezueva
4.95 (41)
Neuro Poseidon is a new indicator by Daria Rezueva. It combines precise trading signals with adaptive TP/SL levels - creating best possible trades as a result! Message me and get  Neuro Poseidon Assistant  as a gift to automize your trading process! What makes it stand out? 1. Proven profitability on all assets and timeframes 2. Only confirmed BUY and SELL signals present on the chart 3. Adaptive TP & SL levels generated by the software for each trade 4. Easy to understand - suitable for all
Gann Made Easy
Oleg Rodin
4.84 (166)
Gann Made Easy 는 mr.의 이론을 사용하여 최고의 거래 원칙을 기반으로 하는 전문적이고 사용하기 쉬운 Forex 거래 시스템입니다. W.D. 간. 이 표시기는 Stop Loss 및 Take Profit Levels를 포함하여 정확한 BUY 및 SELL 신호를 제공합니다. PUSH 알림을 사용하여 이동 중에도 거래할 수 있습니다. 구매 후 거래 방법 안내 및 유용한 추가 지표를 무료로 받으시려면 저에게 연락주세요! 아마도 Gann 거래 방법에 대해 이미 여러 번 들었을 것입니다. 일반적으로 Gann의 이론은 초보자 거래자뿐만 아니라 이미 거래 경험이 있는 사람들에게도 매우 복잡한 것입니다. Gann의 거래 방식은 이론적으로 적용하기 쉽지 않기 때문입니다. 나는 그 지식을 연마하고 Forex 지표에 최고의 원칙을 적용하기 위해 몇 년을 보냈습니다. 표시기는 적용하기가 매우 쉽습니다. 차트에 첨부하고 간단한 거래 권장 사항을 따르기만 하면 됩니다. 지표는 지속적으로 시장 분석
M1 Sniper
Oleg Rodin
5 (24)
M1 SNIPER 는 사용하기 쉬운 거래 지표 시스템입니다. M1 시간대에 맞춰 설계된 화살표 지표입니다. 이 지표는 M1 시간대 스캘핑을 위한 단독 시스템으로 사용할 수 있으며, 기존 거래 시스템의 일부로도 사용할 수 있습니다. 이 거래 시스템은 M1 시간대 거래용으로 특별히 설계되었지만, 다른 시간대에도 사용할 수 있습니다. 원래는 XAUUSD와 BTCUSD 거래를 위해 이 방법을 설계했지만, 다른 시장 거래에도 유용하다는 것을 알게 되었습니다. 이 지표의 신호는 추세 방향과 반대로 거래될 수 있습니다. 저는 지표의 신호를 활용하여 양방향으로 거래할 수 있도록 돕는 특별한 거래 기법을 알려드립니다. 이 방법은 특별한 동적 지지선과 저항선 가격 영역을 활용하는 것을 기반으로 합니다. 구매하시면 M1 SNIPER 화살표 지표를 바로 다운로드하실 수 있습니다. 또한, 아래 스크린샷에 표시된 Apollo Dynamic SR 지표는 M1 SNIPER 도구를 사용하는 모든 사용자에게 무료로
Prop Firm Sniper
Mohamed Hassan
5 (1)
Prop Firm Sniper MT4  is a professional market structure indicator that automatically identifies high-probability BUY and SELL opportunities using BOS and CHoCH analysis. Recommended Timeframes: For backtesting, use the indicator on   M5 or M15   for Gold (XAUUSD), and   M15 or H1   for more volatile Forex pairs such as   GBPUSD, USDJPY, EURGBP , and similar markets. CONTACT ME AFTER PURCHASE TO CLAIM YOUR FREE BONUSES! Prop Firm Sniper  is a professional market structure indicator designed t
ORB Seeker
Marcela Goncalves De Oliveira
특별 출시 가격! 단돈 59달러! 10개 판매 후 가격이 인상되어 최종 가격은 199달러가 됩니다. 구매 후 연락 주시면 완전 자동화되고 최적화된 설정 파일을 사용하여 돌파 신호를 거래할 수 있는 무료 보너스 EA를 드립니다. 깔끔한 세션 브레이크아웃을 자신감 있게 활용하세요! ORB Seeker는 정확성, 단순성, 유연성 및 명확한 차트 구조를 원하는 트레이더를 위해 개발된 전문적인 시가 범위 돌파(ORB) 지표입니다. 이 프로그램은 모든 금융 상품에 대해 장전 거래 또는 사용자 지정 세션 범위를 자동으로 표시하고, 진입, 손절매, 목표 수익 및 선택적으로 50% 부분 목표 수익 수준을 포함한 명확한 돌파 신호를 제공합니다. 모든 계산은 실시간으로 차트에 직접 표시됩니다. 런던 개장, 뉴욕 세션, 아시아 세션 또는 사용자 지정 시장 시간대를 선택하여 거래하세요. ORB Seeker는 사용자가 선택한 세션 시간에 맞춰 작동하므로 시장 범위, 돌파 수준 및 거래 레벨을 정확하게 확
Trend Catcher ind
Ramil Minniakhmetov
5 (9)
트렌드 캐처 인디케이터 트렌드 캐처 인디케이터는 개발자가 자체 개발한 맞춤형 적응형 트렌드 분석 지표들을 조합하여 시장 가격 움직임을 분석합니다. 단기적인 노이즈를 제거하고 근본적인 모멘텀 강도, 변동성 확대, 가격 구조 움직임에 집중하여 진정한 시장 방향을 파악합니다. 또한 이동 평균, RSI, 변동성 필터와 같은 맞춤형 지표들을 활용하여 가격을 평활화하고 트렌드를 필터링합니다. 실제 운영 모니터링 및 기타 제품은 다음 링크에서 확인하실 수 있습니다: https://www.mql5.com/en/users/mechanic/seller 텔레그램에서는 EA나 설정 파일을 판매하지 않습니다. 사기이니 주의하세요. 모든 설정 파일은 블로그에서 무료로 제공됩니다. 중요! 구매 후 즉시 연락 주시면 사용 방법 및 보너스를 드립니다!
Smart Trend Trading System
Issam Kassas
4.33 (3)
이 제품은 2026년 시장에 맞게 업데이트되었으며 최신 MT5 빌드에 최적화되었습니다. 가격 업데이트 안내: Smart Trend Trading System은 현재 $99 에 제공됩니다. 다음 30회 구매 후 가격은 $199 로 인상됩니다. 특별 혜택: Smart Trend Trading System 구매 후 저에게 개인 메시지를 보내시면 Smart Universal EA를 무료 로 받을 수 있으며, Smart Trend 신호를 자동 거래로 전환할 수 있습니다. Smart Trend Trading System은 리페인트 없음, 재그리기 없음, 지연 없음의 완전한 트레이딩 시스템으로, 더 깨끗한 신호, 더 나은 추세 방향, 그리고 더 체계적인 시장 거래 방식을 원하는 트레이더를 위해 제작되었습니다. Online course , manual and [download presets] . 이 시스템은 추세 감지, 반전 구간, Smart Cloud, 트레일링 스톱 로직, 지지와 저항, 캔들
Advanced Currency Strength28 Indicator
Bernhard Schweigert
4.91 (657)
현재 40% 할인 초보자 또는 전문가 트레이더를 위한 최고의 솔루션! 이 지표는 우리가 독점 기능과 새로운 공식을 통합했기 때문에 독특하고 고품질이며 저렴한 거래 도구입니다. 단 하나의 차트로 28 Forex 쌍의 통화 강도를 읽을 수 있습니다! 새로운 추세 또는 스캘핑 기회의 정확한 트리거 포인트를 정확히 찾아낼 수 있기 때문에 거래가 어떻게 개선될지 상상해 보십시오. 사용 설명서: 여기를 클릭  https://www.mql5.com/en/blogs/post/697384 그것이 첫 번째, 원본입니다! 쓸모없는 지망생 클론을 사지 마십시오. 더 스페셜  강력한 통화 모멘텀을 보여주는 하위 창의 화살표 GAP가 거래를 안내합니다! 기본 또는 호가 통화가 과매도/과매도 영역(외부 시장 피보나치 수준)에 있을 때 개별 차트의 기본 창에 경고 표시가 나타납니다. 통화 강도가 외부 범위에서 떨어질 때 풀백/반전 경고. 교차 패턴의 특별 경고 추세를 빠르게 볼 수 있는 다중 시간
Dynamic Forex28 Navigator
Bernhard Schweigert
4.43 (7)
Dynamic Forex28 Navigator - 차세대 외환 거래 도구. 현재 49% 할인. Dynamic Forex28 Navigator는 오랫동안 인기 있는 지표의 진화형으로, 세 가지의 힘을 하나로 결합했습니다. 고급 통화 Strength28 지표(695개 리뷰) + 고급 통화 IMPULSE with ALERT(520개 리뷰) + CS28 콤보 신호(보너스). 지표에 대한 자세한 정보 https://www.mql5.com/en/blogs/post/758844 차세대 Strength 지표는 무엇을 제공합니까?  원래 지표에서 좋아했던 모든 것이 새로운 기능과 더 높은 정확도로 강화되었습니다. 주요 기능: 독점적인 통화 Strength 공식.  모든 시간대에 걸쳐 부드럽고 정확한 강도선. 추세와 정확한 진입을 식별하는 데 이상적입니다. 역동적인 시장 피보나치 수준(시장 피보나치).  이 지표에만 있는 고유한 기능. 가격 차트가 아닌 통화 강도에 피보나치가 적용됩니다.
Miraculous Indicator – Gann Square of Nine 기반 100% 비리페인트 Forex 및 바이너리 도구 이 영상은 Miraculous Indicator 를 소개합니다. 이 지표는 Forex 및 바이너리 옵션 트레이더를 위해 특별히 개발된 매우 정확하고 강력한 트레이딩 도구입니다. 이 지표가 독특한 이유는 전설적인 **Gann Square of Nine(Gann 9의 사각형)**과 **Gann's Law of Vibration(Gann 진동의 법칙)**에 기반을 두고 있기 때문입니다. 이는 현대 트레이딩에서 가장 정밀한 예측 도구 중 하나로 손꼽힙니다. Miraculous Indicator는 완전히 비리페인트(non-repaint) 됩니다. 즉, 캔들이 마감된 후에도 신호가 변경되거나 사라지지 않습니다. 보이는 것이 곧 결과입니다. 이는 트레이더가 자신감을 가지고 거래에 진입하고 청산할 수 있는 신뢰할 수 있고 일관된 기반을 제공합니다. 주요 특징: Gann
PRO Renko System
Oleg Rodin
5 (30)
PRO Renko System 은 RENKO 차트 거래를 위해 특별히 고안된 매우 정확한 거래 시스템입니다. 이것은 다양한 거래 상품에 적용될 수있는 보편적 인 시스템입니다. 체계는 효과적으로 당신에게 정확한 반전 신호에 접근을 주는 소위 시장 소음을 중화합니다. 이 표시기는 사용하기가 매우 쉽고 신호 생성을 담당하는 매개 변수가 하나만 있습니다. 당신은 쉽게 당신의 선택의 어떤 무역 계기에 공구를 적응시킬 수 있고 renko 막대기의 크기. 나는 항상 당신이 내 소프트웨어로 수익성있게 거래 할 수 있도록 추가 지원을 제공 할 준비가되어 있습니다! 나는 당신에게 행복하고 수익성있는 거래를 기원합니다! 구매 후 저에게 연락하십시오! 내 렌코 차트 생성기를 보내드립니다. 또한 내 개인 권장 사항 및 시스템의 다른 모듈을 무료로 공유 할 것입니다!
BTMM State Engine Pro MT4
Garry James Goodchild
BTMM State Engine Pro is a MetaTrader 4 indicator for traders who use the Beat The Market Maker approach: Asian session context, kill zone timing, level progression, peak formation detection, and a multi-pair scanner from a single chart. It combines cycle state logic with a built-in scanner dashboard so you do not need the same tool on many charts at once. What it does Draws the Asian session range; session times can follow broker server offset or be set in inputs. Tracks level progression (L
Neo Wave PRO
Nikolay Raykov
5 (1)
Price & Time Market Structure Indicator A professional market structure tool that analyzes waves through both price and time — not price alone. Main Description NeoWave PRO is a professional market structure indicator for MetaTrader 4 designed for traders who want to move beyond traditional one-dimensional wave tools such as ZigZag, swing indicators, and basic high/low systems. Most wave indicators analyze only one thing: Price. But a real market wave is not only a price movement. A true wave de
Scalper Inside PRO
Alexey Minkov
4.68 (69)
Scalper Inside PRO Scalper Inside PRO is an intraday trend and scalping indicator that uses exclusive built-in algorithms to evaluate market direction and key target levels. The indicator automatically calculates entry and exit points and several profit target levels, and it shows detailed performance statistics, so you can see how different instruments and strategies behaved on historical data. This helps you select instruments that fit current market conditions. You can also connect your own a
PZ Trend Trading
PZ TRADING SLU
4.8 (5)
Capture every opportunity: your go-to indicator for profitable trend trading Trend Trading is an indicator designed to profit as much as possible from trends taking place in the market, by timing pullbacks and breakouts. It finds trading opportunities by analyzing what the price is doing during established trends. [ Installation Guide | Update Guide | Troubleshooting | FAQ | All Products ] Trade financial markets with confidence and efficiency Profit from established trends without getting whips
Atomic Analyst
Issam Kassas
5 (8)
이 제품은 2026년 시장에 맞게 업데이트되었으며 최신 MT5 빌드에 최적화되었습니다. 가격 업데이트 안내: Atomic Analyst는 현재 $99 에 제공됩니다. 다음 30회 구매 후 가격은 $199 로 인상됩니다. 특별 혜택: Atomic Analyst 구매 후 저에게 개인 메시지를 보내시면 Smart Universal EA를 무료 로 받을 수 있으며, Atomic Analyst 신호를 자동 거래로 전환할 수 있습니다. Atomic Analyst는 리페인트 없음, 재그리기 없음, 지연 없음의 Price Action 거래 인디케이터로, 수동 거래, 신호 명확성, EA 자동화를 위해 설계되었습니다. User manual: settings, inputs and strategy.     &   User Manual PDF . 가격 움직임, 강도, 모멘텀, 다중 시간대 방향 및 고급 필터를 분석하여 트레이더가 노이즈를 줄이고 약한 세팅을 피하며 더 체계적인 거래 결정을 내릴 수 있도
CRT Candle Range Theory HTF MT4.   Ultimate CRT Indicator: Advanced ICT Concepts and Malaysian SnR Trading System Master the Market Maker's Footprints with the Most Advanced Candle Range Theory Indicator Discounted   Price   $50  !!     Secure your lifetime access   now   before it switches to   subscription-only ! Unlock the true power of  Smart Money Concepts (SMC)  and trade precisely like the institutions with the  Ultimate CRT Indicator . Built exclusively for serious traders, this indicat
Advanced Currency IMPULSE with ALERT
Bernhard Schweigert
4.9 (490)
현재 40% 할인!! 초보자 또는 전문가 트레이더를 위한 최고의 솔루션! 이 지표는 우리가 독점 기능과 비밀 공식을 통합했기 때문에 독특하고 고품질이며 저렴한 거래 도구입니다. 단 하나의 차트로 28개 통화 쌍 모두에 대한 경고를 제공합니다. 새로운 추세 또는 스캘핑 기회의 정확한 트리거 포인트를 정확히 찾아낼 수 있기 때문에 거래가 어떻게 개선될지 상상해 보십시오! 새로운 기본 알고리즘을 기반으로 구축되어 잠재적인 거래를 훨씬 더 쉽게 식별하고 확인할 수 있습니다. 이는 통화의 강세 또는 약세가 가속되는지 여부를 그래픽으로 표시하고 가속 속도를 측정하기 때문입니다. 자동차의 속도계처럼 생각하면 됩니다. 가속화할 때 Forex 시장에서 동일한 일이 분명히 더 빠르게 발생합니다. 즉, 반대 방향으로 가속화되는 통화를 페어링하면 잠재적으로 수익성 있는 거래를 식별한 것입니다. 통화 모멘텀의 수직선과 화살표가 거래를 안내합니다! 역동적인 Market Fibonacci 23 레벨은
KURAMA GOLD SIGNAL PRO (MT4) — 7중 필터 · 자동 TP/SL · 품질 점수 · 시그널 기록 저장 | XAUUSD 완전 트레이딩 시스템 실시간 리페인트 없음. 시그널이 나타나는 순간 화살표, 진입, TP, SL이 그 자리에 고정되어 이후 절대 움직이지 않습니다. 여러분이 거래하는 것은 바로 이 실시간 시그널입니다. 그리고 v7.20에서는 실제로 발신된 모든 시그널이 자동 저장되어 재시작 후에도 정확히 복원됩니다. 구매자 전용 보너스 평생 라이선스를 구매하시면 AI Zone Radar($59 상당) + 완전 PDF 매뉴얼을 무료로 드립니다. 제품 가격에 더해 $59 상당의 보너스가 따라옵니다. 구매 후 MQL5로 메시지를 보내주세요. AI Zone Radar: https://www.mql5.com/en/market/product/175834 골드 트레이더 커뮤니티에서 실제로 사용되며 정확성과
No Repaint XAU Hunter
Noha Mohamed Fathy Younes Badr
5 (1)
No Repaint XAU Hunter read the blog No Repaint XAU Hunter is a technical indicator developed for XAUUSD (Gold). It provides Buy and Sell signals on the chart together with predefined target levels to assist traders in identifying potential market movements. The indicator is based on candle-close confirmation logic. Once a signal is generated on a closed candle, it remains fixed on the chart and is not modified by subsequent price action. Features Buy and Sell signal arrows displayed directly on
MetaBands M4
Vahidreza Heidar Gholami
3.5 (6)
MetaBands uses powerful and unique algorithms to draw channels and detect trends so that it can provide traders with potential points for entering and exiting trades. It’s a channel indicator plus a powerful trend indicator. It includes different types of channels which can be merged to create new channels simply by using the input parameters. MetaBands uses all types of alerts to notify users about market events. Features Supports most of the channel algorithms Powerful trend detection algorith
이 지표는 실제 거래에 완벽한 자동 파동 분석 지표입니다! 사례... 참고:   웨이브 그레이딩에 서양식 이름을 사용하는 데 익숙하지 않습니다. Tang Lun(Tang Zhong Shuo Zen)의 명명 규칙의 영향으로 기본 웨이브를   펜   으로 명명하고 2차 웨이브 밴드를   세그먼트   로 명명했습니다. 동시에, 세그먼트에는 추세 방향이 있습니다.   주요 추세 세그먼트에는   이름이 지정되지만(이 이름 지정 방법은 향후 노트에서 사용됩니다. 먼저 말씀드리겠습니다.) 알고리즘은 굴곡 이론과 거의 관련이 없으므로 그렇게 해서는 안 됩니다. 이는 나의 시장 분석을   통해 요약된 끊임없이 변화하고 복잡한 운영 규칙을   반영합니다. 밴드는 더 이상 사람마다 다르지 않도록 표준화되고 정의되었습니다. 인위적인 간섭의 드로잉 방법은 시장 진입을 엄격하게 분석하는 데 핵심적인 역할을 합니다. 이 지표를 사용하는 것은 거래 인터페이스의 미학을 개선하고 원래의 K-line 거래를
Pytrader mt4 Python
Offpista LTD
5 (3)
Documentation for connecting Metatrader 4 with Python with a simple drag and drop EA.   A full end-to-end solution ,fully tested ,fast and efficient! The Pytrader ecosystem consists of a python script and a MT4 EA. (  MT5  version ) Further for the licensing an indicator is used.  The communication between the python script and the EA is based on sockets. EA is the  Server   and the python script the  Client .  It is always query(function / python script) and output(data / server). The EA doe
Advanced Supply Demand
Bernhard Schweigert
4.91 (300)
현재 30% 할인! 초보자나 전문 트레이더를 위한 최고의 솔루션! 이 보조지표는 우리가 다수의 독창적 기능과 새로운 공식을 통합한 독특하고 고품질이며 저렴한 거래 도구입니다. 이 업데이트를 통해 이중 시간대를 표시할 수 있습니다. 더 높은 TF를 표시할 수 있을 뿐만 아니라 차트 TF와 더 높은 TF 모두를 표시할 수 있습니다: 중첩 영역 표시. 모든 Supply Demand 트레이더들이 좋아할 것입니다. :) 중요한 정보 공개 Advanced Supply Demand의 잠재력을 극대화하려면 다음을 방문하십시오. https://www.mql5.com/ko/blogs/post/720245   진입 또는 목표의 명확한 트리거 포인트를 정확히 찾아냄으로 해서 거래가 어떻게 개선될지 상상해 보십시오. 새로운 알고리즘을 기반으로 매수자와 매도자 간의 잠재적인 불균형을 훨씬 더 쉽게 분간할 수 있습니다. 왜냐하면 가장 강한 공급영역과 가장 강한 수요 영역과 과거에 어떻게 진행 되었는지를(이전
IX Power MT4
Daniel Stein
4.82 (11)
IX Power: 지수, 원자재, 암호화폐 및 외환 시장 통찰력을 발견하세요 개요 IX Power 는 지수, 원자재, 암호화폐 및 외환 시장의 강도를 분석할 수 있는 다목적 도구입니다. FX Power 는 모든 가용 통화 쌍 데이터를 사용하여 외환 쌍에 대해 가장 높은 정확도를 제공하는 반면, IX Power 는 기초 자산 시장 데이터에만 초점을 맞춥니다. 이로 인해 IX Power 는 비외환 시장에 이상적이며, 다중 쌍 분석이 필요하지 않은 간단한 외환 분석에도 신뢰할 수 있는 도구입니다. 모든 차트에서 매끄럽게 작동하며, 거래 결정을 향상시키기 위한 명확하고 실행 가능한 통찰력을 제공합니다. 1. IX Power가 트레이더에게 유용한 이유 다양한 시장 강도 분석 • IX Power 는 지수, 원자재, 암호화폐 및 외환 심볼의 강도를 계산하여 각 시장에 맞는 통찰력을 제공합니다. • US30, WTI, 금, 비트코인 또는 통화 쌍과 같은 자산을 모니터링하여 거래 기회를 발견
Reversal Identifier MT5 -  차트에서 반전 지점을 찾아주는 지표입니다. 차트를 다시 그리거나 지연 없이 작동하며, 프랙탈 형태의 고점과 저점을 식별하고 화살표로 반전 지점을 표시합니다. 이 지표는 추세 방향의 조정이나 변화가 발생하는 초기 반전 지점을 식별합니다. 이 지표를 가장 효과적으로 사용하는 방법은 두 개의 시간 프레임을 활용하는 것입니다. 높은 시간 프레임에서는 추세를 파악하고 낮은 시간 프레임에서는 진입 신호를 수신합니다. 이 지표는 단독으로 사용하거나 다른 지표 또는 거래 시스템과 함께 사용할 수 있습니다. "Filter level" 은 화살표 표시 빈도를 조절하는 매개변수입니다. 값은 1 에서 5 까지입니다. 이 매개변수를 통해 화살표 빈도를 제어하여 위험과 기회를 조절할 수 있습니다. 모든 금융 상품에 사용할 수 있도록 설정되어 있습니다. 적합한 시간 프레임은 M5, M15, M30, H1, H4입니다. 파란색 화살표는 하락 반전을, 주황색
Trend Lines PRO
Roman Podpora
5 (1)
트렌드 라인즈 프로       이 지표는 시장이 실제로 어떤 방향으로 전환되는지 파악하는 데 도움이 됩니다. 실제 추세 반전 지점과 주요 시장 참여자들이 다시 진입하는 지점을 보여줍니다. 보시다시피       BOS 라인       복잡한 설정이나 불필요한 노이즈 없이 더 높은 시간대의 추세 변화와 주요 레벨을 확인할 수 있습니다. 신호는 차트에 다시 그려지지 않고 캔들이 마감된 후에도 계속 표시됩니다. VERSION MT 5   -   RFI LEVELS PRO   표시기   와 결합할 때 최대 잠재력을 발휘합니다. 지표가 보여주는 내용: 실제 변화       추세(BOS 라인) 한 번 신호가 나타나면 그 신호는 계속 유효합니다! 이는 신호를 발생시킨 후 변경될 수 있는 리페인팅 방식의 지표와 중요한 차이점입니다. 리페인팅 방식의 지표는 잠재적으로 자금 손실로 이어질 수 있습니다. 이제 더욱 높은 확률과 정확도로 시장에 진입할 수 있습니다. 또한 화살표가 나타난 후 목표가(익절)
RelicusRoad Pro
Relicus LLC
4.65 (107)
RelicusRoad Pro: 퀀트 시장 운영 체제 70% 할인 평생 이용권 (한정 시간) - 2,000명 이상의 트레이더와 함께하세요 왜 대부분의 트레이더는 "완벽한" 지표를 가지고도 실패할까요? 진공 상태에서 단일 개념 만으로 거래하기 때문입니다. 문맥 없는 신호는 도박입니다. 지속적인 승리를 위해서는 컨플루언스(중첩) 가 필요합니다. RelicusRoad Pro는 단순한 화살표 지표가 아닙니다. 완전한 퀀트 시장 생태계 입니다. 독점적인 변동성 모델링을 사용하여 가격이 이동하는 "공정 가치 로드"를 매핑하고, 단순 노이즈와 실제 구조적 돌파를 구분합니다. 추측은 그만두세요. 기관급 로드 로직으로 거래를 시작하세요. 핵심 엔진: "Road" 알고리즘 시스템의 중심에는 시장 상황에 실시간으로 적응하는 동적 변동성 채널인 Road Algo 가 있습니다. 세이프 라인(평형) 과 가격이 수학적으로 반전될 가능성이 높은 확장 레벨 을 투영합니다. Simple Road: 일반적인 시장을 위
Enigmera
Ivan Stefanov
5 (8)
ENIGMERA: 시장의 핵심 중요: MQL5.com의 데모는 Strategy Tester에서 실행되며 Enigmera의 기능을 완전히 반영하지 못할 수 있습니다. 설명, 스크린샷 및 비디오를 확인하여 자세한 내용을 확인하십시오. 질문이 있으면 언제든지 메시지를 보내주세요! 인디케이터의 코드는 완전히 다시 작성되었습니다. 버전 3.0은 새로운 기능을 추가하고 인디케이터가 처음 출시된 이후 누적된 버그를 수정했습니다. 소개 이 인디케이터 및 거래 시스템은 금융 시장에 대한 주목할 만한 접근 방식입니다. ENIGMERA는 프랙탈 주기를 사용하여 정확하게 지원 및 저항 수준을 계산합니다. 실제 축적 단계를 보여주고 방향과 목표를 제공합니다. 트렌드와 수정 모두에서 작동하는 시스템입니다. 작동 방식 인디케이터의 대부분의 기능은 차트 왼쪽에 있는 버튼을 통해 제어되며, 이를 통해 다양한 시장 상황에 빠르게 대응할 수 있습니다. 버튼 ON/OFF – 인디케이터 전체를 표시하거나 숨깁니다.
Current event:  https://c.mql5.com/1/326/A2SR2025_NoMusic.gif A. A2SR이란 무엇입니까 ?   * 선행 기술 지표입니다(재도장 없음, 지연 없음). -- 안내 : https://www.mql5.com/en/blogs/post/734748/page4#comment_16532516 -- 및 https://www.mql5.com/en/users/yohana/blog A2SR에는 지원(수요) 및 저항(공급) 수준을 결정하는 특별한 기술이 있습니다. 우리가 인터넷에서 본 일반적인 방식과 달리 A2SR은 실제 SR 수준을 결정하는 독창적인 개념을 가지고 있습니다. 원래 기술은 인터넷에서 가져온 것이 아니며 인터넷에 게시된 적도 없습니다. A2SR은 거래 스타일에 따라 SR 수준을 자동으로 선택합니다. 시간 프레임을 변경해도 SR 레벨은 그대로 유지됩니다. 사용하는 시간 프레임에서 실제 SR을 얻지 못하기 때문입니다. A2SR은 거래를
제작자의 제품 더 보기
ACB Breakout Arrows MT5
KEENBASE SOFTWARE SOLUTIONS
3.5 (2)
ACB Breakout Arrows 지표는 특별한 돌파 패턴을 감지하여 시장에서 중요한 진입 신호를 제공합니다. 이 지표는 차트를 지속적으로 스캔하면서 한 방향으로 움직임이 자리 잡을 때를 포착하여 큰 움직임 직전에 정확한 진입 신호를 제공합니다. 다중 종목 및 다중 시간대 스캐너는 여기에서 확인하세요 - ACB Breakout Arrows MT5용 스캐너 핵심 기능 지표가 자동으로 손절(Stop Loss) 및 익절(Take Profit) 수준을 제공합니다. 모든 시간대의 돌파 신호를 추적하는 MTF 스캐너 대시보드 포함. 데이 트레이더, 스윙 트레이더 및 스캘퍼에게 적합합니다. 신호 정확도를 높이기 위해 최적화된 알고리즘 사용. 손익분기점 또는 빠른 수익 목표를 위한 특별한 라인 (Quick Profit Line) 제공. 승률, 성공 비율, 평균 수익 등의 성과 분석 지표 제공. 재도색 없음. 신호는 고정되어 신뢰할 수 있습니다. 거래 확인 - ACB Trade Filter 지
ACB Trade Filter MT5
KEENBASE SOFTWARE SOLUTIONS
ACB Trade Filter indicator provides a way to filtering out the low probability trading entries in a trading strategy. The indicator uses a sophisticated filtration algorithm based on the market sentiment and trend. The MT4 version of the same indicator is available here ACB Trade Filter MT4 Applications Works great with our indicator ACB Breakout Arrows MT5 Filter out low probability signals from any indicator. Avoid over-trading and minimize the losses. Trade in the direction of market sentime
ACB Trade Filter MT4
KEENBASE SOFTWARE SOLUTIONS
5 (1)
The ACB Trade Filter indicator provides a solution for filtering out the low probability trading setups in a trading strategy. The indicator uses a sophisticated filtration algorithm based on the market sentiment and trend. Applications Works great with our indicator " ACB Breakout Arrows ". Filter out low probability signals from any indicator. Avoid overtrading and minimize the losses. Trade in the direction of market sentiment and trend. Avoid the choppiness in the market. How to use Only L
KT Auto Support Resistance Levels: MetaTrader 4/5용 멀티 타임프레임 S&R, Smart Zones 및 레벨 대시보드 스윙 고점. 피벗. 오더블록. 이전 고점과 저점. 트레이더마다 시장을 표시하는 방식은 조금씩 다르고, 그 대가는 결국 차트가 치르게 됩니다. 한 화면에 너무 많은 방법을 쌓아 올리면 차트는 더 이상 지도가 아닙니다. 그냥 소음이 됩니다. KT Auto Support Resistance Levels 는 이 문제를 해결합니다. 월간, 주간, 일간, 그리고 현재 타임프레임을 동시에 스캔한 뒤, 실제로 중요한 레벨을 MetaTrader 차트 위에 자동으로 그려 줍니다. 차트가 복잡해지면 한 번의 클릭으로 모든 레벨을 깔끔한 Smart Zones로 병합할 수 있습니다. 또한 실시간 패널이 항상 현재 가격 위와 아래의 가장 가까운 레벨을 보여 주기 때문에, 차트에서 계속 찾아다닐 필요가 없습니다. 지치지 않고 계속해서 중요 레벨을 표시해 주
KT Support and Resistance Levels
KEENBASE SOFTWARE SOLUTIONS
KT Auto Support Resistance Levels: MetaTrader 4/5용 멀티 타임프레임 S&R, Smart Zones 및 레벨 대시보드 스윙 고점. 피벗. 오더블록. 이전 고점과 저점. 트레이더마다 시장을 표시하는 방식은 조금씩 다르고, 그 대가는 결국 차트가 치르게 됩니다. 한 화면에 너무 많은 방법을 쌓아 올리면 차트는 더 이상 지도가 아닙니다. 그냥 소음이 됩니다. KT Auto Support Resistance Levels 는 이 문제를 해결합니다. 월간, 주간, 일간, 그리고 현재 타임프레임을 동시에 스캔한 뒤, 실제로 중요한 레벨을 MetaTrader 차트 위에 자동으로 그려 줍니다. 차트가 복잡해지면 한 번의 클릭으로 모든 레벨을 깔끔한 Smart Zones로 병합할 수 있습니다. 또한 실시간 패널이 항상 현재 가격 위와 아래의 가장 가까운 레벨을 보여 주기 때문에, 차트에서 계속 찾아다닐 필요가 없습니다. 지치지 않고 계속해서 중요 레벨을 표시해 주
KT Heiken Ashi Smoothed MT4
KEENBASE SOFTWARE SOLUTIONS
KT Heiken Ashi Smoothed 는 표준 Heiken Ashi 를 한층 더 부드럽게 처리한 버전으로, 추세 전환 시 매수/매도 화살표도 함께 표시합니다. 복잡한 설정 없이 시장의 핵심 변화를 직관적으로 보여주기 때문에 바쁜 트레이더에게 유용합니다. 상태가 약세에서 강세로 전환되면 매수 화살표가 나타납니다. 상태가 강세에서 약세로 전환되면 매도 화살표가 나타납니다. 모바일 알림, 이메일, 소리, 팝업 경고를 모두 지원합니다. Heiken Ashi Smoothed 란? 표준 Heiken Ashi 에 존재하는 잡음과 허위 신호를 제거하기 위해 두 개의 이동 평균으로 가격 데이터를 부드럽게 처리합니다. 약간의 지연은 있지만, 스윙 포인트와 새롭게 형성되는 추세를 명확히 드러내며, 평소 시야에 잘 들어오지 않는 가격 변화를 확인할 수 있습니다. 이를 통해 트레이더는 진입·청산 전략과 리스크 관리를 세밀하게 조정할 수 있습니다. 활용 이 지표는 외환, 원자재, 주식 등 다양한
외환 거래를 한다면, 통화 강도와 통화쌍 상관관계에 대한 상세한 정보를 아는 것은 거래 실력을 한 단계 끌어올리는 데 큰 도움이 됩니다. 상관관계를 분석하면 리스크를 절반으로 줄일 수 있고, 강도 분석을 통해 수익을 극대화할 수 있습니다. 이 지표는 통화 강도 분석과 통화쌍 상관관계를 결합하여 가장 적합한 통화쌍을 선택할 수 있도록 도와주는 하이브리드 접근 방식을 제공합니다. 통화 강도 분석 활용 방법 예를 들어, 당신의 거래 전략이 AUD/JPY 매수 기회를 제공한다고 가정해 봅시다. 하지만 KT 통화 강도 분석을 통해 JPY가 AUD보다 강해지고 있다는 것을 발견했다면, 이 거래는 손실로 끝날 가능성이 높습니다. 이 지표를 사용하면 이러한 손실을 쉽게 피할 수 있습니다. 통화쌍 상관관계 활용 방법 또 다른 예로, 거래 전략이 NZD/USD와 GBP/JPY 두 통화쌍 모두에 대해 매도 기회를 제공한다고 가정해 봅시다. KT 통화쌍 상관관계 분석을 사용하면 이 두 통화쌍 간 상관
KT Auto Fibo MT5
KEENBASE SOFTWARE SOLUTIONS
5 (1)
KT Auto Fibo는 현재 추세 방향에 따라 피보나치 되돌림 레벨을 자동으로 그립니다. 고점과 저점은 차트에 표시된 최대값과 최소값을 사용하여 자동으로 선택됩니다. 사용자는 차트를 확대/축소하거나 스크롤하여 피보나치 레벨을 적절히 조정할 수 있습니다. 모드 자동:  차트 영역을 기반으로 피보나치 레벨을 자동으로 그립니다. 수동: 피보나치 레벨을 한 번만 그리고, 이후에는 앵커 포인트를 수동으로 조정할 수 있습니다. 사용 방법: 미래 수익 목표를 논리적으로 예측하는 데 도움이 됩니다. 지지/저항선이나 추세선과 결합하면 강력한 반전 가능성을 제공합니다. 추세 시장에서 저위험 진입 기회를 제공합니다. 입력 매개변수 자동:  사람의 개입 없이 피보나치 되돌림 레벨을 자동으로 그립니다. 수동:  피보나치 되돌림 레벨을 한 번만 그리고, 이후에는 앵커 포인트를 직접 늘릴 수 있습니다. 미되돌림 영역 표시: 가격 되돌림이 아직 닿지 않은 차트 영역을 표시하거나 숨깁니다. 나머지 입력 항
FREE
KT MA Crossover MT5
KEENBASE SOFTWARE SOLUTIONS
KT MA Crossover는 사용자가 선택한 이동 평균선의 교차를 기반으로 매수 및 매도 화살표를 차트에 표시합니다. 또한 각 연속적인 신호에 대해 적절한 알림을 생성하며, MFE(최대 유리 변동값)도 함께 표시하여 트레이더가 가능한 최대 이익 범위를 파악할 수 있도록 도와줍니다. 이동 평균 교차 전략은 전 세계 트레이더들이 가장 많이 사용하는 기본적인 거래 전략 중 하나입니다. 일반적으로 빠른 이동 평균선과 느린 이동 평균선을 조합하여 교차 방향에 따라 매수 또는 매도 진입 신호를 식별합니다. 매수 신호 – 빠른 MA가 느린 MA를 상향 돌파할 때. 매도 신호 – 빠른 MA가 느린 MA를 하향 돌파할 때. 기능 각 이동 평균의 속성을 자유롭게 설정할 수 있습니다. 각 신호에 대해 MFE 값을 제공합니다. 가볍고 효율적으로 작동하는 인디케이터로 시스템 리소스 사용이 적습니다. MetaTrader의 모든 경고 기능이 포함되어 있습니다. 단점  이동 평균은 과거 데이터를 기반으로
FREE
KT Pin Bar MT5
KEENBASE SOFTWARE SOLUTIONS
KT Pin Bar identifies the pin bar formation which is a type of price action pattern which depicts a sign of reversal or rejection of the trend. When combined with support and resistance, BRN and other significant levels, Pin Bar pattern proved to be a very strong sign of reversal. Basically, a pin bar is characterized by a small body relative to the bar length which is closed either in upper or lower 50% part of its length. They have very large wicks and small candle body. A pin bar candlestic
FREE
KT Heiken Ashi Smoothed MT5
KEENBASE SOFTWARE SOLUTIONS
KT Heiken Ashi Smoothed 는 표준 Heiken Ashi 를 한층 더 부드럽게 처리한 버전으로, 추세 전환 시 매수/매도 화살표도 함께 표시합니다. 복잡한 설정 없이 시장의 핵심 변화를 직관적으로 보여주기 때문에 바쁜 트레이더에게 유용합니다. 상태가 약세에서 강세로 전환되면 매수 화살표가 나타납니다. 상태가 강세에서 약세로 전환되면 매도 화살표가 나타납니다. 모바일 알림, 이메일, 소리, 팝업 경고를 모두 지원합니다. Heiken Ashi Smoothed 란? 표준 Heiken Ashi 에 존재하는 잡음과 허위 신호를 제거하기 위해 두 개의 이동 평균으로 가격 데이터를 부드럽게 처리합니다. 약간의 지연은 있지만, 스윙 포인트와 새롭게 형성되는 추세를 명확히 드러내며, 평소 시야에 잘 들어오지 않는 가격 변화를 확인할 수 있습니다. 이를 통해 트레이더는 진입·청산 전략과 리스크 관리를 세밀하게 조정할 수 있습니다. 활용 이 지표는 외환, 원자재, 주식 등 다양한
KT Psar Arrows
KEENBASE SOFTWARE SOLUTIONS
KT Psar Arrows는 표준 파라볼릭 SAR 지표를 사용하여 차트에 화살표를 표시합니다. 캔들의 고가가 SAR에 닿을 때 상승 화살표가 표시되고, 캔들의 저가가 SAR에 닿을 때 하락 화살표가 표시됩니다. 신호는 봉이 마감되기를 기다리지 않고 실시간으로 생성됩니다.  특징 Parabolic SAR 지표를 활용한 거래 전략을 실험하고 싶은 트레이더에게 유용한 도구입니다.  시장 반전 포인트를 찾는 데 사용할 수 있습니다. 사용자 정의 PSAR 입력 지원. MT4의 모든 알림 기능을 지원합니다. 주의사항: Parabolic SAR은 후행성 및 엄격한 기계적 지표입니다. 모든 잠재적 거래는 명확히 정의된 규칙에 따라 필터링해야 합니다.     입력 파라미터 PSAR 스텝: 스텝 값을 입력하세요. PSAR 최대값: 최대값을 입력하세요. PSAR 점 표시: PSAR 점을 표시하거나 숨길 수 있습니다. PSAR 점을 표시하지 않아도 화살표는 정상 작동합니다. 나머지 입력 항목은 직관적
KT Pin Bar
KEENBASE SOFTWARE SOLUTIONS
KT Pin Bar identifies the pin bar formation which is a type of price action pattern which depicts a sign of reversal or rejection of the trend. When combined with support and resistance, BRN and other significant levels, Pin Bar pattern proved to be a very strong sign of reversal. Basically, a pin bar is characterized by a small body relative to the bar length which is closed either in upper or lower 50% part of its length. They have very large wicks and small candle body. A pin bar candlestic
FREE
KT Auto Fibo
KEENBASE SOFTWARE SOLUTIONS
KT Auto Fibo는 현재 추세 방향에 따라 피보나치 되돌림 레벨을 자동으로 그립니다. 고점과 저점은 차트에 표시된 최대값과 최소값을 사용하여 자동으로 선택됩니다. 사용자는 차트를 확대/축소하거나 스크롤하여 피보나치 레벨을 적절히 조정할 수 있습니다. 모드 자동:  차트 영역을 기반으로 피보나치 레벨을 자동으로 그립니다. 수동: 피보나치 레벨을 한 번만 그리고, 이후에는 앵커 포인트를 수동으로 조정할 수 있습니다. 사용 방법: 미래 수익 목표를 논리적으로 예측하는 데 도움이 됩니다. 지지/저항선이나 추세선과 결합하면 강력한 반전 가능성을 제공합니다. 추세 시장에서 저위험 진입 기회를 제공합니다. 입력 매개변수 자동:  사람의 개입 없이 피보나치 되돌림 레벨을 자동으로 그립니다. 수동:  피보나치 되돌림 레벨을 한 번만 그리고, 이후에는 앵커 포인트를 직접 늘릴 수 있습니다. 미되돌림 영역 표시: 가격 되돌림이 아직 닿지 않은 차트 영역을 표시하거나 숨깁니다. 나머지 입력 항
FREE
KT Volatility Oscillator MT5
KEENBASE SOFTWARE SOLUTIONS
KT 변동성 오실레이터는 과거와 현재의 시장 데이터를 수학적 공식으로 분석하여 오실레이터 형태로 결과를 표시합니다. 증가하는 파동과 감소하는 파동은 각각 자산의 높은 변동성과 낮은 변동성을 나타냅니다.  간단히 말해, 변동성은 일정 기간 동안 자산 가격이 얼마나 변동했는지를 측정하는 지표입니다. 변동성이 없다면 시장의 움직임이 거의 없을 것이고, 트레이더들은 가격 변동을 통해 수익을 얻을 수 없을 것입니다. 외환 시장에서 변동성 활용 외환 시장에서 변동성을 적절히 활용하면 보다 효과적으로 거래할 수 있으며, 기대치를 현실에 맞춰 조정하는 데 도움이 됩니다.  높은 변동성 추세 기반 시스템은 변동성이 높은 시장에서 큰 스윙과 더 긴 포지션 보유 기간 덕분에 매우 잘 작동합니다. 고변동성 구간에서 발생하는 돌파는 더 많은 핍스를 획득할 수 있는 기회를 제공합니다. 낮은 변동성 평균 회귀 시스템은 시장이 평균값으로 되돌아가려는 성질이 있기 때문에 낮은 변동성 환경에서 특히 효과적입니다
FREE
KT Volatility Oscillator
KEENBASE SOFTWARE SOLUTIONS
KT 변동성 오실레이터는 과거와 현재의 시장 데이터를 수학적 공식으로 분석하여 오실레이터 형태로 결과를 표시합니다. 증가하는 파동과 감소하는 파동은 각각 자산의 높은 변동성과 낮은 변동성을 나타냅니다.  간단히 말해, 변동성은 일정 기간 동안 자산 가격이 얼마나 변동했는지를 측정하는 지표입니다. 변동성이 없다면 시장의 움직임이 거의 없을 것이고, 트레이더들은 가격 변동을 통해 수익을 얻을 수 없을 것입니다. 외환 시장에서 변동성 활용 외환 시장에서 변동성을 적절히 활용하면 보다 효과적으로 거래할 수 있으며, 기대치를 현실에 맞춰 조정하는 데 도움이 됩니다.  높은 변동성 추세 기반 시스템은 변동성이 높은 시장에서 큰 스윙과 더 긴 포지션 보유 기간 덕분에 매우 잘 작동합니다. 고변동성 구간에서 발생하는 돌파는 더 많은 핍스를 획득할 수 있는 기회를 제공합니다. 낮은 변동성 평균 회귀 시스템은 시장이 평균값으로 되돌아가려는 성질이 있기 때문에 낮은 변동성 환경에서 특히 효과적입니다
FREE
KT Round Numbers MT5
KEENBASE SOFTWARE SOLUTIONS
KT Round Numbers plots the round number levels which are also commonly known as psychological levels in the Forex world. In the context of Forex trading, round number levels are those levels in which there are two or more zeroes at the end. They are named as 00 levels on the chart. Some traders also consider the halfway points as a valid round number level. They are named as 50 levels on the chart. Use of round number levels in trading Round number levels work as strong support and resistance
FREE
KT MA Crossover MT4
KEENBASE SOFTWARE SOLUTIONS
KT MA Crossover는 사용자가 선택한 이동 평균선의 교차를 기반으로 매수 및 매도 화살표를 차트에 표시합니다. 또한 각 연속적인 신호에 대해 적절한 알림을 생성하며, MFE(최대 유리 변동값)도 함께 표시하여 트레이더가 가능한 최대 이익 범위를 파악할 수 있도록 도와줍니다. 이동 평균 교차 전략은 전 세계 트레이더들이 가장 많이 사용하는 기본적인 거래 전략 중 하나입니다. 일반적으로 빠른 이동 평균선과 느린 이동 평균선을 조합하여 교차 방향에 따라 매수 또는 매도 진입 신호를 식별합니다. 매수 신호 – 빠른 MA가 느린 MA를 상향 돌파할 때. 매도 신호 – 빠른 MA가 느린 MA를 하향 돌파할 때. 기능 각 이동 평균의 속성을 자유롭게 설정할 수 있습니다. 각 신호에 대해 MFE 값을 제공합니다. 가볍고 효율적으로 작동하는 인디케이터로 시스템 리소스 사용이 적습니다. MetaTrader의 모든 경고 기능이 포함되어 있습니다. 단점  이동 평균은 과거 데이터를 기반으로
FREE
KT Round Numbers MT4
KEENBASE SOFTWARE SOLUTIONS
KT Round Numbers plots the round number levels which are also commonly known as psychological levels in the Forex world. In the context of Forex trading, round number levels are those levels in which there are two or more zeroes at the end. They are named as 00 levels on the chart. Some traders also consider the halfway points as a valid round number level. They are named as 50 levels on the chart. Use of round number levels in trading Round number levels work as strong support and resistance
FREE
ACB Breakout Arrows
KEENBASE SOFTWARE SOLUTIONS
4.15 (34)
ACB Breakout Arrows 지표는 특별한 돌파 패턴을 감지하여 시장에서 매우 중요한 진입 신호를 제공합니다. 이 지표는 차트를 지속적으로 스캔하며 한 방향으로 안정적인 모멘텀이 형성되는지를 확인하고, 주요 움직임 직전에 정확한 진입 신호를 제공합니다.  다중 심볼 및 다중 타임프레임 스캐너 받기 – ACB Breakout Arrows MT4용 스캐너 주요 기능 지표가 자동으로 손절(Stop Loss) 및 이익실현(Take Profit) 레벨을 제공합니다. 모든 시간대의 돌파 신호를 추적하는 MTF 스캐너 대시보드가 포함되어 있습니다. 단타 트레이더, 스윙 트레이더, 스캘퍼에게 적합합니다. 정확도를 높이기 위한 최적화된 알고리즘 사용. 손익분기(Breakeven) 또는 단기 목표를 위한 특수 라인(퀵 프로핏 라인) 제공. 승률, 성공률, 평균 수익 등과 같은 성과 분석 지표 제공. 리페인트 없음 – 한번 생성된 신호는 사라지지 않습니다. 거래 확인 -  신뢰도 낮은 신호를
KT Momentum Arrows
KEENBASE SOFTWARE SOLUTIONS
KT Momentum Arrows 인디케이터는 순간적인 돌파 신호에 기반한 도구로, 밴드의 이탈 범위와 특정 방향으로 나타나는 변동성을 계산하여 신호를 생성합니다. 이 도구는 가격의 강한 움직임이 시작되는 시점을 빠르게 감지할 수 있도록 설계되었습니다. 가격이 상단 밴드를 상향 돌파하여 마감되면 매수 신호가 생성되며, 하단 밴드를 하향 돌파하여 마감되면 매도 신호가 생성됩니다. 밴드의 이탈과 변동성에 동시에 영향을 주는 '계수' 입력값이 있으며, 이는 거래 종목 및 시간 프레임에 따라 신중하게 분석 및 선택해야 합니다. 주요 특징 재도색 없음! 모멘텀 트레이더를 위한 훌륭한 진입 도구입니다. 승률, 손익비, 평균 수익 등 성과 분석 기능 포함. 단타, 스윙, 스캘핑 모든 스타일에 적합합니다. 입력 파라미터 히스토리 바:  지표 계산에 사용할 바의 수. 모멘텀 계수:  밴드 이탈 및 변동성 측정에 사용하는 계수. 성과 분석:  수익 추세선을 포함한 성과 분석 표시 여부.  알림
KT COG Advanced MT4
KEENBASE SOFTWARE SOLUTIONS
1 (1)
KT COG is an advanced implementation of the center of gravity indicator presented by John F. Ehlers in the May 2002 edition of Technical Analysis of Stocks & Commodities magazine. It's a leading indicator which can be used to identify the potential reversal points with the minimum lag. The COG oscillator catches the price swings quite effectively. MT5 version of the same indicator is available here KT COG Advanced MT5 Calculation of COG The COG indicator is consist of the two lines. The main l
KT Trend Magic
KEENBASE SOFTWARE SOLUTIONS
KT Trend Magic shows the trend depiction on chart using the combination of market momentum and volatility. A smoothing coefficient is used to smooth out the noise from the signal.It can be used to find out the new entries or confirm the trades produced by other EA/Indicators. Usage Drag n drop MTF scanner which scans for the new signals across multiple time-frames. Find new entries in the trend direction. Improve the accuracy of other indicators when used in conjunction. Can be used as a dynami
KT Ichimoku Trader
KEENBASE SOFTWARE SOLUTIONS
1 (1)
KT Ichimoku Trader is a fully automated expert advisor that offers five popular trading strategies based on the Ichimoku indicator. Each strategy has it's own entry and exit method without any interference to other strategies. The Ichimoku system can be applied to all major currency pairs and metals. However, we found that it performs reasonably well mainly on two pairs.   MT5 Version is available here  https://www.mql5.com/en/market/product/35043 Features Trade up to 5 famous trading strategi
KT COG Robot
KEENBASE SOFTWARE SOLUTIONS
KT COG Robot is a fully automated Expert Advisor based on the KT COG Indicator . The COG indicator was originally presented by John F. Ehlers in the May 2002 edition of Technical Analysis of Stocks & Commodities magazine. The EA fires a long trade when COG line cross above the signal line and a short trade is fired when the COG line cross below the signal line.  Adaptive Filtration Our adaptive filtration algorithm combines the original COG formula with the major trend direction and market acce
ACB Breakout Arrows EA
KEENBASE SOFTWARE SOLUTIONS
이 EA는 저희의 커스텀 인디케이터인 "ACB Breakout Arrows" 를 기반으로 한 100% 자동화된 전문가용 어드바이저입니다. 양방향으로 자주 발생하는 돌파 패턴을 이용하며, 외부 입력 값인 "Signal Sensitivity"를 통해 진입 신호의 강도를 조절할 수 있습니다. 거래 확인 ACB Breakout Arrows EA는 또 다른 커스텀 인디케이터인 ACB Trade Filter 를 사용하여 거래 진입 조건을 필터링할 수 있는 기능을 제공합니다. 강력한 매수: 위쪽 화살표 + 초록색 히스토그램 + 상승 추세 강력한 매도: 아래쪽 화살표 + 빨간색 히스토그램 + 하락 추세 히스토그램이 회색이고 추세가 횡보일 경우, EA는 거래를 피합니다. EA는 모든 인디케이터와 의존 파일을 백그라운드에서 로드하며, 차트에는 표시되지 않습니다. 주요 기능 오랜 기대 끝에 이제 ACB Breakout Arrows 인디케이터 로 완전 자동 매매가 가능합니다. ACB Trade F
KT Asian Breakout
KEENBASE SOFTWARE SOLUTIONS
4 (1)
KT Asian Breakout carefully analyzes the range-bound market during the Asian session and then fires a long or short trade after doing some preassessment based on its inbuilt technical analysis module. The executed orders are closed within a day before the completion of the next day session. The inbuilt technical analysis module checks for the session range and compares it with the last 20 days price movement. If it finds any erratic price movement within the session, the orders are not executed
KT London Breakout
KEENBASE SOFTWARE SOLUTIONS
First thirty minutes are essential for a trading session. The early reaction of traders and market players sets a path for the rest of the day. KT London Breakout EA takes advantage of this phenomenon, and after analyzing the first thirty minutes of London session, it places two bidirectional pending orders. One of pending order is eventually canceled after realizing the market direction with certainty. It has been strictly tested and developed for EUR/JPY using 30-Min Time Frame. You can expe
MACD Divergence Seeker
KEENBASE SOFTWARE SOLUTIONS
KT MACD Divergence Seeker trades the regular and hidden divergence signals generated by our free indicator named KT MACD Divergence indicator. Trading the standalone divergences can be a risky affair that's why the KT MACD Divergence Seeker combines the standard divergence signals with an advanced analysis module to exploit the price inefficiencies on some FX pairs. What is the Divergence exactly? As a general conception if the price is making higher highs, then macd should also be making hig
KT Asian Breakout Indicator
KEENBASE SOFTWARE SOLUTIONS
KT Asian Breakout 지표는 아시아 세션의 중요한 부분을 분석하여 가격 돌파 방향에 따라 매수 및 매도 신호를 생성합니다. 가격이 세션 최고점을 돌파하면 매수 신호가 발생하며, 가격이 세션 최저점을 돌파하면 매도 신호가 발생합니다. 유의 사항 세션 박스의 높이가 너무 넓다면, 대부분의 가격 움직임이 이미 세션 내에서 발생했기 때문에 새로운 거래를 피하는 것이 좋습니다. 돌파 캔들이 너무 크면, 가격이 신호 방향으로 계속 진행하기 전에 일시적인 되돌림이 발생할 가능성이 높습니다. 기능 매수/매도 신호에 스톱로스 및 목표 이익 수준이 포함됩니다. KT Asian Breakout 지표는 첫 번째, 두 번째 또는 세 번째 목표 이익을 기준으로 성과를 지속적으로 확인합니다. 승/패 신호 수, 성공률, 신호당 평균 핍스와 같은 세 가지 주요 성과 지표를 표시합니다. 돌파 캔들이 너무 크면 차트에 경고 메시지가 표시됩니다. 추천 설정 시간 프레임: 15분. 통화쌍: 모든 JPY
필터:
리뷰 없음
리뷰 답변