Renko Pro 5
- 지표
-
Kaijun Wang
 Cooperation contact QQ: 556024
Cooperation mailbox: 556024@qq.com
Cooperation WeChat: 556024
TGGOUP: https://t.me/+qmlWO6RSTPY1ODc1 - 버전: 3.9
- 업데이트됨: 2 5월 2023
- 활성화: 5
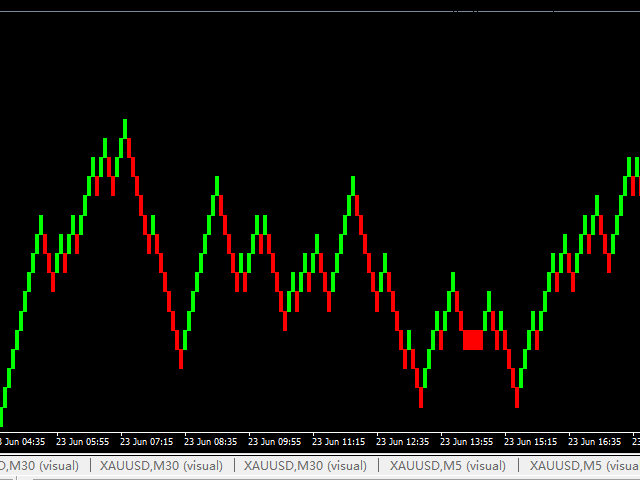
브릭 다이어그램 - 대체 거래 방법
수많은 차트의 촛대에 혼란스러워하는 트레이더이거나 선을 그리는 방법이나 지지선과 저항선을 그리는 방법을 모른다면 이때 자신에게 맞는 다른 거래 방법을 찾아야 합니다. 운전자가 반복적으로 문제를 만난 후 전면 점검을 위해 정지하는 것처럼 거래에서도 마찬가지입니다.
브릭 차트는 장중 거래자에게 간단한 거래 방법을 제공합니다.실제로 이 방법은 K-라인과 동일한 역사를 가지고 있으며 일본에서도 시작되었습니다.
브릭 차트를 정의하기 위해 세트 포인트 또는 베이시스 포인트의 가격 추세만 설명합니다. 예를 들어, 10포인트 브릭 차트는 가격 변화의 10포인트 상승 추세 또는 10포인트 하락 추세만 나타낼 수 있습니다.
브릭 다이어그램은 가격이 시간에 얽매이지 않는다는 독특한 장점이 있습니다. 즉, 가격 변동이 설정 값에 도달했을 때만 새로운 브릭 다이어그램이 나타나고 브릭 다이어그램이 가격 Burr를 제거하므로 감각에서 매우 편안합니다.