BuyStop and SellStop Grid MT5

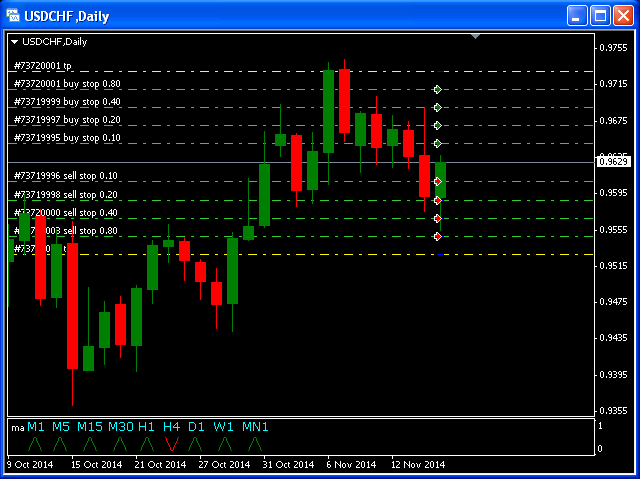
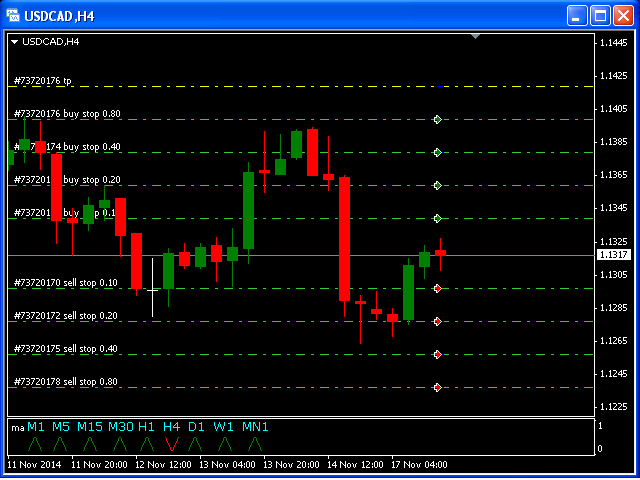
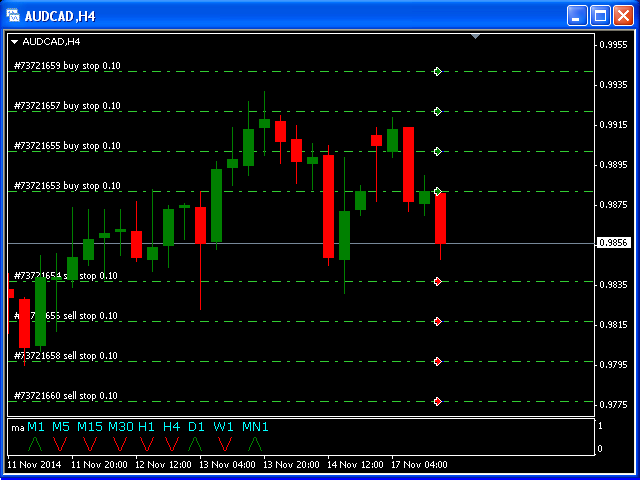
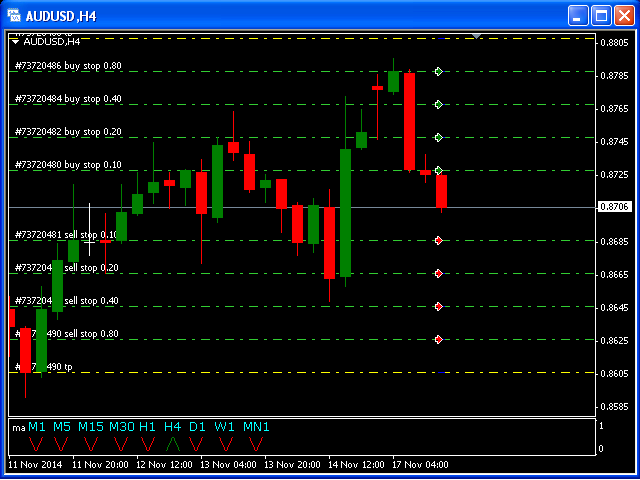
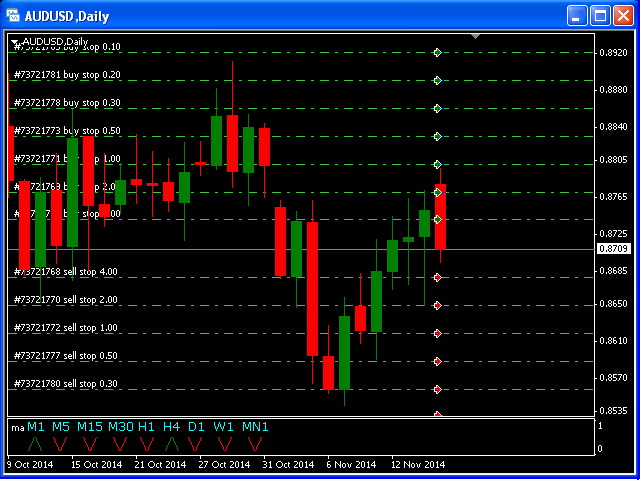
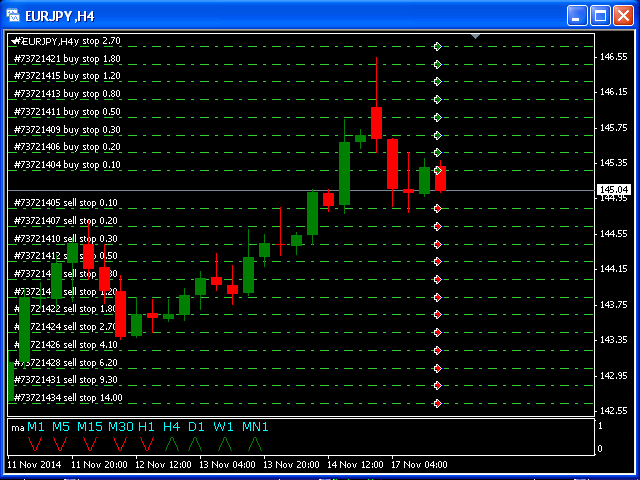
BuyStop_SellStop_Grid script opens BuyStop and SellStop pending orders and deletes all existing pending orders.

You just need to drop this script on the chart with a desired currency pair. 

Before placing all pending orders, the input window is opened allowing you to modify all input parameters:

  • DeleteAllPending - if TRUE, then all pending orders are deleted; 
  • BuyStop - if TRUE, BuyStop order is opened;
  • SellDtop - if TRUE, SellStop order is opened;
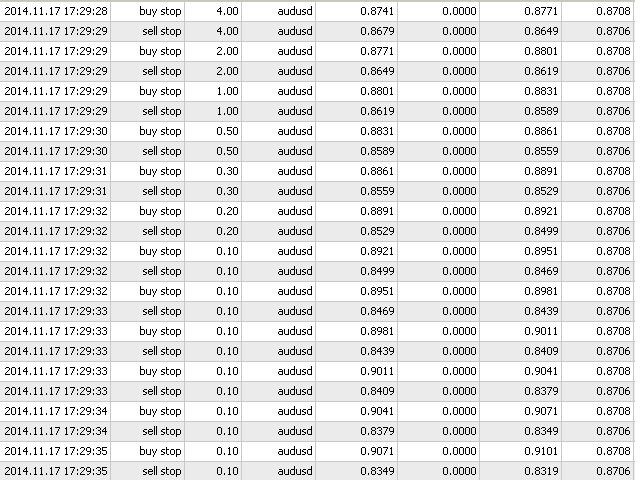
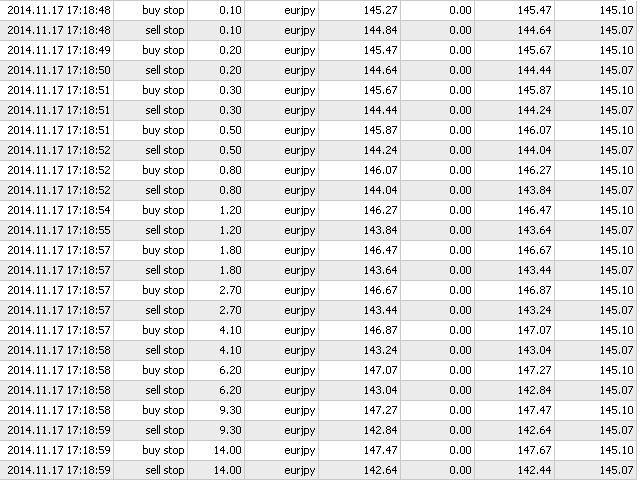
  • InitLot - initial lot;
  • LotCoeff - if 1, all pending orders have the same lot size;
  • InitStep - difference between two consecutive orders in points;
  • StepCoeff - step coefficient;
  • NumOfOrders - number of orders;
  • Slippage - allowed slippage;
  • MagicNum - magic number.

Attention:

  • If DeleteAllPendings=true, the script can delete existing pending orders for the current currency pair only.
  • You have to allow automated trading on the Expert Advisors tab (Tools->Options).
  • In the input window, you have to Allow Auto Trading.
추천 제품
You already have positions open. The question is whether the episode is still under control. Floating P/L tells you the result. It does not tell you the condition. A position group can still show a small gain while inventory load, hold time, adverse drift, weakening recovery, and spread expansion are already building pressure in the background. By the time the P/L number turns negative, the episode is already stressed. Episode Health Monitor was built to surface those conditions before they beco
Expert TP SL v04 - Professional Trading Assistant with AI Motivation System Advanced manual trading tool with automatic risk management, overtrading protection, and intelligent psychological support for disciplined trading. PRODUCT OVERVIEW Expert TP SL v04 is a comprehensive trading assistant designed for manual traders who want to maintain emotional discipline while automating risk calculations. This isn't just another order placement tool - it's a complete trading psychology system that pr
Candlestick Pattern Scanner is a multi-timeframe and multi-symbol dashboard and alert system that checks all timeframes and currency pairs for different candlestick patterns that are formed in them. Scanner is integrated   with support and resistance zones so you can check the candlestick patterns in most important areas of the chart to find breakout and reversal patterns in the price chart. Download demo version   (works on M4,M6,M12,H3,H8 timeframes and 20 symbols of Market Watch window) Read
Exp5 Duplicator
Vladislav Andruschenko
4.78 (9)
Duplicator for MetaTrader 5 — 하나의 터미널 안에서 동작하는 전문 포지션 복제 시스템 MetaTrader 5에서 이미 열려 있는 포지션을 자동으로 복제하고, 전체 거래 규모를 확장하며, 사용자 지정 로트 규칙을 적용하고, 복제 포지션을 정교한 로직으로 관리하려는 트레이더를 위한 신뢰성 높은 Expert Advisor입니다. 수동 매매, 알고리즘 매매, 그리고 이미 존재하는 포지션을 더 유연하게 관리하려는 사용자에게 적합한 실전형 도구입니다. Duplicator for MT5는 자체 매매 전략으로 새로운 포지션을 열지 않습니다. 이 제품의 역할은 MetaTrader 5 계정 안에 이미 존재하는 포지션을 감시하고, 사용자가 설정한 조건에 따라 복제 포지션을 생성하는 것입니다. 복제 횟수, 로트 크기, Stop Loss, Take Profit, 코멘트, 추가 관리 조건까지 세밀하게 설정할 수 있습니다. 서로 다른 플랫폼이나 다른 터미널 간 복사 기능이 아니라, 같
TradePilotmt5
Hossein Khalil Alishir
TradePilot Expert Advisor (EA) for MetaTrader 5 TradePilot is a professional and user-friendly Expert Advisor (EA) for MetaTrader 5 (MT5) . It simplifies automated trading , risk management , and trade execution with a smart trading panel . Perfect for beginners and experienced traders looking for a reliable trade manager EA with automated lot size calculation and smart position management. Key Advantages User-Friendly Trading Panel: Customizable panel with buttons and hotkeys for fast ex
Inverted_Chart_EA Utility Expert Advisor Inverted_Chart_EA creates and maintains a mirror-inverted chart of any symbol and timeframe. It automatically generates a custom instrument (e.g. US30_INV ) and keeps its price history updated in real time, with bars mirrored around a chosen pivot. This utility gives traders a new way to analyze the market from a different perspective by flipping the chart upside down. Why use an inverted chart? Highlight hidden patterns – price formations that look ordin
CosmiCLab FIBO
Kirils Subins
CosmiCLab SMC FIBO CosmiCLab SMC FIBO is a professional trading indicator designed for traders who use Smart Money Concepts (SMC), market structure analysis and Fibonacci retracement levels. The indicator automatically detects market swings and builds Fibonacci levels based on the latest impulse movement. It also identifies market structure changes such as BOS (Break of Structure) and CHOCH (Change of Character), helping traders understand the current market direction. CosmiCLab SMC FIBO also pr
An indicator of pattern #31 ("Long Island") from Encyclopedia of Chart Patterns by Thomas N. Bulkowski. The second gap is in the opposite direction. Parameters: Alerts - show alert when an arrow appears   Push - send a push notification when an arrow appears (requires configuration in the terminal) GapSize - minimum gap size in points ArrowType - a symbol from 1 to 17 ArrowVShift - vertical shift of arrows in points   ShowLevels - show levels ColUp - color of an upward line ColDn - color of a d
Trading Utility for Forex Currency Pairs Only not for Gold  Functions Auto Lot Calculation based on Risk Auto stoploss  Auto TakeProfit Breakeven Auto Close Half % Close in percentage with respect to the PIPs Pending Orders BuyLimit Sell Limit with distances BuyStop Sell Stop    with distances Trading Informations Risk in percentage For Multiple trades Combine Takeprofit and Combine Stoplosses
"Impulses and Corrections 5" is created to help traders navigate the market situation. The indicator shows multi-time frame upward and downward "Impulses" of price movements. These impulses are the basis for determining the "Base" , which is composed of zones of corrections of price movements, as well as "Potential" zones for possible scenarios of price movement. Up and down impulses are determined based on a modified formula of Bill Williams' "Fractals" indicator. The last impulse is always "U
TradePad
Ruslan Khasanov
5 (1)
TradePad는 수동 및 알고리즘 트레이딩을 위한 도구입니다. 여러 거래 상품에 대한 빠른 거래 작업과 포지션 제어를 위한 간단한 솔루션을 제공합니다. 주의, 이 애플리케이션은 전략 테스터에서 작동하지 않습니다! 데모 계정을 위한 애플리케이션의 평가판과 모든 도구에 대한 설명 애플리케이션 인터페이스는 고해상도 모니터에 맞게 조정되었으며 간단하고 직관적입니다. 편안한 작업을 위해 트레이더에게 다음과 같은 도구 세트가 제공됩니다. 거래 작업 관리, 메인 차트 기간 간 전환, TradePad 상품 간 전환을 위한 핫키 관리자; 포지션을 개설하거나 보류 주문을 설정할 때 하락 위험을 평가하고 잠재적 이익을 계산하기 위한 거래 수준 표시 도구; 여러 거래 심볼을 시각적으로 모니터링하고 알고리즘 트레이딩을 위한 거래 신호를 수신하기 위한 MultiCharts 도구. 편의를 위해 거래 쌍 세트를 구성하여 여러 시간대의 가격을 모니터링하고 다중 통화 거래를 수행할 수 있습니다. 확장된 HTML
TradeGuard Capital Protection Professional Risk, Exposure & Trade Manager for MetaTrader 5 This utility acts as a professional insurance system for your trading account. TradeGuard Capital Protection is a professional-grade risk & money management utility designed to protect your trading account from excessive losses, emotional trading, and uncontrolled exposure. This tool does NOT open trades . It strictly manages risk, drawdown, exposure, and safety protections . Perfect for manual traders, EA
Candle hunter
Ruslan Khasanov
5 (1)
그래픽 분석을 위한 지표입니다. 차트에 주요 일본 촛대 패턴을 표시합니다. 현재 거래자는 다음 패턴 세트를 사용할 수 있습니다.  - Bearish/Bullish Abandoned Baby;  - Bearish Advance Block;  - Bearish Deliberation;  - Bearish/Bullish Belt Hold;  - Bearish/Bullish Engulfing;  - Bearish Shooting Star;  - Bearish Evening Star;  - Bearish Evening Doji Star;  - Bearish/Bullish Doji Star;    - Bearish/Bullish Tri-Star;  - Bearish Hanging Man;  - Bearish/Bullish Harami;  - Bearish/Bullish Harami Cross;  - Bearish Two Crows;  - Bearish Identical Three Crows;
Overview Mirror Signals Service EA (Text only)   is a powerful monitoring Expert Advisor that automatically sends   real-time Telegram notifications   for all important trade events on your MetaTrader 5 account. It is engineered specifically for   signal providers ,   trade-copier operators ,   auditors ,   educators , and   professional trading services   that require immediate, detailed, and reliable reporting. Everything from   entries, exits, SL/TP changes, comment changes, trailing sto
This MQL5 indicator detects Volume Spread Analysis (VSA) patterns for BUY/SELL/NEUTRAL signals. Features minimizable GUI showing symbol and patterns. Scans candles from current to 4 bars ago. Patterns BUY/SELL: SellingClimax, StoppingVolume, Shakeout, Test, End of Rising Market, No Demand, Upthrust, Supply Coming In. Part of Trader Menu Info v5 - All in One.
CoPilot dashboard MT5
Frederic Jacques Collomb
CoPilot — 일일 트레이딩 대시보드 숫자를 파악하세요. 명확하게 트레이딩하세요. MT4 버전 CoPilot이란? CoPilot은 전문가 수준의 트레이딩 어시스턴트로, 모든 일일 성과 통계를 실시간으로 차트에 직접 표시합니다 — 라이브 에퀴티 커브 는 거래마다 업데이트됩니다. 차트를 벗어나지 않고 세션을 즉시 파악해야 하는 활발한 트레이더를 위해 설계되었으며, CoPilot은 모든 심볼의 당일 모든 청산된 거래 를 집계하여 깔끔하고 색상 코딩된 인터랙티브 패널로 표시합니다. 터미널 히스토리 탭으로 전환할 필요가 없습니다. 수동 계산도 필요 없습니다. CoPilot은 당신의 부조종사 로서 — 항상 주시하고, 항상 계산하며, 항상 눈앞에 있습니다. 실시간 통계 패널 CoPilot은 세 섹션으로 구성된 완전한 일일 성과 지표를 표시합니다: 활동 — 오늘의 총 거래 수, 청산된 거래, 오픈 포지션, 수익/손실 횟수, 승률 (%) 및 손익분기 거래. 승률 색상은 동적으로 변경: 50% 초
Auto Orders Manager EA
Mohamed Abdulmohsen Mohamed Saeed Ali
Professional Trading Orders Manager for MT5 with Signal-Analyzer-Direction-Power-Orders control - Scalping tools - Risk management - all in one trade panel and dashboard  A sophisticated Expert Advisor that transforms your MT5 platform into a complete trading command center. This tool seamlessly blends automated trading logic with comprehensive manual controls through dual interactive dashboards. Key Features: Automated Trading : advanced scalping strategy on M3 timeframe as a signal sample can
Mine Farm
Maryna Kauzova
Mine Farm is one of the most classic and time-tested scalping strategies based on the breakdown of strong price levels. Mine Farm is the author's modification of the system for determining entry and exit points into the market... Mine Farm - is the combination of great potential with reliability and safety. Why Mine Farm?! - each order has a short dynamic Stop Loss - the advisor does not use any risky methods (averaging, martingale, grid, locking, etc.) - the advisor tries to get the most
Trading Assistent is a multifunctional trading panel that combines all necessary tools for professional trading. The panel provides complete control over positions, in-depth risk analysis, and fast order execution. MAIN FUNCTIONAL BLOCKS Position Management: - Real-time viewing of all open positions - Sorting by symbol, profit, volume, and type - Visual indication of profitable and losing positions - Bulk closing operations - Breakeven function for profit protection Trading Operations: - I
Auto SLTP Maker MT5  is an assistant for all those who forget to set StopLoss and/or TakeProfit in deal parameters, or trade on a very fast market and fail to place them in time. This tool automatically tracks trades without StopLoss and/or TakeProfit and checks what level should be set in accordance with the settings. The tool works both with market and pending orders. The type of orders to work with can be set in the parameters. It can track either trades for the instrument it runs on, or all
표시기는 가능한 최소 지연으로   다시 칠하지 않고   차트의 고조파 패턴을 보여줍니다. 지표 상단 검색은 가격 분석의 파동 원리를 기반으로 합니다. 고급 설정을 통해 거래 스타일에 대한 매개변수를 선택할 수 있습니다. 양초(막대)가 열릴 때 새로운 패턴이 형성되면 가격 변동의 가능성이 있는 방향의 화살표가 고정되어 변경되지 않습니다. 표시기는 ABCD, Gartley(Butterfly, Crab, Bat), 3Drives, 5-0, Batman, SHS, One2One, Camel, Triangles, WXY, Fibo, Vibrations와 같은 패턴과 그 종류를 인식합니다. 기본적으로 ABCD 및 Gartley 수치만 설정에 표시됩니다. 많은 추가 구성 가능한 매개변수. 주요 매개변수: ShowUpDnArrows - 가능한 방향 화살표 표시/숨기기 ArrowUpCode - 위쪽 화살표 코드 ArrowDnCode - 아래쪽 화살표 코드 Show old history pattern
Falling wedge MT5
Dmitry Fedoseev
An indicator of patterns #52 and #53 ("Falling/rising wedges") from Encyclopedia of Chart Patterns by Thomas N. Bulkowski. Parameters: Alerts - show alert when an arrow appears   Push - send a push notification when an arrow appears (requires configuration in the terminal) PeriodBars - indicator period K - an additional parameter that influences the accuracy of pattern shape recognition ArrowType - a symbol from 1 to 17 ArrowVShift - vertical shift of arrows in pixels  ShowLevels - show lines C
Trade Master는 MetaTrader 5용 전문가용 트레이딩 패널로, 매우 빠르고 정확한 수동 트레이딩을 위해 설계되었습니다. 거래 및 주문 시각화, 위험 및 수익 계산, 포지션 개설, 청산 및 수정, 손익분기점 설정, 트레일링 스톱, 부분 손절매 및 이익 실현, 시간 기반 청산, 자산 손절매 및 이익 실현 등 모든 기능을 단 한 번의 클릭, 단축키 사용 또는 차트에서 레벨을 직접 마우스로 드래그하는 방식으로 간편하게 이용할 수 있습니다. 직관적인 인터페이스 덕분에 필요한 시나리오를 빠르게 테스트하고 거의 즉시 애플리케이션을 사용할 수 있습니다. 급변하는 시장에서는 단 한 번의 지연도 금전적 손실로 이어집니다. 수동 계산이 아닌 거래 결정에 집중하세요. 트레이드 마스터를 통해 더욱 빠르고 효율적으로 거래하십시오. 데모 계정 버전 설치 | 사용자 가이드 특징 - 시장가 주문 및 지정가 주문 체결. 주문 체결 현황 시각화, 차트에서 레벨을 드래그하여 진입 가격, 손절매, 이익 실
Timeframe Trading Limiter
AL MOOSAWI ABDULLAH JAFFER BAQER
Timeframe Trading Limiter is a professional risk management and trade discipline utility designed for MetaTrader 5. It empowers traders to enforce strict, automated limits on the number of trades and the maximum allowable drawdown within each trading period, based directly on the chart timeframe selected. Whether you are a discretionary trader prone to overtrading, a prop firm challenge participant needing to adhere to strict rules, or an algorithmic trader running multiple strategies, this tool
Noize Absorption Index
Ekaterina Saltykova
Noize Absorption Index - is the manual trading system that measures the difference of pressure between bears forces and bulls forces. Green line - is a noize free index that showing curent situation. Zero value of index shows totally choppy/flat market.Values above zero level shows how powerfull bullish wave is and values below zero measures bearish forces.Up arrow appears on bearish market when it's ready to reverse, dn arrow appears on weak bullish market, as a result of reverse expectation.
Grid Builder 5
Oleg Remizov
5 (1)
The   Grid Builder MT5   utility is designed for placing a grid of pending orders of any complexity and will be an excellent tool in the hands of a trader who trades grid trading strategies. The tool has numerous settings that allow you to quickly and easily build a grid of orders with the specified parameters. All types of pending orders are supported: Buy Stop; Buy Limit; Sell Stop; Sell Limit. The script also allows you to delete a previously placed grid of orders in one click. If the "Delete
목표 수익 도달 시 자동 수익 실현 EquityTargetCloser   — 는 MetaTrader 5용 유틸리티 전문가 어드바이저(EA)로,   순자산(Equity)이 현재 잔고를 지정된 수익 금액만큼 초과하면 모든 시장 포지션을 청산하고 예약 주문을 삭제합니다. 모든 포지션을 청산한 후 목표는 자동으로 상향 조정됩니다. 새 임계값 = 새 잔고 + 지정된 수익. EA는 거래를 시작하지 않고 기존 포지션만 관리하여 수익을 확실하게 고정하고 축적된 자금을 보호합니다. MT4-version:  https://www.mql5.com/en/market/product/169850 작동 방식 전문가 어드바이저는   순자산(Equity)   을 동적 목표와 지속적으로 비교합니다. 목표 =   현재 잔고(Balance) + plusMoney   (미국 달러). 순자산이 이 금액 이상이 되면 보호 기능이 작동합니다.   모든 시장 포지션   (모든 심볼)을 청산합니다. 매개변수   Delete p
Goldenify
Saiful Izham Bin Hassan
Goldenify는 금(Gold) 및 기타 주요 심볼의 정밀 트레이딩을 위해 설계된 전문가용 퀀트 트레이딩 워크스테이션입니다. 클래식 기술적 분석과 패턴 인식, 고급 리스크 관리 프로토콜을 결합한 앙상블 의사결정 매니폴드(ensemble decision manifold)를 활용합니다. 이 시스템은 자본 보존과 실행 품질에 중점을 두며, 기관 수준의 동적 포지션 사이징 및 스텔스 오더 관리를 위한 모듈을 갖추고 있습니다. 주요 기능 Goldenify는 다층적 시장 분석 접근 방식을 사용하여 작동합니다: - 앙상블 전략: EA는 기술적 지표(MACD, RSI, EMA), 가격 액션 패턴, 변동성 분석을 결합하여 시장 상황을 평가합니다. - 기관 수준 리스크 관리: 분할 켈리(Kelly) 사이징, 성과 기반 동적 리스크 스케일링, 일일 이익 보호를 위한 자본 래칭(equity latching)을 포함합니다. - 스텔스 실행: 스텔스 손절매(STOP LOSS) 및 이익 실현(TAKE
Pro Gold System Indicator
PEDRO JOAQUIM GONCALVES GOMES
ADVANCED FUNCTIONALITIES: Trend Score (0-100) with visual bar Intelligent signals with adjustable strength (1-10) Risk management with automatic TP/SL Audible and visual alerts Price zones with smooth filling Multi-indicator analysis (RSI, ATR, BB, EMAs) DESIGN FEATURES Modern Visual: Smooth and well-spaced lines (EMA with 2-3px width) Vibrant and professional colors (Sky Blue, Orange, Gold) Modern arrows (code 233/234) for buy/sell signals Configurable dark/light theme Adjustable transparency f
## WPRV2 지표의 상세 설명 WPRV2는 전통적인 기술 분석 도구인 윌리엄스 퍼센트레인지(%R)를 개량한 버전입니다. 주식 시장이나 외환시장, 암호화폐 거래소 등 금융 시장에서 사용되며, 시장 동향을 분석하고 최적의 매매 타이밍을 결정하는데 도움이 됩니다. ### 지표의 목적 WPRV2 지표의 주요 목적은 현재 가격이 최근 고점과 저점에 비해 얼마나 가까운지 측정하는 것입니다. 이를 통해 트레이더들은 다음 사항을 파악할 수 있습니다. - 현재 가격이 역사적으로 높은 수준에 가까운가? - 혹은 역사적으로 낮은 수준에 접어드는 중인가? 이 정보를 통해 시장 변동성이나 현재 추세의 연속성을 신속하게 파악하여 올바른 판단을 내릴 수 있습니다. ### WPRV2 지표의 특징 #### 1. 그래픽 표현 방법 WPRV2 지표는 메인 자산 차트와 별도로 나타나며, 다음 두 줄로 구성됩니다. - 메인 라인(`WPR`) : 지정된 기간 동안 %R 값의 변화를 보여줍니다. - 추가적인
이 제품의 구매자들이 또한 구매함
Trade Assistant MT5
Evgeniy Kravchenko
4.43 (211)
거래당 위험 계산, 라인을 사용한 손쉬운 신규 주문, 부분 청산 기능을 통한 주문 관리, 7가지 유형의 트레일링 스탑 및 기타 유용한 기능을 제공합니다. 추가 자료 및 지침 설치 지침   -   애플리케이션 지침   -   데모 계정용 애플리케이션 평가판 라인 기능       - 차트에 개시선, 손절매, 차익실현을 표시합니다. 이 기능을 사용하면 새로운 주문을 쉽게 하고 개봉 전에 추가 특성을 볼 수 있습니다. 위기 관리       -       위험 계산 기능은 설정된 위험과 손절매 주문의 크기를 고려하여 새 주문의 볼륨을 계산합니다. 이를 통해 손절매 크기를 설정하고 동시에 설정된 위험을 존중할 수 있습니다. 로트 계산 버튼 - 위험 계산을 활성화/비활성화합니다. 필요한 위험 값은 위험 필드에 0에서 100 사이의 백분율 또는 예금 통화로 설정됩니다. 설정 탭에서 위험 계산 옵션을 선택합니다. $ 통화, % 잔액, % 지분, % 자유 마진, % 사용자 정의, % AB 이전
Trade Manager EA에 오신 것을 환영합니다. 이 도구는 거래를 보다 직관적이고 정확하며 효율적으로 만들기 위해 설계된 궁극적인 리스크 관리 도구 입니다. 단순한 주문 실행 도구가 아닌, 원활한 거래 계획, 포지션 관리 및 리스크 제어를 위한 종합 솔루션입니다. 초보자부터 고급 트레이더, 빠른 실행이 필요한 스캘퍼에 이르기까지 Trade Manager EA는 외환, 지수, 상품, 암호화폐 등 다양한 시장에서 유연성을 제공합니다. Trade Manager EA를 사용하면 복잡한 계산은 이제 과거의 일이 됩니다. 시장을 분석하고 진입, 손절 및 익절 수준을 차트의 수평선으로 표시한 후 리스크를 설정하면, Trade Manager가 이상적인 포지션 크기를 즉시 계산하고 SL 및 TP 값을 실시간으로 표시합니다. 모든 거래가 간편하게 관리됩니다. 주요 기능: 포지션 크기 계산기 : 정의된 리스크에 따라 거래 크기를 즉시 결정합니다. 간단한 거래 계획 : 진입, 손절, 익절을 위한
Local Trade Copier EA MT5
Juvenille Emperor Limited
4.96 (139)
Local Trade Copier EA MT5 를 사용하여 매우 빠른 거래 복사 경험을 해보세요. 1분 안에 간편하게 설정할 수 있으며, 이 거래 복사기를 사용하면 Windows 컴퓨터 또는 Windows VPS에서 여러 개의 MetaTrader 터미널 간에 거래를 0.5초 미만의 초고속 복사 속도로 복사할 수 있습니다. 초보자든 전문가든   Local Trade Copier EA MT5 는 다양한 옵션을 제공하여 사용자의 특정 요구에 맞게 맞춤 설정할 수 있습니다. 이는 수익 잠재력을 높이려는 모든 사람을 위한 최고의 솔루션입니다. 지금 사용해보시고 이것이 왜 시장에서 가장 빠르고 쉬운 무역용 복사기인지 알아보세요! 팁: 여기 에서 데모 계정에서 Local Trade Copier EA MT5 데모 버전을 다운로드하여 사용해 볼 수 있습니다. 다운로드한 무료 데모 파일을 MT5 >> File >> Open Data Folder >> MQL5 >> Experts 폴더에 붙여넣고 터
TradePanel MT5
Alfiya Fazylova
4.87 (157)
Trade Panel은 다기능 거래 도우미입니다. 이 애플리케이션에는 50개 이상의 수동 거래 기능이 포함되어 있으며 대부분의 거래 작업을 자동화할 수 있습니다. 구매하기 전에 데모 계정에서 데모 버전을 테스트할 수 있습니다. 데모 계정용 애플리케이션 체험판 다운로드: https://www.mql5.com/en/blogs/post/750865 . 전체 지침 여기 . 거래. 한 번의 클릭으로 거래를 수행할 수 있습니다: 리스크 자동 계산과 함께 예약 주문 및 포지션 열기. 한 번의 클릭으로 여러 주문 및 포지션 열기. 주문 그리드 열기. 예약 주문 및 포지션을 그룹별로 닫기. 포지션 방향 전환 (Buy 닫기 > Sell 열기, Sell 닫기 > Buy 열기). 포지션 잠금 (부족한 포지션을 열어 Buy와 Sell 포지션의 수량을 동일하게 만들기). 모든 포지션 한 번의 클릭으로 부분적으로 닫기. 모든 포지션의 테이크 프로핏과 스톱로스를 같은 가격 수준에 설정. 모든 포지션의 스톱로스를
베타 출시 Telegram to MT5 Signal Trader 는 곧 공식 알파 버전을 출시할 예정입니다. 일부 기능은 아직 개발 중이며, 작은 버그가 발생할 수 있습니다. 문제가 있으면 꼭 보고해 주세요. 여러분의 피드백은 소프트웨어 개선에 도움이 됩니다. Telegram to MT5 Signal Trader 는 Telegram 채널 또는 그룹의 거래 신호를 자동으로 MetaTrader 5 계정으로 복사하는 강력한 도구입니다. 공개 및 비공개 채널을 모두 지원하며, 여러 신호 제공자를 여러 MT5 계정에 연결할 수 있습니다. 소프트웨어는 빠르고 안정적으로 동작하며, 복사된 거래를 완벽히 제어할 수 있습니다. 인터페이스는 깔끔하며 대시보드와 차트가 시각적으로 구성되어 있고, 직관적인 네비게이션이 가능합니다. 여러 Signal Account를 관리하고, 공급자별 설정을 세밀하게 조정하며, 모든 동작을 실시간으로 모니터링할 수 있습니다. 필수 조건 MQL의 제한으로 인해 EA는 Te
Quant AI Agents
Ho Tuan Thang
5 (1)
Quant AI Agents are independent trading Expert Advisors. Instead of trading using a fixed strategy like other conventional EAs, Quant AI Agents   is a   multi-agent AI trading framework   that turns natural-language strategy prompts into live.  WANT THE SAME RESULTS AS MY LIVE SIGNAL?   Use the exact same brokers I do:   IC MARKETS , IC TRADING   .  Unlike the centralized stock market, Forex has no single, unified price feed.  Every broker sources liquidity from different providers, creating un
AI Agent Supervisor is NOT an Expert Advisor. AI Agent Supervisor   is a   multi-agent AI risk & portfolio supervisor   that watches every EA on your account and intervenes in real time.  WANT AN AI PORTFOLIO MANAGER WATCHING YOUR FLEET 24/7?   Run your fleet on the same brokers I do:   IC MARKETS , IC TRADING   .  Unlike the centralized stock market, Forex has no single, unified price feed.  Every broker sources liquidity from different providers, creating unique data streams. The Supervisor r
Trade Dashboard MT5
Fatemeh Ameri
4.95 (129)
Trade Dashboard simplifies how you open, manage, and control your trades, with built-in lot size calculation. It allows you to execute trades, manage risk, and control positions directly on the chart, with tools such as partial close, breakeven, and trailing stop. Designed to reduce manual work and help you stay focused on your trading decisions. A demo version is available for testing. Detailed explanations of features are provided within the MQL5 platform. Installation instructions are include
Exp COPYLOT CLIENT for MT5
Vladislav Andruschenko
3.91 (33)
MetaTrader 5용 전문 트레이드 복사기 MetaTrader 용 빠르고 전문적이며 신뢰할 수 있는 트레이드 복사기 입니다. COPYLOT 은 MT4와 MT5 터미널 간의 Forex 거래 복사를 지원하며, Hedge 및 Netting 계좌를 모두 지원합니다. COPYLOT MT5 버전 지원 구성: - MT5 Hedge → MT5 Hedge - MT5 Hedge → MT5 Netting - MT5 Netting → MT5 Hedge - MT5 Netting → MT5 Netting - MT4 → MT5 Hedge - MT4 → MT5 Netting MT4 버전 전체 설명 + DEMO + PDF 구매 방법 설치 방법 로그 파일 확인 방법 테스트 및 최적화 방법 Expforex의 모든 제품 MT4 터미널로도 거래를 복사할 수 있습니다(MT4 → MT4, MT5 → MT4): COPYLOT CLIENT for MT4 COPYLOT은 2개, 3개, 심지어 10개의 터미널과 동시에 작동할
Premium Trade Manager - MetaTrader 5를 위한 빠르고 규율 있는 거래 관리 도구 Premium Trade Manager 는 결정에만 집중하고 나머지 루틴은 패널이 처리하길 원하는 트레이더를 위한 도구입니다. 크기 계산, 주문 배치, 분할 청산, 트레일링, 뉴스 대응, 프롭 펌 한도 관리까지, 모든 거래에서 동일하게 규율 있는 방식으로 실행됩니다. MetaTrader 5용 빠른 온차트 패널로, 모든 거래에서 기계적인 작업을 완전히 없애줍니다. 방향, 종목, 타이밍은 당신이 결정합니다. 패널이 리스크에 맞춰 포지션 크기를 계산하고, 스톱과 타겟이 설정된 주문을 배치하고, 분할 청산으로 스케일아웃하고, 나머지를 트레일합니다. 펀디드 트레이더에게는 한 걸음 더 나아갑니다. 8개 주요 외환 프롭 펌의 실제 규칙을 내장하고, 각 한도까지 남은 거리를 실시간으로 표시하며, 하드 한도를 위반할 주문은 차단합니다. 구매 전에 직접 체험해 보세요. 인터랙티브 walkthro
Farmed Hedge Yield Farming | All Markets (Manual - Hybrid - Semi/Automated EA) MULTI-ASSET SUPPORT Trade any asset available on your broker - Forex: Major, Minor, Exotic pairs - Crypto: BTC, ETH, XRP, SOL, BNB - Stocks: Apple, Tesla, Amazon, Google, etc. - Commodities: Gold, Silver, Oil, Gas - Indices: US30, NAS100, SPX500, DAX40 - Any CFD your broker offers VERIFIED TRADING RESULTS - Farmed Hedge Yield Axi Copy:  https://www.mql5.com/en/signals/2356376 - Farmed Hedge Yield Exn Copy:   https:/
Footprint Chart Pro — Professional OrderFlow EA for MetaTrader 5 Version 6.34 | Professional tool for real traders | Institutional-Grade Visualization DEMO USERS - PLEASE SELECT EVERY TICK / REAL TICK WHEN TESTING AND YOU HAVE DOWNLOADED HISTORICAL DATA. IF YOU SEE A WAITING SCREEN AND IT IS NOT DOWNLOADING, IT MEANS YOU HAVE LOW HISTORICAL DATA. TRY 1 MIN AND 5 MIN FIRST ON 1 DAY DATA. ONE DAY DATA SHOULD BE THE NEWEST AND MOST CURRENT DATE. PLEASE WAIT UNTIL THE MARKET HAS ROLLED OVER PERIOD.
The product will copy all telegram signal to MT5 ( which you are member) , also it can work as remote copier.  Easy to set up, copy order instant, can work with almost signal formats, image signal,  s upport to translate other language to English Work with all type of channel or group, even channel have "Restrict Saving Content", work with  multi channel, multi MT5 Work as remote copier: with signal have ticket number, it will copy exactly via ticket number. Support to backtest signal. How to s
The News Filter MT5
Leolouiski Gan
4.78 (23)
이 제품은 뉴스 시간 동안 모든 전문가 어드바이저 및 수동 차트를 필터링하여 수동 거래 설정이나 다른 전문가 어드바이저가 입력한 거래가 파괴될 수 있는 급격한 가격 상승으로부터 걱정하지 않아도 됩니다. 이 제품은 또한 뉴스 발표 전에 열린 포지션과 대기 주문을 처리할 수 있는 완전한 주문 관리 시스템이 함께 제공됩니다.   The News Filter  를 구매하면 더 이상 내장 뉴스 필터에 의존할 필요가 없으며 이제부터 모든 전문가 어드바이저를 여기서 필터링할 수 있습니다. 뉴스 선택 뉴스 소스는 Forex Factory의 경제 캘린더에서 얻어집니다. USD, EUR, GBP, JPY, AUD, CAD, CHF, NZD 및 CNY와 같은 어떤 통화 기준으로 선택할 수 있습니다. Non-Farm (NFP), FOMC, CPI 등과 같은 키워드 식별을 기준으로 선택할 수도 있습니다. 저, 중, 고 영향을 가지는 뉴스를 필터링할 수 있도록 선택할 수 있습니다. 차트와 관련된 뉴스만 선
Prop Firm Os
Gayathiri Gopalakrishnan
5 (1)
PROP FIRM OS Structured Trading Assistant for MetaTrader 5 PROP FIRM OS is a structured trading assistant designed for MetaTrader 5 users who prefer rule-based market analysis and organized trading workflows. The Expert Advisor combines market analysis tools, scanner functions, dashboard monitoring, alerts, risk-control settings, and trade management features inside one system. PROP FIRM OS is designed to help traders follow selected rules, filters, and monitoring conditions during trading activ
Custom Alerts AIO: 다중 시장을 동시에 모니터링 – 설정 없이 즉시 사용 가능 개요 Custom Alerts AIO 는 복잡한 설정 없이 즉시 사용할 수 있는 통합 시장 모니터링 도구입니다. FX Power, FX Volume, FX Dynamic, FX Levels, IX Power 등 필요한 모든 지표가 내장되어 있어 별도의 설치나 구성 없이 알림 기능을 바로 사용할 수 있습니다. 차트 그래픽 없이 작동하며, Forex, 금속, 지수, 암호화폐 등 주요 자산군을 모두 지원합니다. 주식(Symbols)은 별도로 입력하여 추가할 수 있으나, MetaTrader에서는 일반적으로 제한적으로만 사용됩니다. 1. 왜 Custom Alerts AIO를 선택해야 하나요? 추가 라이선스가 필요 없습니다 • 모든 Stein Investments 지표가 내장되어 있어 별도 구매가 필요 없습니다. • 즉시 알림 기능을 시작할 수 있어 빠르고 간편합니다. 모든 시장을 하나의 도구로
Trade copier MT5
Alfiya Fazylova
4.55 (44)
Trade Copier는 거래 계정 간의 거래를 복사하고 동기화하도록 설계된 전문 유틸리티입니다. 복사는 공급자의 계정/단말기에서 동일한 컴퓨터 또는 vps에 설치된 수신자의 계정/단말기로 발생합니다. 프로모션 - 이미 "Trade copier MT5"를 구매하셨다면, "Trade copier MT4"를 무료로 받으실 수 있습니다 (MT4 → MT5 및 MT4 ← MT5 복사용). 조건에 대한 자세한 정보를 원하시면, 개인 메시지를 통해 저희에게 문의해 주시기 바랍니다! 구매하기 전에 데모 계정에서 데모 버전을 테스트할 수 있습니다. 데모 버전 여기 . 전체 지침 여기 . 주요 기능 및 이점: 복사기는 "МТ5> МТ5", "МТ4> МТ5", "МТ5> МТ4" 복사를 지원합니다. 복사기는 데모 계정 > 실 계정, 실 계정 > 데모 계정, 데모 계정 > 데모 계정 및 실제 계정 > 실 계정 복사를 지원합니다. 복사기는 읽기 전용 암호가 적용된 투자자 계정에서 복사를 지원합니다. 하
AntiOverfit PRO MT5
Enrique Enguix
5 (6)
EA를 구매하기 전에, 이 시스템이 정말 버티는지 아니면 백테스트에서 운 좋게 좋아 보였던 것뿐인지 먼저 확인하세요. 대부분의 로봇은 보기 좋은 백테스트와 함께 판매됩니다. 우상향 곡선. 좋은 Profit Factor. 의심할 이유가 거의 없어 보입니다. 그런데도 그런 EA들 중 많은 수가 시장이 그 과거 구간처럼 움직이지 않기 시작하는 순간 무너지기 시작합니다. 왜 그럴까요? 백테스트가 증명하는 것은 딱 한 가지뿐이기 때문입니다. 그 전략이 특정한 하나의 가격 경로에서는 작동했다는 것. 다른 경로에서도 버틴다는 뜻은 아닙니다. 견고하다는 뜻도 아닙니다. 당연히 당신의 돈을 쓸 가치가 있다는 뜻도 아닙니다. 당신이 EA를 사는 이유는 과거의 예쁜 곡선을 감상하기 위해서가 아닙니다. 계속 변하는 시장에서 실제로 쓰기 위해서입니다. AntiOverfit PRO가 하는 일 AntiOverfit PRO는 MetaTrader 5용 Expert Advisor가 정말 탄탄한지, 아니면 특정한
파워 캔들 전략 스캐너 - 자체 최적화 다중 종목 설정 찾기 도구 파워 캔들 전략 스캐너는 마켓 워치에 등록된 모든 종목에 대해 파워 캔들 지표와 동일한 자체 최적화 엔진을 동시에 실행합니다. 하나의 패널에서 현재 통계적으로 거래 가능한 종목, 각 종목별 최적의 전략, 최적의 손절매/익절 조합을 알려주며, 새로운 신호가 발생하면 즉시 알림을 전송합니다. 이 도구는 Stein Investments 에코시스템의 일부입니다. 18개 이상의 도구와 함께 당신의 1대1 AI 트레이딩 멘토 Max.  항상 대기 중, 모든 인디케이터를 깊이 있게 이해, 무언가를 차근차근 생각해보고 싶은 순간에 도움을 줍니다.  https://stein.investments 에서 만나보세요 완벽한 시장 모니터링. 종목당 3,000건 이상의 자동 최적화. 2가지 알림 유형. 한 번의 클릭으로 차트를 전환하고 바로 거래하세요. 이 도구가 필요한 이유 대부분의 다중 종목 스캐너는 가격 변동만 보여줍니다. 티커별
Timeless Charts
Samuel Manoel De Souza
5 (6)
Timeless Charts is an all-in-one trading utility for professional traders. It combines custom chart types such as Seconds Charts and Renko with advanced order flow analysis using Footprints , Clusters , Volume Profiles , VWAP studies, and anchored analysis tools for deeper market insight. Trading and position management are handled directly from the chart through an integrated trade management panel , while Market Replay and Virtual Accounts provide environments for practicing trading skills and
YuClusters
Yury Kulikov
4.93 (42)
Attention: You can view the program operation in the free version  YuClusters DEMO .  YuClusters is a professional market analysis system. The trader has unique opportunities to analyze the flow of orders, trade volumes, price movements using various charts, profiles, indicators, and graphical objects. YuClusters operates on data based on Time&Sales or ticks information, depending on what is available in the quotes of a financial instrument. YuClusters allows you to build graphs by combining da
Trade Manager DaneTrades
Levi Dane Benjamin
4.28 (29)
거래 관리자는 위험을 자동으로 계산하는 동시에 거래를 빠르게 시작하고 종료하는 데 도움을 줍니다. 과잉 거래, 복수 거래 및 감정 거래를 방지하는 데 도움이 되는 기능이 포함되어 있습니다. 거래를 자동으로 관리할 수 있으며 계정 성과 지표를 그래프로 시각화할 수 있습니다. 이러한 기능은 이 패널을 모든 수동 거래자에게 이상적으로 만들고 MetaTrader 5 플랫폼을 향상시키는 데 도움이 됩니다. 다중 언어 지원. MT4 버전  |  사용자 가이드 + 데모 트레이드 매니저는 전략 테스터에서 작동하지 않습니다. 데모를 보려면 사용자 가이드로 이동하세요. 위기 관리 % 또는 $를 기준으로 위험 자동 조정 고정 로트 크기 또는 거래량과 핍을 기반으로 한 자동 로트 크기 계산을 사용하는 옵션 RR, Pips 또는 Price를 사용한 손익분기점 손실 설정 추적 중지 손실 설정 목표 달성 시 모든 거래를 자동으로 마감하는 최대 일일 손실률(%)입니다. 과도한 손실로부터 계정을 보호하고 과도한
SMC Trade Pilot MT5 Smart Money Concepts 트레이더를 위한 반자동 트레이딩 어시스턴트. 차트 스크린샷이 포함된 신호를 Telegram에서 받고, 한 번의 탭으로 트레이드를 실행하세요. 컴퓨터에서 떨어져 있어도 휴대폰에서 포지션을 관리할 수 있습니다. 해결하는 문제 Smart Money 셋업은 당신을 기다리지 않습니다. Order Blocks와 Liquidity Sweeps는 런던 개장, 뉴욕 개장 또는 아시아 세션 중에 형성되며, 이때 당신은 업무 중이거나 회의 중이거나 화면에서 떨어져 있을 때가 많습니다. 차트를 확인할 즈음이면 셋업은 이미 지나갔습니다. SMC Trade Pilot은 당신의 휴대폰을 실시간 트레이딩 콕핏으로 바꿔줍니다. 어시스턴트는 SMC 신호를 찾기 위해 차트를 24시간 스캔합니다. 셋업이 형성되면 완전한 트레이드 티켓을 Telegram 채팅에 전송합니다: 차트 스크린샷, 방향, 진입 가격, 권장 손절, 권장 익절, 품질 점수. 결
Seconds Chart MT5
Boris Sedov
4.59 (17)
Seconds Chart - MetaTrader 5에서 초 단위 차트를 생성하는 독특한 도구입니다. Seconds Chart 를 사용하면 초 단위로 설정된 타임프레임으로 차트를 작성할 수 있어, 표준 분 또는 시간 단위 차트에서는 불가능한 유연성과 정밀한 분석이 가능합니다. 예를 들어, S15 타임프레임은 15초 동안의 캔들로 구성된 차트를 의미합니다. 사용자 정의 심볼을 지원하는 모든 인디케이터와 전문가 어드바이저를 사용할 수 있습니다. 이를 사용하는 것은 표준 차트에서 거래하는 것만큼 편리합니다. 표준 도구와 달리, Seconds Chart 는 초고속 타임프레임에서도 높은 정확도와 지연 없이 작업할 수 있도록 지원합니다. 무료 데모: Seconds Chart v2.29 Demo.ex5 무료 데모를 다운로드하고 직접 확인하십시오: 완전한 기능 - 모든 기능을 제한 없이 사용 가능 24시간 테스트 - 정확성과 편리성을 평가하기에 충분한 시간 데모 계정만 - 대부분의 브로커에서 쉽게
================================================================================ POC BREAKOUT - V20.72. Full Professional Grade Toolkit ================================================================================ POC Breakout is a full MetaTrader 5 trading dashboard for discretionary traders who want breakout signals, Point of Control (POC) context, volume profiles, order flow, market structure, news, alerts, and advanced trade planning in one professional workspace. Attached directly to you
Copy Cat More Trade Copier MT5 (복사 고양이 MT5) 는 오늘날의 거래 과제를 위해 설계된 로컬 거래 복사기이자 완전한 위험 관리 및 실행 프레임워크입니다. 프롭펌 챌린지부터 개인 포트폴리오 관리까지, 견고한 실행, 자본 보호, 유연한 구성 및 고급 거래 처리의 조합으로 모든 상황에 적응합니다. 복사기는 마스터(송신자)와 슬레이브(수신자) 모드 모두에서 작동하며, 시장 주문과 예약 주문, 거래 수정, 부분 청산 및 헷지 청산 작업의 실시간 동기화를 제공합니다. 데모 및 실계좌, 거래 또는 투자자 로그인과 호환되며, EA, 터미널 또는 VPS가 재시작되어도 지속적인 거래 메모리 시스템을 통해 복구를 보장합니다. 고유 ID로 여러 마스터와 슬레이브를 동시에 관리할 수 있으며, 브로커 간 차이는 접두사/접미사 조정 또는 사용자 정의 심볼 매핑을 통해 자동으로 처리됩니다. 매뉴얼/설정  | Copy Cat More MT4 | 채널  특별 기능: 설정이 간편함 —
MT5 to Telegram Signal Provider 는 사용하기 쉽고 완전히 커스터마이즈 가능한 유틸리티로, 특정 신호를 Telegram의 채팅, 채널 또는 그룹으로 전송하고, 귀하의 계정을 신호 제공자 로 만듭니다. 경쟁 제품과 달리 DLL 임포트를 사용하지 않습니다. [ 데모 ] [ 매뉴얼 ] [ MT4 버전 ] [ 디스코드 버전 ] [ 텔레그램 채널 ]  New: [ Telegram To MT5 ] 설정 단계별 사용자 가이드 가 제공됩니다. 텔레그램 API에 대한 지식은 필요하지 않습니다; 개발자가 제공하는 모든 것이 필요합니다. 주요 특징 구독자에게 보낸 주문 상세 정보를 커스터마이즈할 수 있습니다. 예를 들어, 브론즈, 실버, 골드와 같은 계층 구독 모델을 만들 수 있습니다. 골드 구독에서는 모든 신호를 받습니다. id, 심볼, 또는 코멘트로 주문을 필터링할 수 있습니다. 주문이 실행된 차트의 스크린샷이 포함됩니다 보낸 스크린샷에 닫힌 주문을 그려 추가 검증을 합니다
Advanced Dashboard Ultra
Mirel Daniel Gheonu
5 (3)
MT5용 통계 대시보드 & 저널 ULTRA (Stats Dashboard & Journal ULTRA) 완벽한 트레이딩 지휘 본부: 분석, 자동화 및 뉴스 인텔리전스. Stats Dashboard ULTRA는 Pro 분석 도구의 궁극적인 진화형입니다. 이는 MetaTrader 5를 전문 트레이딩 스테이션으로 변모시키며, 기관급 성과 분석과 자동화된 뉴스 보호 및 고급 심리 지표를 결합합니다. 완전한 통제력을 원하는 수동 트레이더와 EA 포트폴리오 관리자를 위해 설계되었습니다. ULTRA 버전의 새로운 기능 뉴스 인텔리전스 엔진 (News Intelligence Engine): 뉴스를 보기만 하지 말고 분석하십시오. 대시보드는 과거 뉴스 이벤트가 오픈된 포지션에 어떤 영향을 미쳤는지 시뮬레이션하여 포지션을 보유할지 청산할지 알려줍니다. EA 봇 가드 (자동 보호): 중요도가 높은 뉴스(High-Impact News) 발표 중에 다른 전문가 자문(EA)을 자동으로 일시 중지하고 시장이
Signal TradingView to MT5 Pro Automator TradingView와 MetaTrader 5 간의 즉각적인 전문 실행 TradingView 알림과 MT5의 실제 실행을 연결하는 가장 강력한 커뮤니케이션 브리지로 거래 전략을 자동화하세요. 속도, 유연성 및 완벽한 위험 관리를 요구하는 트레이더를 위해 설계된 이 Expert Advisor는 모든 알림 메시지를 정확한 시장가 또는 지정가 주문으로 변환합니다. 강점 및 이점 범용 파싱 엔진(독점 기술): 모든 알림 형식에서 데이터를 자동으로 인식하고 추출할 수 있는 고급 기술입니다. 단일하고 엄격한 형식에 얽매일 필요가 없습니다. 시스템은 심볼, 액션, 가격, SL 및 TP를 자동으로 이해합니다. 실시간 실행: 지연 시간을 최소화하도록 최적화된 1초 미만의 초고속 폴링 기술. 신호 수신 후 몇 밀리초 내에 주문 실행이 이루어집니다. 기관 수준의 위험 관리: 다음 기준에 따른 자동적이고 정확한 로트(Lot) 크기 계
Telegram to MT5 Multi-Channel Copier 는 Telegram 채널의 트레이딩 시그널을 MetaTrader 5로 자동으로 직접 복사합니다. 봇도, 브라우저 확장 프로그램도, 수동 복사도 필요 없습니다. Telegram에서 시그널을 받으면 EA가 몇 초 안에 터미널에서 거래를 엽니다. 제품은 두 가지 구성 요소를 포함합니다: Telegram 채널을 듣는 Windows 애플리케이션과 MT5 터미널에서 시그널을 실행하는 이 Expert Advisor입니다. MT4 버전도 사용할 수 있습니다. 설치 가이드 및 애플리케이션 다운로드: https://www.mql5.com/en/blogs/post/768988 작동 방식 Windows 애플리케이션은 봇이 아닌 사용자 본인의 API 자격 증명을 사용하여 Telegram에 연결합니다. 즉, 비공개 및 VIP 채널을 포함하여 가입한 모든 채널, 그룹 또는 포럼 토픽을 읽을 수 있습니다. 시그널을 감지하면 이를 파싱하여 EA로
제작자의 제품 더 보기
This indicator is designed for M1 timeframe and shows: Sum of points when the price goes up (Green Histogram). Sum of points when the price goes down (Red Histogram).  In other words, by the number and ratio of bullish points to bearish ones, you can do a technical analysis of the state of the market. If the green histogram prevails over the red one, you can conclude that at the moment the buyers are stronger than the sellers, and vice versa, if the red histogram prevails over the green, the se
This Multi TimeFrame indicator is based on the "Fractals" classical indicator. 2 Inputs: TimeFrame1; TimeFrame2; You can put any available TimeFrame values (from M1 (Period_M1) to MN1 (Period_MN1)) equal or greater ( >= ) than the Period of the current Time Frame. The last Fractals will shown as color lines (Dots Line) of Support and Resistance for the Price moving.
This is a Multi-Time indicator which allows to display RSI and Stochastic indicators from upper timeframes on a single chart. As an example: a single chart EURUSD M5 and RSI (blue line) and Stochastic (yellow line) from H1. Red Histogram is representing Lower trend and Green Histogram is representing Upper trend.
When you put this Multi TimeFrame Parabolic SAR indicator on the chart it will automatically use Parabolic SAR from next available 3 timeframes. Green arrow will show the beginning of Up trend and Red arrow will show the beginning of Down trend. If AlertsEnabled = true, the indicator will show the Alert (message window) with a text like this: "Price going Down on ", Symbol(), " - ", Period(), " min", " price = ", Bid; If eMailEnabled = true the Indicator will send you an eMail with the same text
The zero line is characterized the Flat trend. V-shaped impulse indicates the entrance to the opposite direction. U-shaped impulse = entry orders in the same direction. If AlertsEnabled = true, the indicator will show the Alert (message window) with a text like this: "Price going Down on ", Symbol(), " - ", Period(), " min", " price = ", Bid; If eMailEnabled = true the indicator will send you an eMail with the same text an Alert message with subject: "Trinity-Impolse" (of course you have to chec
The indicator displays the usual Moving Average with input parameters: maPeriod_1; maMethod_1; maAppPrice_1. Then it calculates and displays MA on MA1 with input parameters: maPeriod_2; maMethod_2. Then it calculates and displays MA on MA2 with input parameters: maPeriod_3; maMethod_3. If AlertsEnabled = true the Indicator will show the Alert (message window) with a text like this: "Price going Down on ", Symbol(), " - ", Period(), " min", " price = ", Bid; If eMailEnabled = true the Indicator w
Multi TimeFrame Indicator "MTF CCI Trigger" based on the Commodity Channel Index from the upper TF (input parameter "TimeFrame") yellow line. Aqua line is representing ATR envelopes from the current TF. Green and Red arrows is triggered by CCI and represented UP and DOWN trends accordingly.
The BBImpulse indicator is based on the standard Moving Average indicator. You have MA input parameters: maPeriod - Moving Average period; maMODE - Moving Average mode (0 = MODE_SMA; 1 = MODE_EMA; 2 = MODE_SMMA; 3 = MODE_LWMA); maPRICE - Applied price (0=PRICE_CLOSE; 1=PRICE_OPEN; 2=PRICE_HIGH; 3=PRICE_LOW; 4=PRICE_MEDIAN; 5=PRICE_TYPICAL; 6=PRICE_WEIGHTED). Green Histogram is representing an UP-trend, Red Histogram is representing a Down-trend.
Multi TimeFrame indicator MTF ADX with Histogram shows ADX indicator data from the TF by your choice. You may choose a TimeFrame equal or greater than current TF. Yellow line is representing a price trend from the upper TF. Green line is representing +DI from the upper TF. Red line is representing -DI from the upper TF. Green histogram is displaying an Up-trend. Red histogram is displaying a Down-trend.
This Indicator creates 2 white lines based on Exponential Moving Averag e of High and Low prices. You can regulate how many bars will be involved in the calculation with input parameter HL_Period. Red and Blue arrows are displaying the moment to go Short and Long trades accordingly.
The most common way to interpreting the price Moving Average is to compare its dynamics to the price action. When the instrument price rises above its Moving Average, a buy signal appears, if the price falls below its moving average, what we have is a sell signal. To avoid a spontaneous entries one may use this update from Moving Average Indicator = Stepper-MA.
Envelopes technical Indicator is formed with two Moving Averages one of which is shifted upward and another one is shifted downward. Envelopes define the upper and the lower margins of the price range. Signal to sell appears when the price reaches the upper margin of the band; signal to buy appears when the price reaches the lower margin. To avoid a spontaneous entries one may use this update from Envelopes Indicator = Envelopes-Stepper.
The interpretation of the Bollinger Bands is based on the fact that the prices tend to remain in between the top and the bottom line of the bands. Abrupt changes in prices tend to happen after the band has contracted due to decrease of volatility; If prices break through the upper band, a continuation of the current trend is to be expected; If the pikes and hollows outside the band are followed by pikes and hollows inside the band, a reverse of trend may occur; The price movement that has starte
Fibonacci sequence is defined by integer sequence: 0, 1, 1, 2, 3, 5, 8, 13, 34, 55, 89, 144, ... By definition, it starts from 0 and 1, the next number is calculated as a sum of two previous numbers. Instead of the standard moving average, the indicator uses the caluclation of average price in form: Bar0 + Bar1 + Bar2 + Bar3 + Bar5 + Bar8 + Bar13 +... Input parameters:  FiboNumPeriod (15) - Fibonacci period; nAppliedPrice (0) - applied price (PRICE_CLOSE=0; PRICE_OPEN=1; PRICE_HIGH=2; PRICE_LOW=
This indicator present a main Moving Average line with input parameters maPeriod_1, maMethod_1 and maAppPrice_1. The second line will be a calculation of the Moving Average data of a first line with input parameters maPeriod_2, maMethod_2. The third line will be a calculation of the Moving Average data of a second line with input parameters maPeriod_3, maMethod_3. To avoid a spontaneous entries one may use this indicator-stepper.
Average Bar
Leonid Basis
This indicator (as almost all others) is based on classical Moving Averages. It shows the Average Bar under the current bar colored in aqua or over the current bar colored in orange. Input Parameters: ma_Period and ma_Method. The Average Bar maybe helpful to predict where the price will move in the nearest future. Of course, this "near future" depends of the current time frame.
Buy when the market is falling and sell when the market is rising. When the market is moving down you start observing and looking for buy signals. When the market is moving up you start looking for sell signals. This indicator points to the moments to Buy (Blue arrow) and to Sell (Orange arrow). Two input parameters: barsNumber and step for optimization (depending on symbol and Time Frame).
This indicator shows: A green light in case the price goes up; A red light in case the price goes down; A yellow light in case there are a sideways trend. A sideways trend is the horizontal price movement that occurs when the forces of supply and demand are nearly equal. This typically occurs during a period of consolidation before the price continues a prior trend or reverses into a new trend
Sum of Ticks
Leonid Basis
This indicator is created for M1 timeframe. It shows how many ticks has occurred during current minute and ( after the slash) the sum of points Up (aqua color) and Down (orange color). In times of a high trading activity a grow up number of ticks Up and Down will signal of a big move of the price in the near future. In times of a high trading activity a grow up number of sum of points Up and Down will signal of a big move of the price in the near future too.
CCI Envelopes
Leonid Basis
Two yellow lines. This is similar to classical Envelopes but with automatic deviation. The Envelopes indicator is   a tool that attempts to identify the upper and lower bands of a trading range. Aqua line. This is a classical Commodity Channel Index added to the Envelopes on the chart, not in a separate window. The Commodity Channel Index ( CCI ) is a technical   indicator   that measures the difference between the current price and the historical average price.
Probability
Leonid Basis
Probability deals with the likelihood of an event happening.   Forex   probability indicates a possibility at a specific time. This is because the forex market is highly volatile, and predicting future events affecting it is impossible. This indicator will show a positive number above the current High or negative number under the current Low as a probability of the trend. Higher time frames usually show a higher probability, even more then 100%.
Envelopes is an excellent indicator when the market is trending. Open Long position when the ClosePrice crossed the upper Aqua band. Close Long position when the Price crossed the upper Yellow band moving down. Open Short position when the ClosePrice crossed the lower Aqua band. Close Short position when the Price crossed the lower Yellow band moving up.
Moving Average Bars is a self-explanatory indicator with one input parameter: nPeriod. When the previous Price Close is above the previous indicator Bar, the probability to go Long is very high.   When the previous Price Close is under the previous indicator Bar, the probability to go Short is very high.
This indicator is based on the same idea as https://www.mql5.com/en/market/product/2406 , but instead of Average Bars it uses series or Fibonacci sequence. When the previous Price Close is above the previous indicator Bar, the probability to go Long is very high. When the previous Price Close is under the previous indicator Bar, the probability to go Short is very high.
This indicator is based on two ideas: Correlations between 5 main currency pairs: EURUSD, GBPUSD, USDCHF, USDJPY, USDCAD; US Dollar Index = the value of the United States dollar relative to a basket of foreign currencies. The use of the indicator is the same as classical  Commodity Channel Index  (CCI) indicator. CCI is calculated with the following formula:  (Typical Price - Simple Moving Average) / (0.015 x Mean Deviation) (Typical Price - Simple Moving Average) / (0.015 x Mean Deviation)
Tick by Tick
Leonid Basis
A  tick  is a measure of the minimum upward or downward movement in the  price  of a security. A  tick  can also refer to the change in the  price  of a security from one trade to the next trade.  This indicator will show amounts of ticks when the price goes up and down. This indicator is designed for M1 time frame and shows: Sum of points when the price goes up (Green Histogram). Sum of points when the price goes down (Red Histogram). 
This indicator is a combination of 2 classical indicators MA and RVI. The Relative Vigor Index (RVI) is a momentum indicator used in technical analysis that measures the strength of a trend by comparing a security's closing price to its trading range while smoothing the results using a simple moving average   The input parameter  counted_bars  determines how many bars the indicator's lines will be visible. The input parameter MaRviPeriod  is used for MA and RVI calculation.
This indicator is a combination of 2 classical indicators: MA and Force Index. The input parameter  counted_bars  determines on how many bars the indicator lines will be visible. The input parameter  MaForcePeriod  is used for MA and Force calculation. You may go Long if the current price crossed Up the Ribbon (HISTOGRAM)  and you may go Short if the current price crossed Down the Ribbon (HISTOGRAM)
This indicator is a combination of 2 classical indicators: MA and CCI. Two moving averages form Upper and Lower bands. The input parameter  counted_bars  determines on how many bars the indicator's lines will be visible. The input parameter  barsNum  is used for MA and CCI calculation.
This indicator is using 2 classical indicators: Commodity Channel Index from the higher TF (which you may change using input parameter TimeFrame ) and Average True Range from the current TF. The Green ribbon indicates the upper trend and the Red ribbon indicates the down trend. Buy when the Yellow line crosses the Upper bound (Aqua line). Sell when the Yellow line crossover the Lower bound (Aqua line).
필터:
리뷰 없음
리뷰 답변