Important Levels Indicator MT5
- 지표
-
Andrey Tatarinov
 Robot for trading on news
https://www.mql5.com/en/market/product/10427
Trend Hunter indicator with the ability to send signals to Telegram - 버전: 1.2
- 업데이트됨: 8 11월 2023
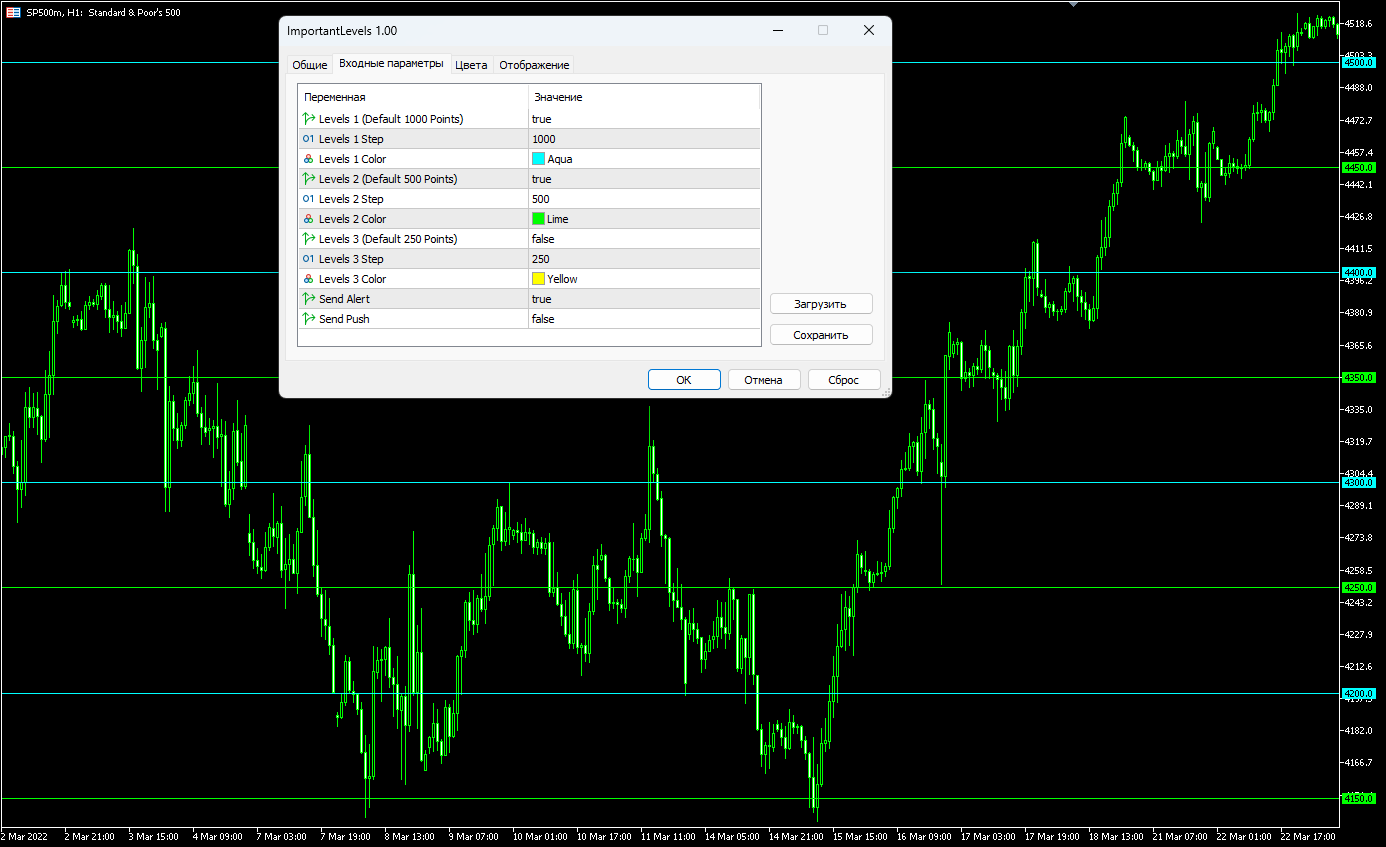
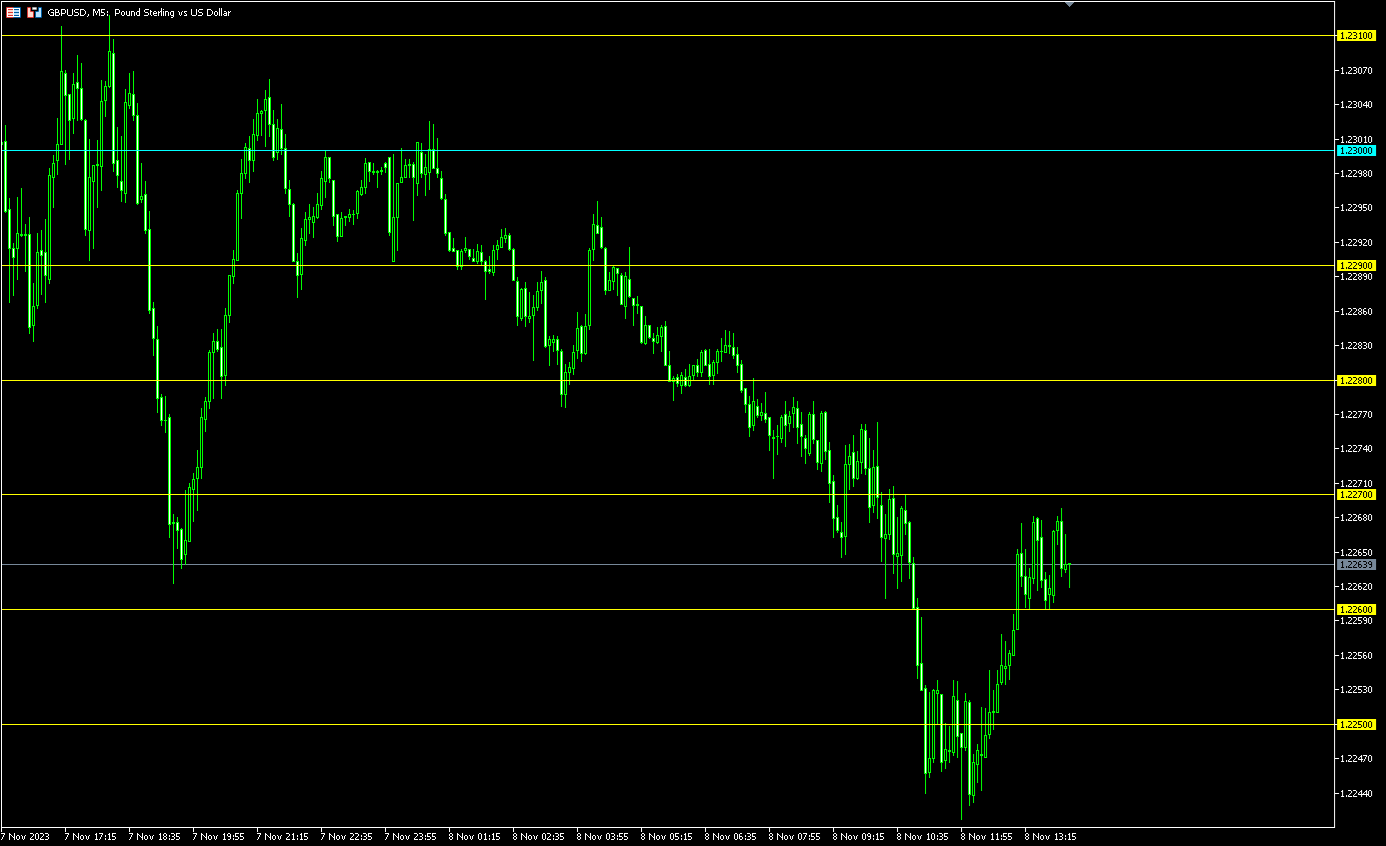
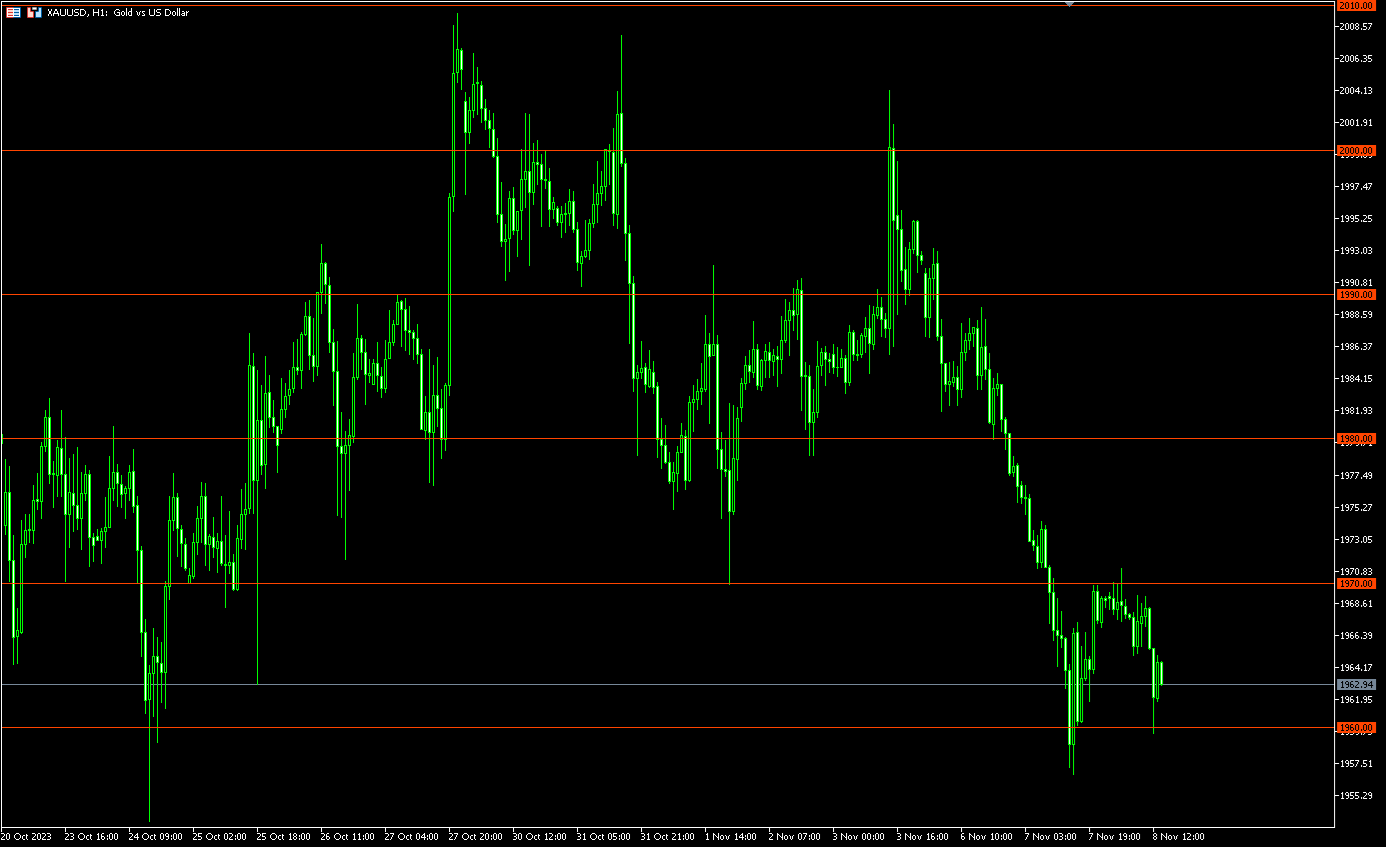
지표는 차트에 중요한 기술 수준을 표시합니다. 이 수준은 가격 움직임에 대한 지지 또는 저항 역할을 합니다.
가장 중요한 수준은 100점과 50점의 배수입니다. 25포인트의 배수로 레벨을 표시할 수도 있습니다.
가격이 수준에 도달하면 경고 또는 푸시 알림이 표시됩니다.
설정
- Show Levels 100 pips - 100핍의 배수로 레벨 표시
- Show Levels 50 pips - 50핍의 배수로 레벨 표시
- Show Levels 25 pips - 25핍의 배수로 레벨 표시
- Color Levels 100 pips - 100핍으로 나눌 수 있는 수준의 선 색상
- Color Levels 50 pips - 50핍으로 나눌 수 있는 수준의 선 색상
- Color Levels 25 pips - 25핍으로 나눌 수 있는 레벨의 선 색상
- Send Alert - 알림 보내기
- Send Push - 푸시 알림 보내기
Awesome indicator!!