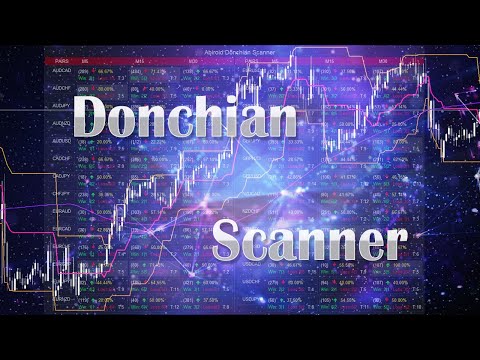
Abiroid Donchian Arrow
- 지표
-
Abir Pathak
 I create MT4 and MT5 indicators. They are mainly arrows and scanner indicators and also some essential utilities.
I'm hoping they will make your trading easier and make you profitable.
You can join my Telegram channel to keep track of all products I post. - 버전: 1.2
- 업데이트됨: 11 12월 2022
- 활성화: 20
This strategy is useful for small timeframe scalping and binary options.
Best timeframes: M5,M15,M30
M1 timeframe is too unpredictable. So be careful with that.
Read Detailed Description and Get All:
- Free Demo
- Free Scanner
- Extra Indicators ex4 files from
https://abiroid.com/product/abiroid-donchian-scanner-and-arrows
Arrows Demo only works in strategy tester. So, Arrows Demo won't work with the free scanner.
Scanner needs "Abiroid Donchian Arrow.ex4" to work.
So make sure both arrows and scanner are in the same directory.
Scanner Refreshes every new bar. So keep scanner open for your min timeframe. E.g. If you use M5,M15,M30 then keep scanner on a chart with M5 timeframe.
Strategy:
- Donchain Channel Break
- Check High Volume
- MA Filter (Buy: Price > MA OR Sell: Price < MA)
- ADX > 25
- HTF Align SMA