Better Volume OnOff MT4
- 지표
- 버전: 1.1
- 업데이트됨: 7 7월 2022
- 활성화: 5

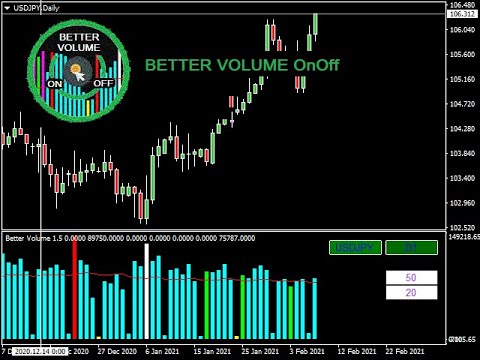
The Better Volume indictator improves the comprehension on volume by coloring the classical histogram bars. The colors point out differents nature of volume. Further through two buttons and without change the main chart it is possibile to change the time frames and navigate among three symbols. The alerts will work accordingly. For each symbol can be choosed the LookBack and Ma periods. The possibility to show/hide the indicator allows you to focus on the price.
The subwindow can be hided with a botton or using the key of the keyboard. The default keys are: numPad 1 ON - numPad 2 OFF
You can customize the button to switch the indicator with 3 symbols. The default are: 'EURUSD', 'GBPUSD', 'USDJPY. The label 'Current' let you use the indicator normally.
You can setup the LookBack and Ma periods for each time frames of three custom symbols. The default value for these symbols and 'Current' value are: LookBack=20 and Ma periods=50
These customizations will be lost by uninstalling the indicator
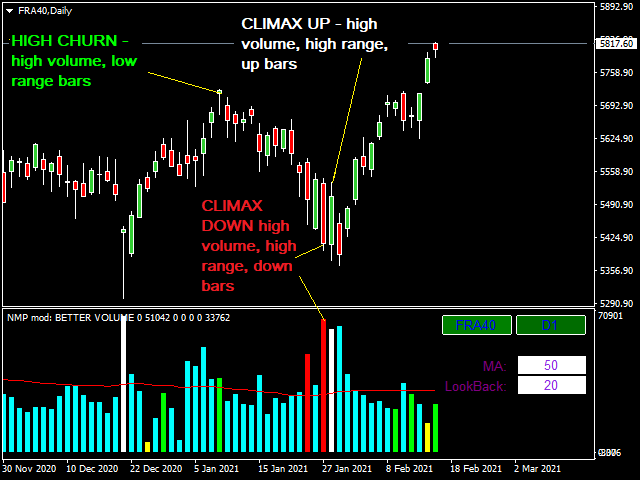
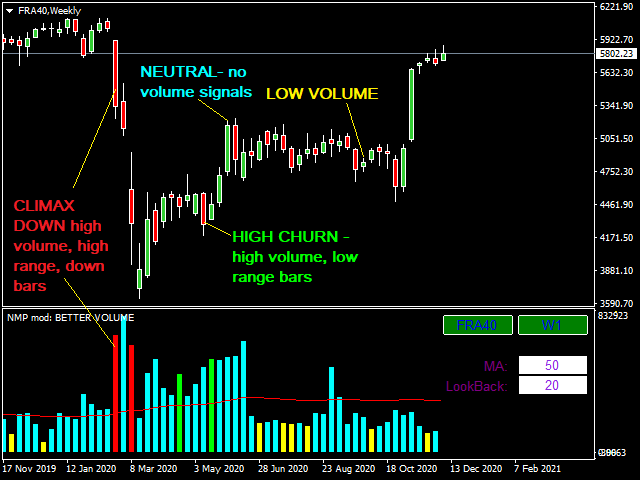
The indicator improves the comprehension on volume by coloring the classical histogram bars:
- CLIMAX UP - it points out high volume, high range, up bars - White
- CLIMAX DOWN - it indicates high volume, high range, down bars - Red
- LOW VOLUME - it can be seen at the similar places to the low churn bar - Yellow
- HIGH CHURN - it shows high volume, low range bars - Lime
- CLIMAX CHURN - it's the combination of Volume Climax plus High Volume Churn - Magenta
- NEUTRAL - there aren't volume signals - Cyan
- Moving Average of volume - Red
Input
- It is possibile to customize 3 symbols
- It is possible to shut down the button and setup your favorite keys to on-off the indicator
- It is possible to customize the button: the position on the screen, the size, the colors and the label
Alerts:
- It's possible set up alerts on colors
- in the metatrader terminal with sound and graphical interface or only with sound
- sending email. You have to fill Email in metatrader platform: 'Tools-Options-Email' tab"