Crosshair MultiCharts Mt4
- 유틸리티
- 버전: 1.1
- 업데이트됨: 4 6월 2024
- 활성화: 10

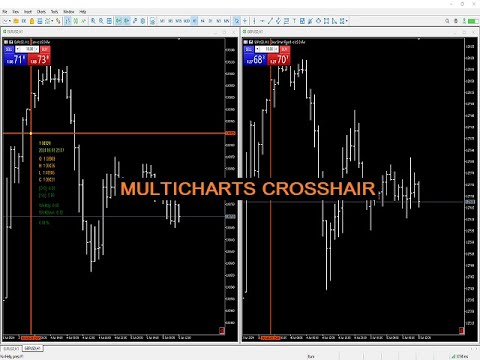
The Multicharts Crosshair draws a cross hair in any linked chart. The indicator can be used for comparison of symbol price levels in different time frame or to compare candles of different instruments in the same time frame
How it works: It can works from every linked charts where the indicator is installed towards the others or from the chart where is istalled towards the following linked charts. It can be shown just pressing a the key of keyboard.
After installing the indicators in the charts, link them by pressing the key 1 and then the Up Arrow key to show the crosshair. If you prefere to leave out a linked chart press the button in the right corner.
How use Tooltips: The Tooltips will shows prices(HOLC), pips and return of the analyzed candle. Three ways:
- to visualize values on the fly just hold down the left button of the mouse on the desired candle
- to move over the chart hold down the central mouse button
- to analyze from a specific candle to another press down the central mouse button and then the hold down left button of the mouse
The default Shortcut Keys:
NumPad 5- Link the charts ON
NumPad 6- Link the charts OFF
Up Arrow- CrossHair ON
Down Arrow- CrossHair OFF
Central mouse button - Tooltips ON - hold it down to move over the chart
Input
- It's possible to setup color, style and width of crosshair lines
- You can setup color and width of crosshair dot
- You can setup your favorite keys to on-off the CrossHair and to Link on-off the charts
- You can choose among central mouse button, CTRL key, Shift key to on-off tooltips when you move over the chart