Analyzer multi timeframe multi indicator

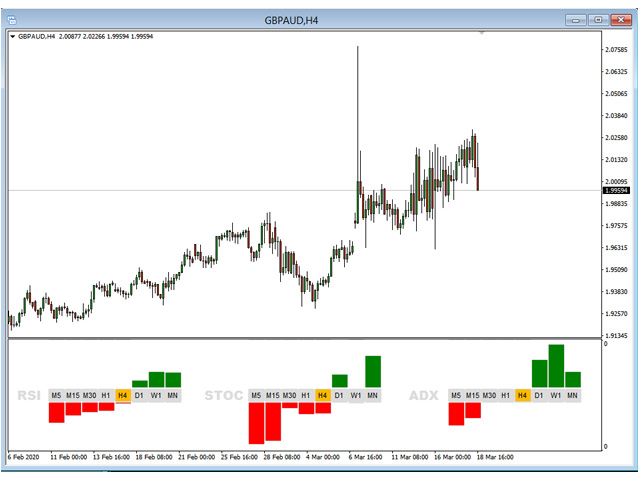
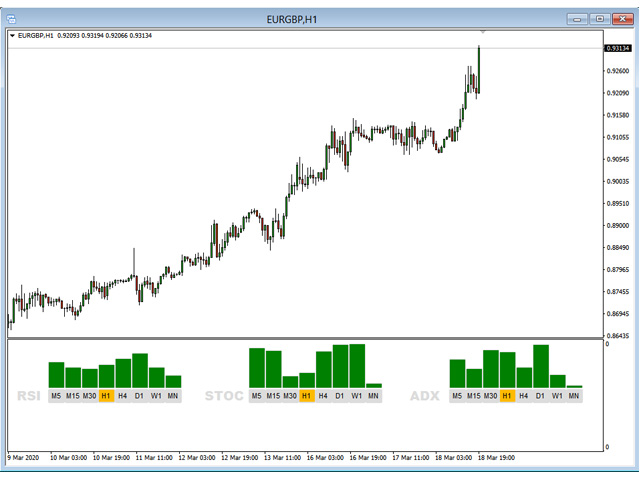
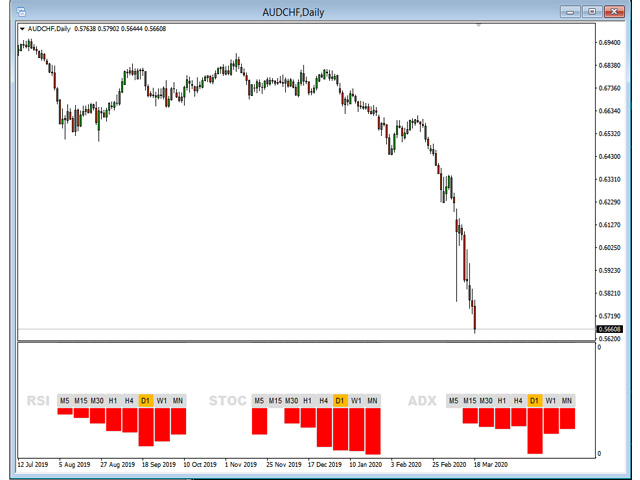
Analyzer is a multiple indicator multi timeframe that allow you to know the status of RSI, Stochastic and ADX in all time frame, from 5 minute to monthly.

In input you can insert your preferred setting which will be applied to the whole indicator.

Trade with this indicator is very simple. You can follow the trend or find the best opportunity for reversal.

A green histogram is shown when the indicator report a bullish tendency.

A red histogram appears whether the indicators indicate a bearish tendency.

The convergence between multiple indicators and multiple timeframes indicates extreme strength.

If you click on timeframe label you can change timeframe on selected chart.

You will discover how important it is to understand the strength of the price on timeframes other than the selected one.

추천 제품
Color Stochastic Enhanced Stochastic Oscillator with Cross Detection and Visual Signal Support Overview Color Stochastic is a customized version of the classic Stochastic Oscillator designed for momentum analysis and crossover visualization. The indicator provides color-based signal marking and configurable crossover detection at user-defined overbought and oversold levels. It can be used as part of: Momentum analysis Mean reversion workflows DCA-based strategies Multi-indicator confirmation sys
Alpha Trend sign has been a very popular trading tool in our company for a long time. It can verify our trading system and clearly indicate trading signals, and the signals will not drift. Main functions: Based on the market display of active areas, indicators can be used to intuitively determine whether the current market trend belongs to a trend market or a volatile market. And enter the market according to the indicator arrows, with green arrows indicating buy and red arrows indicating se
"다이나믹 스캘핑 오실레이터"는 MT4를 위한 고급 맞춤형 암호화폐/외환 지표이자 효율적인 트레이딩 도구입니다! - 차세대 오실레이터 - 사용 방법은 그림을 참조하세요. - 다이나믹 스캘핑 오실레이터는 적응형 과매도/과매수 영역을 제공합니다. - 오실레이터는 동적인 과매도/과매수 영역에서 정확한 진입 시점을 찾는 보조 도구입니다. - 과매도 값: 녹색선 아래, 과매수 값: 주황색선 위. - 이 지표는 가격 변동 패턴과도 결합하기 좋습니다. - 일반 오실레이터보다 훨씬 정확합니다. 적합한 시간대: M30, H1, H4, D1, W1. - PC 및 모바일 알림 기능 제공. .......................................................................... 여기를 클릭하여 고품질 트레이딩 로봇과 지표를 확인하세요! MQL5 웹사이트에서만 제공되는 오리지널 제품입니다.
캔들의 종가를 예측하는 지표입니다. 지표는 주로 D1 차트에서 사용하기 위한 것이. 이 지표는 전통적인 외환 거래와 바이너리 옵션 거래 모두에 적합합니다. 지표는 독립형 거래 시스템으로 사용하거나 기존 거래 시스템에 추가로 사용할 수 있습니다. 이 표시기는 현재 양초를 분석하여 양초 본체 내부의 특정 강도 요인과 이전 양초의 매개변수를 계산합니다. 따라서 지표는 시장 움직임의 추가 방향과 현재 양초의 종가를 예측합니다. 이 방법 덕분에 지표는 단기 및 중장기 거래 모두에 적합합니다. 지표를 사용하면 시장 상황을 분석하는 동안 지표가 생성할 잠재적 신호의 수를 설정할 수 있습니다. 표시기 설정에는 이를 위한 특별한 매개변수가 있습니다. 또한 인디케이터는 새로운 신호에 대해 차트의 메시지 형태, 이메일 및 PUSH 알림 형태로 알릴 수 있습니다. 구매 후 저에게 꼭 써주세요! 나는 당신에게 지표와 거래에 대한 나의 추천을 줄 것입니다! 또한 보너스를 받으세요!
Insider Scalper Binary This tool is designed to trade binary options. for short temporary spends. to make a deal is worth the moment of receiving the signal and only 1 candle if it is m1 then only for a minute and so in accordance with the timeframe. for better results, you need to select well-volatile charts.... recommended currency pairs eur | usd, usd | jpy .... the indicator is already configured, you just have to add it to the chart and trade .... The indicator signals the next candle.
Trend Oscillator mw
DMITRII GRIDASOV
Trend Oscillator - 고급 맞춤형 Crypto_Forex 지표, 효율적인 거래 도구입니다! .......................................................................................... - 고급 새로운 계산 방법 사용 - 매개변수 "계산 가격"에 대한 20가지 옵션. - 지금까지 개발된 가장 매끄러운 오실레이터. - 상승 추세는 녹색, 하락 추세는 빨간색. - 과매도 값: 5 미만, 과매도 값: 95 이상. - 이 지표로 표준 전략도 업그레이드할 수 있는 기회가 많습니다. - PC 및 모바일 알림. .................................................................... 여기를 클릭하여 고품질 트레이딩 로봇과 지표를 확인하세요! 이 MQL5 웹사이트에서만 제공되는 오리지널 제품입니다.
Signal From Level
Yaroslav Varankin
Binary Options Support Resistance Indicator This indicator is designed for binary options trading and effectively shows retracements from support and resistance levels. Signals appear on the current candle. A red arrow pointing downwards indicates a potential selling opportunity, while a blue arrow pointing upwards suggests buying opportunities. All that needs adjustment is the color of the signal arrows. It is recommended to use it on the M1-M5 timeframes as signals are frequent on these timef
Trendiness Index
Libertas LLC
5 (3)
"The trend is your friend" is one of the best known sayings in investing, because capturing large trendy price movements can be extremely profitable. However, trading with the trend is often easier said than done, because many indicators are based on price reversals not trends. These aren't very effective at identifying trendy periods, or predicting whether trends will continue. We developed the Trendiness Index to help address this problem by indicating the strength and direction of price trend
Chart Patterns Detect 15 patterns (Ascending Triangle, Descending Triangle, Rising Wedge, Falling Wedge, Bullish Flag, Bearish Flag, Bullish Rectangle, Bearish Rectangle Symmetrical triangle, Head and Shoulders, Inverted Head and Shoulders, Triple top, Triple Bottom, Double Top, Double Bottom) Use historical data to calculate the probability of each pattern to succeed (possibility to filter notification according to the chance of success) gives graphic indication about the invalidation level and
Quantum Falcon Signal Free is a smart visual trading indicator for MetaTrader 4 designed for Forex and Gold traders. The indicator combines: • Trend analysis • RSI momentum confirmation • MACD momentum filtering • ATR volatility filtering • Higher timeframe confirmation • Smart exit signal detection Main Features: • Smart Buy and Sell signals • Exit Buy / Exit Sell alerts • Real-time dashboard on chart • Professional candle arrows • Multi-timeframe trend confirmation • ATR market volatility filt
FREE
VR Cub
Vladimir Pastushak
VR Cub 은 고품질 진입점을 얻는 지표입니다. 이 지표는 수학적 계산을 용이하게 하고 포지션 진입점 검색을 단순화하기 위해 개발되었습니다. 지표가 작성된 거래 전략은 수년 동안 그 효율성을 입증해 왔습니다. 거래 전략의 단순성은 초보 거래자라도 성공적으로 거래할 수 있다는 큰 장점입니다. VR Cub은 포지션 개시 지점과 이익 실현 및 손절매 목표 수준을 계산하여 효율성과 사용 편의성을 크게 높입니다. 간단한 거래 규칙을 이해하려면 아래 전략을 사용한 거래 스크린샷을 살펴보세요. 설정, 세트 파일, 데모 버전, 지침, 문제 해결 등은 다음에서 얻을 수 있습니다. [블로그] 다음에서 리뷰를 읽거나 작성할 수 있습니다. [링크] 버전 [MetaTrader 5] 진입점 계산 규칙 포지션 개설 진입점을 계산하려면 VR Cub 도구를 마지막 최고점에서 마지막 최저점까지 늘려야 합니다. 첫 번째 지점이 두 번째 지점보다 빠른 경우, 거래자는 막대가 중간선 위에서 마감될 때까지 기다립니다
Crypto_Forex 지표 HTF Ichimoku for MT4. - Ichimoku 지표는 가장 강력한 트렌드 지표 중 하나입니다. HTF는 - Higher Time Frame을 의미합니다. - 이 지표는 트렌드 트레이더와 가격 액션 항목과의 조합에 탁월합니다. - HTF Ichimoku 지표를 사용하면 더 높은 타임프레임의 Ichimoku를 현재 차트에 첨부할 수 있습니다. - 상승 추세 - 파란색 선 위에 빨간색 선(두 선 모두 클라우드 위에 있음) / 하락 추세 - 파란색 선 아래에 빨간색 선(두 선 모두 클라우드 아래에 있음). - 가격이 Ichimoku 클라우드 상단 테두리를 돌파했을 때만 BUY 주문을 엽니다. - 가격이 Ichimoku 클라우드 하단 테두리를 돌파했을 때만 SELL 주문을 엽니다. - HTF Ichimoku 지표는 큰 트렌드를 포착할 수 있는 기회를 제공합니다. 여기를 클릭하여 고품질 트레이딩 로봇과 지표를 확인하세요! 이 MQL5 웹사이트에서만
Noize Absorption Index MT4
Ekaterina Saltykova
5 (1)
Noize Absorption Index - is the manual trading system that measures the difference of pressure between bears forces and bulls forces. Green line - is a noize free index that showing curent situation. Zero value of index shows totally choppy/flat market.Values above zero level shows how powerfull bullish wave is and values below zero measures bearish forces.Up arrow appears on bearish market when it's ready to reverse, dn arrow appears on weak bullish market, as a result of reverse expectation. S
Infinity Trend Pro
Yaroslav Varankin
1 (1)
This is a trend indicator without redrawing Developed instead of the binary options strategy (by the color of the Martingale candlestick) Also works well in forex trading When to open trades (binary options) A signal will appear in the place with a candle signaling the current candle It is recommended to open a deal for one candle of the current timeframe M1 and M5 When a blue dot appears, open a deal up When a red dot appears, open a trade down. How to open trades on Forex. When a signal is rec
ZhiBiCCI MT4
Qiuyang Zheng
[ZhiBiCCI] indicators are suitable for all cycle use, and are also suitable for all market varieties. [ZhiBiCCI] Green solid line is a reversal of bullish divergence. The green dotted line is a classic bullish divergence. [ZhiBiCCI] The solid line to the red is a reverse bearish divergence. The red dotted line is a classical bearish divergence. [ZhiBiCCI] can be set in the parameters (Alert, Send mail, Send notification), set to (true) to send instant signals to the alarm window, email, insta
Delta Fusion Pro
Francesco Secchi
5 (2)
Delta Fusion Pro – 인트라데이 트레이딩을 위한 고급 주문 흐름 분석 Delta Fusion Pro는 MetaTrader 4용 전문 지표로, 공격적인 주문 흐름을 드러내고 기관 압력의 강도와 방향을 실시간으로 보여줍니다. 기존의 거래량 지표와 달리, Ask와 Bid 거래량 간의 델타를 분석하여 반전 예측, 추세 확인 및 전문 관심 영역을 식별합니다. 주요 특징 지능형 자동 조정 시스템 다음 조건에 따라 모든 매개변수를 자동으로 조정합니다: 상품 유형 (외환, 암호화폐, 지수, 원자재, 주식) 운영 타임프레임 시장 변동성 (ATR) 최근 평균 거래량 초보 트레이더를 위한 수동 설정 없음 – 지표가 자동으로 보정됩니다! 기능 NetDelta 및 누적 델타 Ask/Bid 공격적 거래량 차이 계산, 사용자 지정 EMA 스무딩 실시간 방향 압력 시각화 히스토그램 색상 사용자 지정 (매수/매도) 가격/거래량 다이버전스 일반 및 숨겨진 다이버전스 자동 감지 강도 분류: 강/중/
DualVWAP
Kourosh Hossein Davallou
Dual Timeframe VWAP Indicator for MT4  Description Professional VWAP indicator that displays both **Daily** and **Weekly** VWAP simultaneously on your chart.   Features: - Dual VWAP Lines: Blue for Daily, Red for Weekly - Configurable Bands: Two deviation bands for each timeframe - Session Control: Customizable trading hours for Daily VWAP - Clean Visuals: Solid lines for main VWAP, dashed for bands - Optimizable: Parameters can be optimized using Genetic Algorithm Key Settings: - Enable/di
Super Reversal Pattern
Parfait Mujinga Ndalika
Super Reversal Pattern Indicator Unlock the power of advanced pattern recognition with our Super Reversal Pattern Indicator. Designed for traders seeking precision and reliability, this indicator identifies one of the most effective reversal patterns in technical analysis, offering a significant edge in your trading strategy. Key Features: Non-Repainting Accuracy: Enjoy the confidence of non-repainting technology. Once a Super Reversal Pattern is detected, it remains static, providing consiste
Alpha Trend
Evgeny Belyaev
3 (4)
Alpha Trend is a trend indicator for the MetaTrader 4 platform; it has been developed by a group of professional traders. The Alpha Trend indicator finds the most probable tendency reversal points, which allows making trades at the very beginning of a trend. This indicator features notifications, which are generated whenever a new signal appears (alert, email, push-notification). This allows you to open a position in a timely manner. Alpha Trend does not redraw, which makes it possible to evalua
Advanced Trend Regime
Shellard Securities (Pty) Ltd
The indicator has been designed to function on any time-frame and any pair.   This regime filter will help the trader better evaluate whether the current market is trending, and in which direction. It quickly reacts to changes in market dynamics using a series of advanced calculations. The user is able to select whether the calculation remains standard, or if a further filter constraint is added to the calculation.   A Yellow moving average of the signal has been included for the trader to smoot
Fibonacci retracement and extension line drawing tool Fibonacci retracement and extended line drawing tool for MT4 platform is suitable for traders who use  golden section trading Advantages: There is no extra line, no too long line, and it is easy to observe and find trading opportunities Trial version: https://www.mql5.com/zh/market/product/35884 Main functions: 1. Multiple groups of Fibonacci turns can be drawn directly, and the relationship between important turning points can be seen
Scalping Modulator
Andrey Kozak
5 (1)
Scalping Modulator is a scalping trading system. The indicator consists of several analytical modules. It automatically analyzes the market and shows the trader all the necessary information for trading. Scalping Modulator draws two trend lines on the chart. One line shows the long-term direction of the price, the second line shows the medium-term direction of the price. The indicator also draws red and blue dots on the chart. They indicate a likely change in price movement. In order to open a
The Magic MA Moving Average Indicator is a market analysis tool that has more than 30 types of moving averages that the trader can use to gauge the market trend. Among the types of moving averages that the trader can visualize are the most common MAs (SMA, EMA and SMMA), adaptive moving averages such as FRAMA and KAMA and other MAs based on innovative calculation and analysis methods such as LSMA, ZLEMA and others. The indicator is designed to display all these moving averages on a single cha
The indicator displays the data of the Stochastic oscillator from a higher timeframe on the chart. The main and signal lines are displayed in a separate window. The stepped response is not smoothed. The indicator is useful for practicing "manual" forex trading strategies, which use the data from several screens with different timeframes of a single symbol. The indicator uses the settings that are identical to the standard ones, and a drop-down list for selecting the timeframe. Indicator Paramet
EZZ Zig Zag MT4
Paulo Rocha
5 (1)
EZZ Elite Zig Zag is an indicator for the MetaTrader 4 terminal. This indicator traces the peak of the trend based on the market reversal, thus showing various opportunities in the financial market. EZZ Elite Zig Zag is a visual tool, intuitive, and easy to understand and use.  Test it Yourself by Downloading it for Free. Author Paulo Rocha all rights reserved
Stepping Trend
Mpendulo Chiliza
The Stepping Trend Indicator     The Steppi ng Trend indicator uses the  average true range  (ATR indicator) in its calculation. This gives you control to set your own average true range period, I set the Default as 10.   Indicator Details. Green Arrow Up: This means you are at the starting point of a new bullish trend, it’s time to buy.   Red  Arrow  Down : This means you are at the starting point of a new  bearish  trend, it’ s time to sell .   What if you miss the Arrow Signal?   No prob
Trend PA
Mikhail Nazarenko
5 (3)
The Trend PA indicator uses   Price Action   and its own filtering algorithm to determine the trend. This approach helps to accurately determine entry points and the current trend on any timeframe. The indicator uses its own algorithm for analyzing price changes and Price Action. Which gives you the advantage of recognizing, without delay, a new nascent trend with fewer false positives. Trend filtering conditions can be selected in the settings individually for your trading style. The indicator
Title : Market Bias Indicator - Oscillator-Based Trading Tool Introduction : Discover the potential of the "Market Bias Indicator," a revolutionary oscillator-based trading tool designed for precise market analysis. If you're in search of a robust alternative to traditional bias indicators, your quest ends here. Market Bias Indicator offers unparalleled accuracy in identifying market sentiment and is your gateway to confident trading decisions. Recommended Trading Pairs : Market Bias Indicator i
The Stochastic Oscillator is a momentum indicator that uses support and resistance levels. The term "stochastic" refers to the point of a current price in relation to its price range over a period of time. You can use a New Stochastic in the same way as classical one: Overbought and Oversold areas to make a Buy or Sell orders. This new indicator shows all variety of Fibonacci Levels (from 23.6 to 76.4) which can be used as Overbought and Oversold levels as well as points to close an open positio
Lyne
Maksim Kalachev
About the Lyne indicator Lyne is a Metatrader 4 (MT4) indicator, the essence of which is to transform the accumulated historical data. The Lyne indicator makes it possible to detect various features and patterns in price dynamics that are invisible to the naked eye. Based on this information, traders can anticipate further price movement and adjust their strategy accordingly. This indicator has proven itself in the scalping strategy. The indicator works without repainting.
이 제품의 구매자들이 또한 구매함
Neuro Poseidon MT4
Daria Rezueva
4.95 (19)
Neuro Poseidon is a new indicator by Daria Rezueva. It combines precise trading signals with adaptive TP/SL levels - creating best possible trades as a result! Message me and get  Neuro Poseidon Assistant  as a gift to automize your trading process! What makes it stand out? 1. Proven profitability on all assets and timeframes 2. Only confirmed BUY and SELL signals present on the chart 3. Adaptive TP & SL levels generated by the software for each trade 4. Easy to understand - suitable for all
Scalper Inside PRO
Alexey Minkov
4.74 (68)
Scalper Inside PRO Scalper Inside PRO is an intraday trend and scalping indicator for MetaTrader 4 that uses an exclusive algorithm to quickly detect market direction and key target levels. It automatically calculates entry, exit and multiple profit targets, and shows detailed performance statistics so you can see how different instruments and strategies performed. This helps you choose the most suitable trading instruments for the current market conditions. Additionally, you can easily integrat
M1 Sniper
Oleg Rodin
5 (23)
M1 SNIPER 는 사용하기 쉬운 거래 지표 시스템입니다. M1 시간대에 맞춰 설계된 화살표 지표입니다. 이 지표는 M1 시간대 스캘핑을 위한 단독 시스템으로 사용할 수 있으며, 기존 거래 시스템의 일부로도 사용할 수 있습니다. 이 거래 시스템은 M1 시간대 거래용으로 특별히 설계되었지만, 다른 시간대에도 사용할 수 있습니다. 원래는 XAUUSD와 BTCUSD 거래를 위해 이 방법을 설계했지만, 다른 시장 거래에도 유용하다는 것을 알게 되었습니다. 이 지표의 신호는 추세 방향과 반대로 거래될 수 있습니다. 저는 지표의 신호를 활용하여 양방향으로 거래할 수 있도록 돕는 특별한 거래 기법을 알려드립니다. 이 방법은 특별한 동적 지지선과 저항선 가격 영역을 활용하는 것을 기반으로 합니다. 구매하시면 M1 SNIPER 화살표 지표를 바로 다운로드하실 수 있습니다. 또한, 아래 스크린샷에 표시된 Apollo Dynamic SR 지표는 M1 SNIPER 도구를 사용하는 모든 사용자에게 무료로
Gann Made Easy
Oleg Rodin
4.84 (164)
Gann Made Easy 는 mr.의 이론을 사용하여 최고의 거래 원칙을 기반으로 하는 전문적이고 사용하기 쉬운 Forex 거래 시스템입니다. W.D. 간. 이 표시기는 Stop Loss 및 Take Profit Levels를 포함하여 정확한 BUY 및 SELL 신호를 제공합니다. PUSH 알림을 사용하여 이동 중에도 거래할 수 있습니다. 구매 후 거래 방법 안내 및 유용한 추가 지표를 무료로 받으시려면 저에게 연락주세요! 아마도 Gann 거래 방법에 대해 이미 여러 번 들었을 것입니다. 일반적으로 Gann의 이론은 초보자 거래자뿐만 아니라 이미 거래 경험이 있는 사람들에게도 매우 복잡한 것입니다. Gann의 거래 방식은 이론적으로 적용하기 쉽지 않기 때문입니다. 나는 그 지식을 연마하고 Forex 지표에 최고의 원칙을 적용하기 위해 몇 년을 보냈습니다. 표시기는 적용하기가 매우 쉽습니다. 차트에 첨부하고 간단한 거래 권장 사항을 따르기만 하면 됩니다. 지표는 지속적으로 시장 분석
PRO Renko System
Oleg Rodin
5 (30)
PRO Renko System 은 RENKO 차트 거래를 위해 특별히 고안된 매우 정확한 거래 시스템입니다. 이것은 다양한 거래 상품에 적용될 수있는 보편적 인 시스템입니다. 체계는 효과적으로 당신에게 정확한 반전 신호에 접근을 주는 소위 시장 소음을 중화합니다. 이 표시기는 사용하기가 매우 쉽고 신호 생성을 담당하는 매개 변수가 하나만 있습니다. 당신은 쉽게 당신의 선택의 어떤 무역 계기에 공구를 적응시킬 수 있고 renko 막대기의 크기. 나는 항상 당신이 내 소프트웨어로 수익성있게 거래 할 수 있도록 추가 지원을 제공 할 준비가되어 있습니다! 나는 당신에게 행복하고 수익성있는 거래를 기원합니다! 구매 후 저에게 연락하십시오! 내 렌코 차트 생성기를 보내드립니다. 또한 내 개인 권장 사항 및 시스템의 다른 모듈을 무료로 공유 할 것입니다!
Trend Catcher ind
Ramil Minniakhmetov
트렌드 캐처 인디케이터 트렌드 캐처 인디케이터는 개발자가 자체 개발한 맞춤형 적응형 트렌드 분석 지표들을 조합하여 시장 가격 움직임을 분석합니다. 단기적인 노이즈를 제거하고 근본적인 모멘텀 강도, 변동성 확대, 가격 구조 움직임에 집중하여 진정한 시장 방향을 파악합니다. 또한 이동 평균, RSI, 변동성 필터와 같은 맞춤형 지표들을 활용하여 가격을 평활화하고 트렌드를 필터링합니다. 실제 운영 모니터링 및 기타 제품은 다음 링크에서 확인하실 수 있습니다: https://www.mql5.com/en/users/mechanic/seller 텔레그램에서는 EA나 설정 파일을 판매하지 않습니다. 사기이니 주의하세요. 모든 설정 파일은 블로그에서 무료로 제공됩니다. 중요! 구매 후 즉시 연락 주시면 사용 방법 및 보너스를 드립니다!
Trend Lines PRO
Roman Podpora
5 (1)
트렌드 라인즈 프로       이 지표는 시장이 실제로 어떤 방향으로 전환되는지 파악하는 데 도움이 됩니다. 실제 추세 반전 지점과 주요 시장 참여자들이 다시 진입하는 지점을 보여줍니다. 보시다시피       BOS 라인       복잡한 설정이나 불필요한 노이즈 없이 더 높은 시간대의 추세 변화와 주요 레벨을 확인할 수 있습니다. 신호는 차트에 다시 그려지지 않고 캔들이 마감된 후에도 계속 표시됩니다. VERSION MT 5   -   RFI LEVELS PRO   표시기   와 결합할 때 최대 잠재력을 발휘합니다. 지표가 보여주는 내용: 실제 변화       추세(BOS 라인) 한 번 신호가 나타나면 그 신호는 계속 유효합니다! 이는 신호를 발생시킨 후 변경될 수 있는 리페인팅 방식의 지표와 중요한 차이점입니다. 리페인팅 방식의 지표는 잠재적으로 자금 손실로 이어질 수 있습니다. 이제 더욱 높은 확률과 정확도로 시장에 진입할 수 있습니다. 또한 화살표가 나타난 후 목표가(익절)
Enigmera
Ivan Stefanov
5 (8)
ENIGMERA: 시장의 핵심 중요: MQL5.com의 데모는 Strategy Tester에서 실행되며 Enigmera의 기능을 완전히 반영하지 못할 수 있습니다. 설명, 스크린샷 및 비디오를 확인하여 자세한 내용을 확인하십시오. 질문이 있으면 언제든지 메시지를 보내주세요! 인디케이터의 코드는 완전히 다시 작성되었습니다. 버전 3.0은 새로운 기능을 추가하고 인디케이터가 처음 출시된 이후 누적된 버그를 수정했습니다. 소개 이 인디케이터 및 거래 시스템은 금융 시장에 대한 주목할 만한 접근 방식입니다. ENIGMERA는 프랙탈 주기를 사용하여 정확하게 지원 및 저항 수준을 계산합니다. 실제 축적 단계를 보여주고 방향과 목표를 제공합니다. 트렌드와 수정 모두에서 작동하는 시스템입니다. 작동 방식 인디케이터의 대부분의 기능은 차트 왼쪽에 있는 버튼을 통해 제어되며, 이를 통해 다양한 시장 상황에 빠르게 대응할 수 있습니다. 버튼 ON/OFF – 인디케이터 전체를 표시하거나 숨깁니다.
Dynamic Forex28 Navigator
Bernhard Schweigert
4.43 (7)
Dynamic Forex28 Navigator - 차세대 외환 거래 도구. 현재 49% 할인. Dynamic Forex28 Navigator는 오랫동안 인기 있는 지표의 진화형으로, 세 가지의 힘을 하나로 결합했습니다. 고급 통화 Strength28 지표(695개 리뷰) + 고급 통화 IMPULSE with ALERT(520개 리뷰) + CS28 콤보 신호(보너스). 지표에 대한 자세한 정보 https://www.mql5.com/en/blogs/post/758844 차세대 Strength 지표는 무엇을 제공합니까?  원래 지표에서 좋아했던 모든 것이 새로운 기능과 더 높은 정확도로 강화되었습니다. 주요 기능: 독점적인 통화 Strength 공식.  모든 시간대에 걸쳐 부드럽고 정확한 강도선. 추세와 정확한 진입을 식별하는 데 이상적입니다. 역동적인 시장 피보나치 수준(시장 피보나치).  이 지표에만 있는 고유한 기능. 가격 차트가 아닌 통화 강도에 피보나치가 적용됩니다.
Genesis Matrix Pro is a professional multi-timeframe trend detection indicator designed to help traders identify high-quality market alignment with clarity and structure. It combines 12 different technical indicators into one visual alignment matrix, allowing traders to quickly see when market conditions are bullish, bearish, or neutral. A signal is generated only when the selected strategies are aligned, helping reduce noise and improve decision-making. PLEASE CONTACT ME AFTER PURCHASE TO GET
이 지표는 실제 거래에 완벽한 자동 파동 분석 지표입니다! 사례... 참고:   웨이브 그레이딩에 서양식 이름을 사용하는 데 익숙하지 않습니다. Tang Lun(Tang Zhong Shuo Zen)의 명명 규칙의 영향으로 기본 웨이브를   펜   으로 명명하고 2차 웨이브 밴드를   세그먼트   로 명명했습니다. 동시에, 세그먼트에는 추세 방향이 있습니다.   주요 추세 세그먼트에는   이름이 지정되지만(이 이름 지정 방법은 향후 노트에서 사용됩니다. 먼저 말씀드리겠습니다.) 알고리즘은 굴곡 이론과 거의 관련이 없으므로 그렇게 해서는 안 됩니다. 이는 나의 시장 분석을   통해 요약된 끊임없이 변화하고 복잡한 운영 규칙을   반영합니다. 밴드는 더 이상 사람마다 다르지 않도록 표준화되고 정의되었습니다. 인위적인 간섭의 드로잉 방법은 시장 진입을 엄격하게 분석하는 데 핵심적인 역할을 합니다. 이 지표를 사용하는 것은 거래 인터페이스의 미학을 개선하고 원래의 K-line 거래를
RFI levels PRO
Roman Podpora
5 (1)
이 지표는 추세 반전 지점과 가격 반등 영역을 정확하게 보여줍니다.       주요 투자자들   . 새로운 트렌드가 형성되는 곳을 파악하고 최대한 정확하게 의사결정을 내리며 모든 거래를 완벽하게 통제합니다. TREND LINES PRO   지표와 함께 사용할 때 최대의 잠재력을 발휘합니다.  VERSION MT5 지표가 보여주는 내용: 새로운 추세의 시작 시 활성화되는 반전 구조 및 반전 수준. 최소한의 위험 대비 수익률을 갖는 이익 실현   (TAKE PROFIT)   및   손절매(STOP LOSS)   레벨 표시       RR 1:2   . 지능형 손실 감소 로직이 적용된 손절매 기능. 지정된 지표에서 두 가지 추세 유형에 대한 반전 패턴을 표시합니다. 지표: 트렌드를 따라   트렌드 라인 프로   (글로벌 트렌드 변화) 트렌드 프로   (빠른 트렌드 변화) 간단하고 효과적입니다       스캐너       실시간 추세 (신규). 다중 시간 프레임 도구 필터링. 표시하다  
이 제품은 2026년 시장에 맞게 업데이트되었으며 최신 MT5 빌드에 최적화되었습니다. 가격 업데이트 안내: Smart Trend Trading System은 현재 $99 에 제공됩니다. 다음 30회 구매 후 가격은 $199 로 인상됩니다. 특별 혜택: Smart Trend Trading System 구매 후 저에게 개인 메시지를 보내시면 Smart Universal EA를 무료 로 받을 수 있으며, Smart Trend 신호를 자동 거래로 전환할 수 있습니다. Smart Trend Trading System은 리페인트 없음, 재그리기 없음, 지연 없음의 완전한 트레이딩 시스템으로, 더 깨끗한 신호, 더 나은 추세 방향, 그리고 더 체계적인 시장 거래 방식을 원하는 트레이더를 위해 제작되었습니다. Online course , manual and download presets . 이 시스템은 추세 감지, 반전 구간, Smart Cloud, 트레일링 스톱 로직, 지지와 저항, 캔들 색
MTF Supply Demand Zones
Georgios Kalomoiropoulos
4.82 (22)
자동화된 수요 및 공급 구역의 차세대. 모든 차트에서 작동하는 새롭고 혁신적인 알고리즘. 모든 구역은 시장의 가격 움직임에 따라 동적으로 생성됩니다. 두 가지 유형의 경고 --> 1)가격이 영역에 도달할 때 2)새로운 영역이 형성될 때 당신은 더 이상 쓸모없는 지표를 얻을 수 없습니다. 입증된 결과로 완벽한 거래 전략을 얻을 수 있습니다.     새로운 기능:     가격이 공급/수요 영역에 도달하면 경고     새로운 공급/수요 구역이 생성되면 알림     푸시 알림 알림     핍의 영역 너비 레이블     기동특무부대에 한 번 더 시간이 주어집니다. 따라서 현재보다 위의 2개의 시간 프레임 대신 현재보다 높은 3개의 시간 프레임을 볼 수 있습니다.     Alerts/Zones/MTF 기능을 활성화/비활성화하는 버튼 당신이 얻는 이점:     거래에서 감정을 제거하십시오.     거래 항목을 객관화하십시오.     높은 확률 설정을 사용하여 수익
PZ Trend Trading
PZ TRADING SLU
4.8 (5)
Capture every opportunity: your go-to indicator for profitable trend trading Trend Trading is an indicator designed to profit as much as possible from trends taking place in the market, by timing pullbacks and breakouts. It finds trading opportunities by analyzing what the price is doing during established trends. [ Installation Guide | Update Guide | Troubleshooting | FAQ | All Products ] Trade financial markets with confidence and efficiency Profit from established trends without getting whips
Step into the world of Forex trading with confidence, clarity, and precision using   Gold Indicator   a next-generation tool engineered to take your trading performance to the next level. Whether you’re a seasoned professional or just beginning your journey in the currency markets, Gold Indicator equips you with powerful insights and help you trade smarter, not harder. Built on the proven synergy of three advanced indicators, Gold Indicator focuses exclusively on medium and long-term trends eli
Entry Points Pro
Yury Orlov
4.59 (174)
다시 색을 칠하지 않고 거래에 진입할 수 있는 정확한 신호를 제공하는 MT4용 지표입니다. 외환, 암호화폐, 금속, 주식, 지수 등 모든 금융 자산에 적용할 수 있습니다. 매우 정확한 추정값을 제공하고 매수와 매도의 가장 좋은 시점을 알려줍니다. 하나의 시그널로 수익을 내는 지표의 예와 함께 비디오 (6:22)시청하십시오! 대부분의 거래자는 Entry Points Pro 지표의 도움으로 첫 거래 주 동안 트레이딩 결과를 개선합니다. 저희의   Telegram Group 을 구독하세요! Entry Points Pro 지표의 좋은점. 재도색이 없는 진입 신호 신호가 나타나고 확인되면(시그널 캔들이 완성된 경우) 신호는 더 이상 사라지지 않습니다. 여타 보조지표의 경우 신호를 표시한 다음 제거되기 때문에 큰 재정적 손실로 이어집니다. 오류 없는 거래 게시 알고리즘을 통해 트레이드(진입 또는 청산)를 할 이상적인 순간을 찾을 수 있으며, 이를 통해 이를 사용하는 모든 거래자의 성공률이
MetaBands M4
Vahidreza Heidar Gholami
3.5 (6)
MetaBands uses powerful and unique algorithms to draw channels and detect trends so that it can provide traders with potential points for entering and exiting trades. It’s a channel indicator plus a powerful trend indicator. It includes different types of channels which can be merged to create new channels simply by using the input parameters. MetaBands uses all types of alerts to notify users about market events. Features Supports most of the channel algorithms Powerful trend detection algorith
M30/H1/H4 스윙 버전 출시 큰 움직임을 잡고 싶으신가요? Gold Signal Swing Pro (M30/H1/H4). 목표: 거래당 $20-$80+. https://www.mql5.com/en/market/product/177643 KURAMA GOLD SIGNAL PRO (MT4) — 7층 필터, 자동 TP/SL, 품질 점수를 탑재한 XAUUSD 완벽 트레이딩 시스템 리페인트 없음. 리드로우 없음. 지연 없음. 모든 신호는 영구적입니다. 보이는 것이 그대로입니다. 보너스: 영구 라이선스 구매자에게 AI Zone Radar ($59 상당) + 전체 PDF 매뉴얼을 무료 제공. 구매 후 메시지를 보내주세요. AI Zone Radar: https://www.mql5.com/en/market/product/175834 트레이더의 신뢰: 활발한 골드 트레이더 커뮤니티에서 이미 사용 중. 정확도와 사
Current event:  https://c.mql5.com/1/326/A2SR2025_NoMusic.gif A. A2SR이란 무엇입니까 ?   * 선행 기술 지표입니다(재도장 없음, 지연 없음). -- 안내 : https://www.mql5.com/en/blogs/post/734748/page4#comment_16532516 -- 및 https://www.mql5.com/en/users/yohana/blog A2SR에는 지원(수요) 및 저항(공급) 수준을 결정하는 특별한 기술이 있습니다. 우리가 인터넷에서 본 일반적인 방식과 달리 A2SR은 실제 SR 수준을 결정하는 독창적인 개념을 가지고 있습니다. 원래 기술은 인터넷에서 가져온 것이 아니며 인터넷에 게시된 적도 없습니다. A2SR은 거래 스타일에 따라 SR 수준을 자동으로 선택합니다. 시간 프레임을 변경해도 SR 레벨은 그대로 유지됩니다. 사용하는 시간 프레임에서 실제 SR을 얻지 못하기 때문입니다. A2SR은 거래를
BTMM State Engine Pro MT4
Garry James Goodchild
BTMM State Engine Pro is a MetaTrader 4 indicator for traders who use the Beat The Market Maker approach: Asian session context, kill zone timing, level progression, peak formation detection, and a multi-pair scanner from a single chart. It combines cycle state logic with a built-in scanner dashboard so you do not need the same tool on many charts at once. What it does Draws the Asian session range; session times can follow broker server offset or be set in inputs. Tracks level progression (L
Quant Direction
Georgios Kalomoiropoulos
Quant Direction 은 3D 시장 분석 도구입니다. 다양한 매개변수에 걸쳐 정확한 백분율 편차를 계산하면서 완벽하게 객관적인 알고리즘 기반 시장 분석을 제공합니다. 첨단 AI 기반 모델링 도구와 엄격한 테스트를 거쳐 개발된 이 알고리즘은 타의 추종을 불허하는 정확도로 시장을 분석합니다. 플랫폼에서 모든 통화쌍 또는 금융 상품을 분석할 수 있습니다. 단기 거래, 데이 트레이딩, 스윙 트레이딩 등 어떤 유형의 거래를 하든 Quant Direction은 최적의 선택입니다. 운영자가 되는 것의 진정한 이점 퀀트 디렉션의 진정한 장점은 감정, 눈의 피로, 과도한 분석을 완전히 배제한다는 점입니다. 더 이상 수십 개의 차트를 일일이 살펴보며 방향을 찾거나 자신의 판단에 끊임없이 의문을 품을 필요가 없습니다. 이 시스템은 8개의 시간 간격(5개월에서 수개월까지)을 밀리초 단위로 처리합니다. 특정 시점의 주요 시장 참여자를 정확하게 식별하여 항상 성공 확률이 가장 높은 방향으로 거래할
MonsterDash Harmonic Indicator
Paul Geirnaerdt
4.54 (26)
MonsterDash Harmonic Indicator is a harmonic pattern dashboard. It recognizes all major patterns. MonsterDash is a dashboard that displays all detected patterns for all symbols and (almost) all timeframes in sortable and scrollable format. Users can add their own user defined patterns . MonsterDash can open and update charts with the pattern found. Settings MonsterDash's default settings are good enough most of the time. Feel free to fine tune them to your needs. The color settings are for thos
NAM Order Blocks
NAM TECH GROUP, CORP.
3.67 (3)
MT4 Multi-timeframe Order Blocks detection indicator. Features - Fully customizable on chart control panel, provides complete interaction. - Hide and show control panel wherever you want. - Detect OBs on multiple timeframes. - Select OBs quantity to display. - Different OBs user interface. - Different filters on OBs. - OB proximity alert. - ADR High and Low lines. - Notification service (Screen alerts | Push notifications). Summary Order block is a market behavior that indicates order collection
PowerBall Signals
Oleg Rodin
5 (4)
PowerBall Signals는 지지/저항 영역을 사용한다는 아이디어를 기반으로 한 매수/매도 신호 표시기입니다. 이 지표는 지지/저항 영역을 기반으로 특별한 반전 패턴을 감지하고 차트에 이러한 신호를 제공합니다. 이 지표의 주요 아이디어는 MTF(다중 시간대) 분석을 사용하고 현재 및 다음 상위 시간대의 수준을 기반으로 신호를 제공하는 것입니다. 이 방법을 사용하면 통화, 금속, 지수 또는 암호화폐 등 모든 시장에서 가능한 가격 반전을 예측할 수 있습니다. 반전 신호 외에도 이 지표는 거래 중에 추세를 유지할 수 있는 추세 지속 신호도 제공합니다. 이 지표는 외환 및 바이너리 옵션 거래자 모두에게 도움이 될 것입니다. NON-MTF 또는 MTF 모드에서 표시기를 사용할지 여부를 선택할 수 있습니다. 신호 생성을 위해 데이터를 가져오려는 소스 시간 프레임을 선택할 수도 있습니다. 거래 팁과 큰 보너스를 얻으려면 구매 후 저에게 연락하십시오! 행복하고 수익성 있는 거래를 기원합니다!
Auto Optimized Parabolic RSI: 고급 3D 모멘텀 엔진 대부분의 개인 투자자용 보조지표는 시장의 변동성이 변하는 순간 무용지물이 되는 정적인 입력값에 의존하기 때문에 실패합니다. Auto Optimized Parabolic RSI는 자체적인 수학적 우위를 지속적으로 재계산하여 "보조지표 노후화" 문제를 해결하며, 기관급 퀀트 트레이딩의 적응력을 귀하의 MT5 터미널에 직접 제공합니다. 핵심 이점: 맞춤형 인메모리 3D 최적화   표준 자동 최적화 도구들은 일반적인 보조지표 호출로 터미널에 과부하를 일으켜 MT5 플랫폼을 멈추게 하는 경우가 많습니다. 이 도구는 이러한 병목 현상을 완전히 우회합니다. 맞춤형 네이티브 RAM 기반 계산기로 구축된 내부 엔진은 차트를 로드하거나 타임프레임을 변경할 때마다 빛처럼 빠른 3D 그리드 검색을 실행합니다. RSI 기간(주기), SAR 스텝(가속도) 및 SAR 최대치(속도 제한)를 동시에 스캔하여 플랫폼 지연 없이 수만 개의
Volume Master
Mohamed Hassan
Volume Master – Real-Time Market Power Indicator See who’s in control of the market: buyers or sellers in real time. Volume Master is a powerful trading tool designed to give you a clear edge by visualizing bull vs bear activity across multiple symbols, while helping you confirm high-probability entries directly on your chart. WHAT MAKES VOLUME MASTER DIFFERENT? Unlike traditional volume indicators, Volume Master doesn’t just show volume — it shows market dominance. Real-Time Bull vs Bear Activi
GoldRush Trend Arrow Signal
Kirk Lee Holloway
5 (2)
GoldRush 트렌드 화살표 신호 GoldRush 트렌드 화살표 신호 지표는 XAU/USD 시장에서 고속 단기 스캘핑 트레이더를 위해 설계된 정밀한 실시간 트렌드 분석을 제공합니다. 1분 시간대에 특화되어 설계된 이 도구는 명확한 진입점을 표시하는 방향성 화살표를 제공하여 스캘퍼들이 변동성이 높은 시장 환경에서도 자신 있게 거래할 수 있도록 합니다. 이 지표는 PRIMARY 및 SECONDARY 경고 화살표로 구성됩니다. PRIMARY 신호는 추세 방향의 변화를 나타내는 흰색과 검은색 방향성 화살표이며, SECONDARY 신호는 PRIMARY 화살표가 지시하는 방향을 확인하고 잠재적인 거래 진입점을 표시하는 파란색과 빨간색 화살표입니다. 참고: 추세 방향이 변경된 후 PRIMARY 경고 화살표가 단 하나만 표시될 경우, 다수의 SECONDARY 파란색/빨간색 화살표가 표시될 수 있음을 유의해야 합니다. SECONDARY 신호는 신호 기준을 충족하는 어떤 캔들 이후에도 표시
PZ 123 Pattern
PZ TRADING SLU
1 (1)
Unlock powerful breakout opportunities The 123 Pattern is one of the most popular, powerful and flexible chart patterns. The pattern is made up of three price points: a bottom, a peak or valley, and a Fibonacci retracement between 38.2% and 71.8%. A pattern is considered valid when the price breaks beyond the last peak or valley, moment at which the indicator plots an arrow, rises an alert, and the trade can be placed. [ Installation Guide | Update Guide | Troubleshooting | FAQ | All Products  ]
Bull versus Bear
Mohamed Hassan
4.5 (18)
Send us a message after your purchase to receive more information on how to get your  BONUS  for FREE  that works in great combination with Bull vs Bear ! Bull versus Bear is an easy-to-use Forex indicator that gives traders clear and accurate signals based on clear trend retests . Forget about lagging indicators or staring at charts for hours because  Bull vs Bear provides real-time entries with no lag and no repaint, so you can trade with confidence. Bull vs Bear  helps you enter trades during
제작자의 제품 더 보기
This indicator allow users to navigate very quickly from one to another Forex cross. Very simple to use and very useful. You will not waste any more time and it will simplify your life as a trader. The color change every time that you click on other cross, so you will always know which is the open chart. To help your navigation, the majors have a slightly different color.
Forex Dashboard
DARIO GALLIONE
All in One Forex Dashboard is a multitimeframe and multicurrency screener with external data inupt. You can filter your signal by multiple information to find trend or potential inversion on 28 currency cross. The first group of indicator is a Trend indicator . It's based on average price and allow you to konw if you are in trend or not in all major timeframes. Single timeframe is colored according to the information founded, while it remains gray when the price is in an accumulation or di
RSI multitimeframe is a simple but useful indicator that allow you to know the status of RSI in all time frame, from 5 minute to monthly. In input you can insert your preferred setting which will be applied to the whole indicator. A green histogram is shown, if the value is greater than 50. A red histogram appears instead if the value is less than 50. If you click on timeframe label you can change timeframe on selected chart. You will discover how important it is to understand the strength of th
Stochastic multitimeframe  is a simple but useful indicator that allow you to know the status of Stochastic in all time frame, from 5 minute to monthly. In input you can insert your preferred setting which will be applied to the whole indicator. A green histogram is shown, if the value is greater than 50. A red histogram appears instead if the value is less than 50. If you click on timeframe label you can change timeframe on selected chart. You will discover how important it is to understand the
Broker Tester
DARIO GALLIONE
Broker Tester allow you to test the real terms applied by your broker. Using the 28 forex cross, this indicator records the changes in spreads for the duration of the test.  It shows moreover the swap applied for long and short position for multiday trades. You can have a clear expression of the quality of your broker in a short time and maybe you can use this information to negotiate better conditions.  In the input parameters, you can enter prefixes and suffixes used by your broker for naming
ADX Power Screener MT4 is a very powerful utility. Thanks to the information provided by the ADX indicator , it returns a table with the levels detected on the major timeframes. Great for checking the quality of a trend and identifying excellent reversal signals  which can be accompanied by normal technical analysis to find the best entry point. The screener can be totally customized in colors and levels. It also uses 2 lists of 28 symbols each, fully customizable through the input panel.
Prices move for many reasons and these can vary from one operator to another: software, private and institutional traders simultaneously contribute to the formation of the price, making predictive art very difficult. However, there are measurable factors that bind the price to an underlying trend in line with the physical reality that the financial asset represents: these are the macroeconomic indicators. Large investors use this information wisely to set their strategies. Understanding these m
Volume Bars
DARIO GALLIONE
An effective indicator that highlights candles with increasing volumes, overshadowing those with shrinking volumes. Also suitable for Forex because it uses tick_volume.  You can set the colors to your liking. It will be easier to spot trends and possible reversals. The increasing volumes indicate the presence of large investors and therefore determine the reliability of the candle under observation
Simple ADX
DARIO GALLIONE
ADX is one of the most versatile indicators, understanding it can help you understand the true nature of movements. It is often used within automatic experts to filter input signals. Unfortunately in its original form it is not immediately understandable. This version aims to simplify its reading by transferring the burden of interpreting its values to the code. The result is a clear graph where it is easy to identify the accumulation and distribution phases, trend phases and excesses. The color
Transfer volatility levels to the chart to understand the nature of the ongoing movements. The levels are calculated based on the volatility recorded in the last few sessions. Easily identify possible targets or swing points for intraday , daily and weekly trading. In addition, the round price levels considered most important are also visible, here the highest trading volumes are usually concentrated. NO REPAINT
Visible Volume Profile
DARIO GALLIONE
1 (1)
Visible Market Profile graphically represents the amount of trades made on each price level. This indicator in particular, unlike the daily  market profile , is calculated on the visible area of ​​the chart. Visible Market Profile cannot be considered an indicator of operational signals, but it can be a good support for reading the market, in addition to what is already used by every trader in his work process. The Visible Market Profile is able to determine with a good approximation the price
Close All By Magic
DARIO GALLIONE
5 (1)
Small expert of great use. Close All by Magic Number allows you to speed up the closing of all open positions with a certain magic number. Thanks to this expert, it is possible to manage multiple strategies at the same time without the risk of making mistakes. You can close all discretionary trades, all experts, all spreads... The position of the button can be customized so as not to disturb any other indicators
Multichart Control Panel is a small panel that can change the timeframe and zoom level of all open chart with just one click. Simple, intuitive and fast. Inside there is a simple hidden function: the buttons have a light red color when working on a demo account and a light green color when working on a real account. This little trick helps all traders who for some reason often switch from a demo account to a real one not to get confused and not to make involuntary mistakes.
필터:
리뷰 없음
리뷰 답변