FuTuRe 01 Phi Cubic Fractals Pack1
- 지표
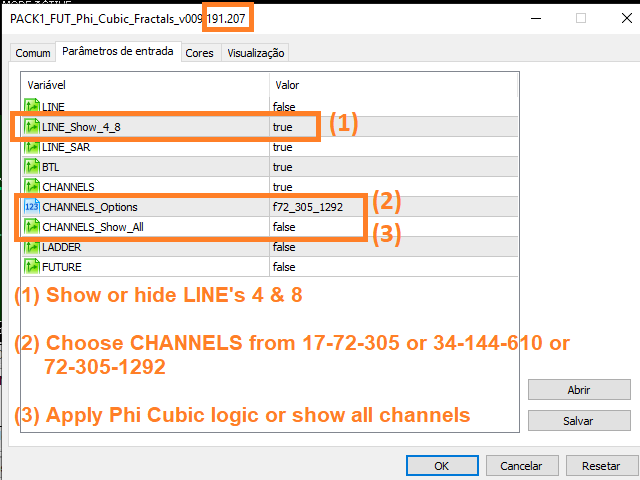
- 버전: 191.207
- 업데이트됨: 8 12월 2019
- 활성화: 5
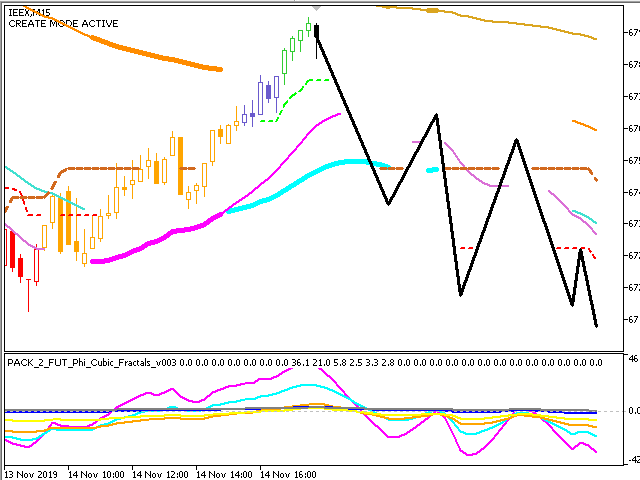
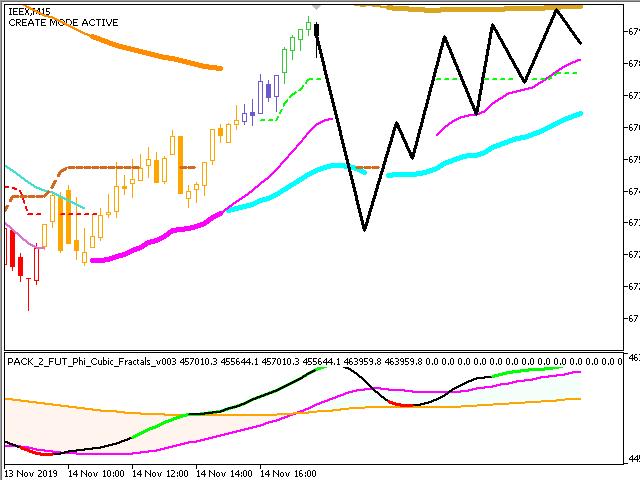
This product contains following indicators: (Lines + LineSAR + Channels + BTL + Ladder)
- Phi Lines - special EMAs, similar to MIMAs from Phicube;
- Phi LineSAR - erase and highlight Phi Lines in support or resistance. Similart to MIMASAR from Phicube;
- Phi Channels - show support and resistance, similar to Phibo from Phicube (Green and Read Lines);
- Phi BTL - candles color following Phi Lines alignment;
- Phi LADDER - Indicator that allow you to visualize possible targets.
-
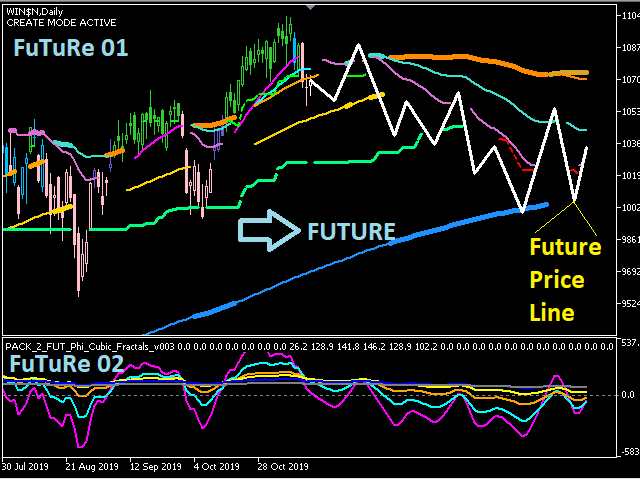
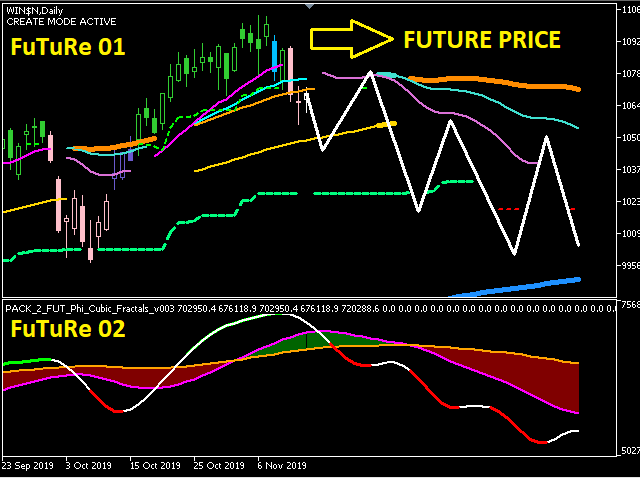
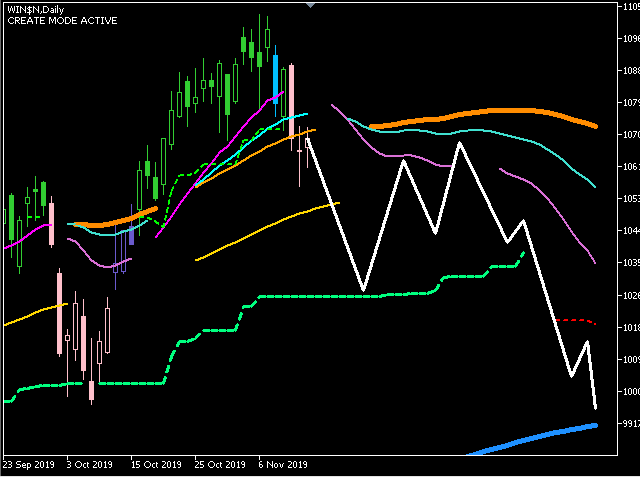
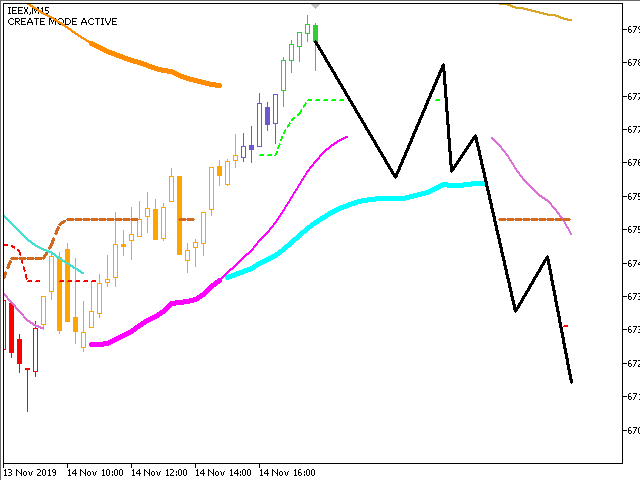
FUTURO Tool
Future tools allow extend indicators following future candles represented by arrow inserted by mouse click on future positions. Use BACKSPACE to erase drawings done. Use SHIFT to selected between “CREATE MODE” and “ADJUST MODE”. CREATE MODE will have a new draw for each mouse click on the future while “ADJUST MODE” will update latest future drawing based on new mouse click.
Input Indicator Parameter for iCustom function
bool LINE = false;
bool LINE_Show_4_8=true;
bool LINE_SAR = true;
bool BTL = true;
bool CHANNELS = true;
enum ENUM_SELECTION {f17_72_305, f34_144_610, f72_305_1292};
ENUM_SELECTION CHANNELS_Options = f72_305_1292;
bool CHANNELS_Show_All = true;
bool LADDER = false;
bool FUTURE = false;
Buffers para LINES [Type: double]
-
buffer_num = 123==> Linha 4: Green
-
buffer_num = 124 ==> Linha 8: Red
-
--------------------------------------------------
-
buffer_num = 117 ==> Linha 17: Magenta
-
buffer_num = 118 ==> Linha 34: Light Blue
-
buffer_num = 119 ==> Linha 72: Orange
-
buffer_num = 120 ==> Linha 144: Yellow
-
buffer_num = 121 ==> Linha 305: Dark Blue
-
buffer_num = 122 ==> Linha 610: Gray
Buffers para CHANNELS [Type: double]
-
buffer_num = 68 ==> 17PV | 34PV | 72PV
-
buffer_num = 69 ==> 72PV | 144PV | 305PV
-
buffer_num = 70 ==> 305PV | 610PV | 1292PV
-
buffer_num = 71 ==> 17PC | 34PC | 72PC
-
buffer_num = 72 ==> 72PC | 144PC | 305PC
-
buffer_num = 73 ==> 305PC | 610PC | 1292PC
-
buffer_num = 125 ==> BTL out
Nota1: Não existe buffer disponivel para LADDER
Phi Cubic Fractals Channel on You Tube
https://www.youtube.com/channel/UCXYSemYcmydg-CAuyTu3Jaw/featured
Grupo WhatsApp:
https://chat.whatsapp.com/Jf8Ah4SDgslJMMfxz2jByj
*** DOWNLOAD DEMO funciona apenas no testador de estrategia e apenas no ativo "IEEX" (BOVESPA) ou "AUDJPY" (FOREX)***


Simplesmente Fantástico!!!