BeST Trend Exploiter MT5
- 지표
- 버전: 1.30
- 업데이트됨: 17 7월 2019
- 활성화: 10

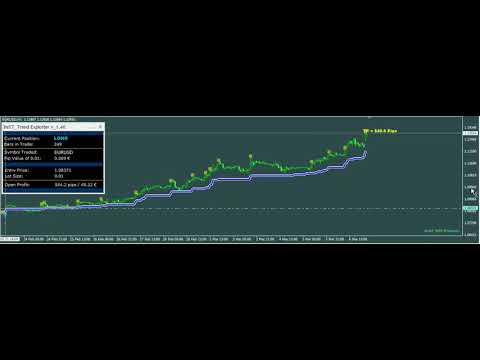
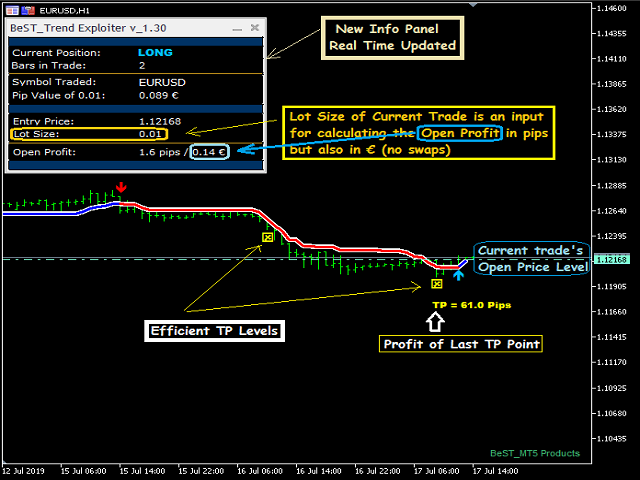
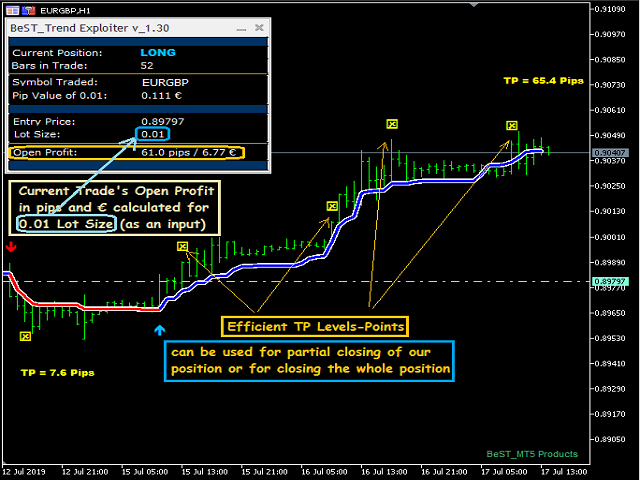
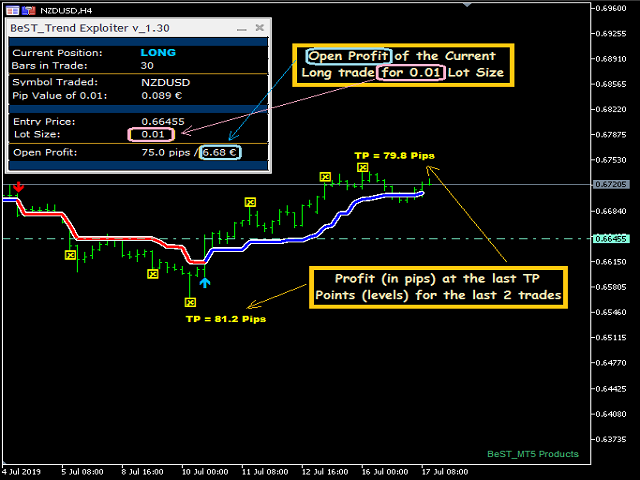
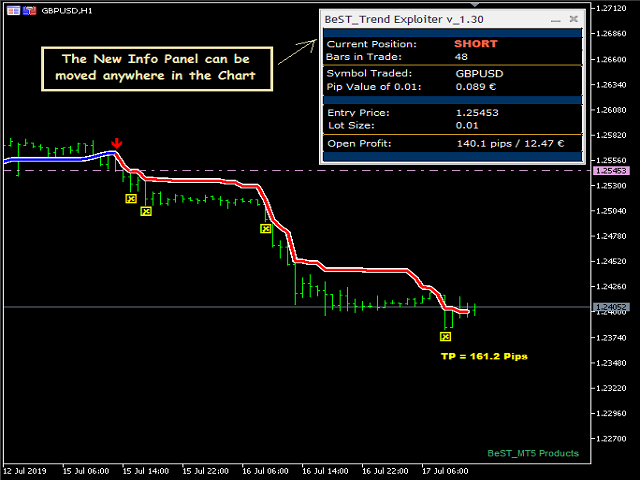
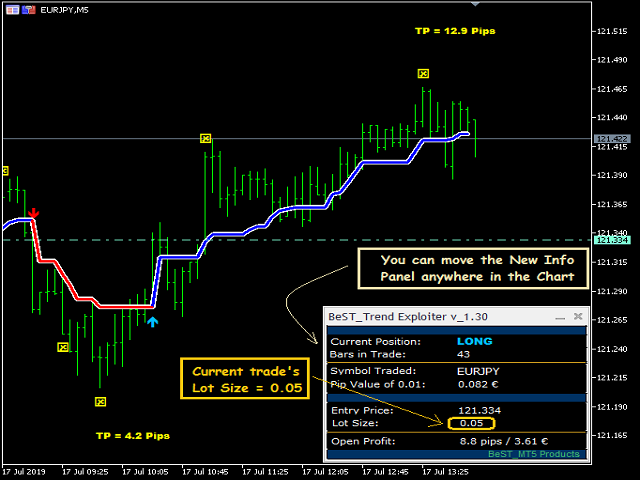
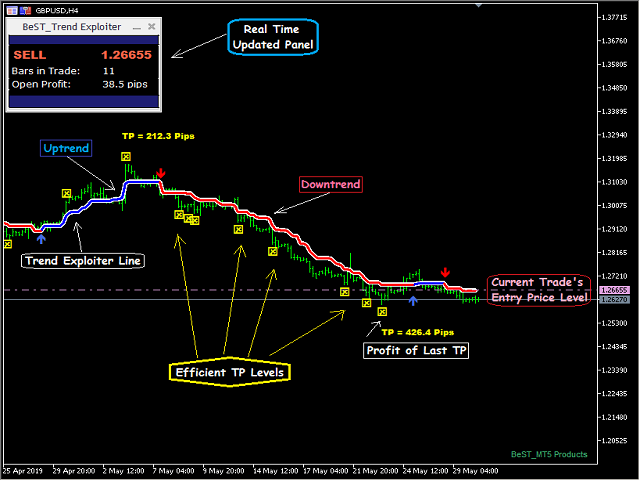
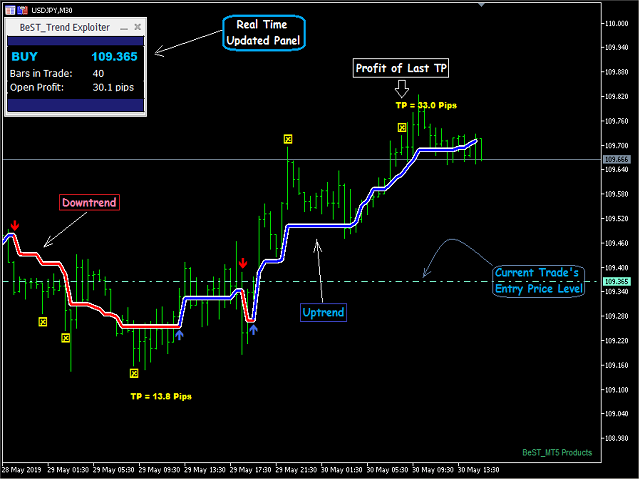
BeST_Trend Exploiter is a Metatrader Indicator based on a smart proprietary algorithm which can detect the market Median Trend while it filters out the noise providing Buy and Sell Signals and also wherever it is applicable it provides us with TP Levels of High Probability. Additionally as it has Built Inside all the necessary features it can be used as a Complete Strategy of very Impressive Results.
- Clear and Easily Understandable trading rules.
- Real Time Updated Trades’ Statistics Calculation Table.
- Never repaints the Entry Points (Arrows) neither the TP Levels.
- All Signals are always on the "Close of the bar".
- Runs in all symbols and timeframes.
- Comes up with sound Metatrader alert, email and push notification (for Entry and TP levels).
- Cooperative with Expert Advisor development
Trading Rules
=== Enter a Trade - Enter a BUY or SELL Signal at the next Bar’s Opening.
Note: The next opposite Entry Signal is always the Stop Level either with a profit (TP) or with a loss (SL). Also preferably we use the less noisy H4 or H1 timeframes
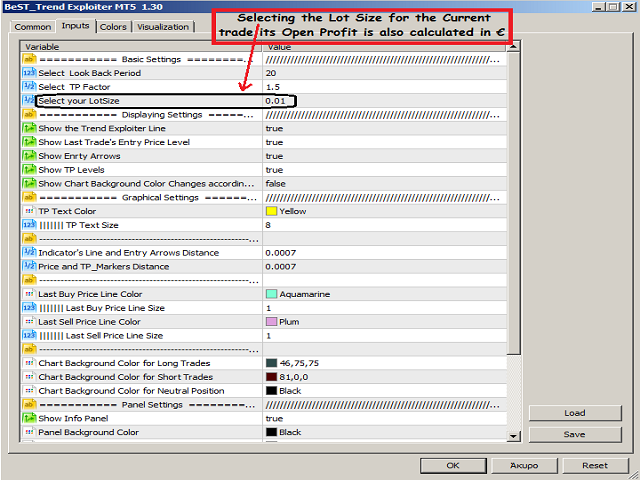
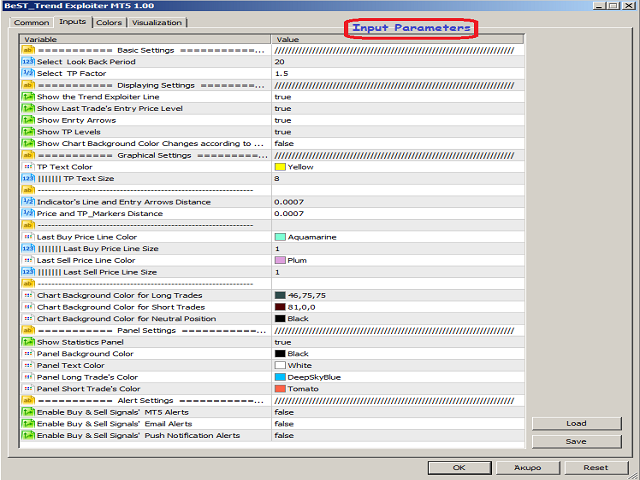
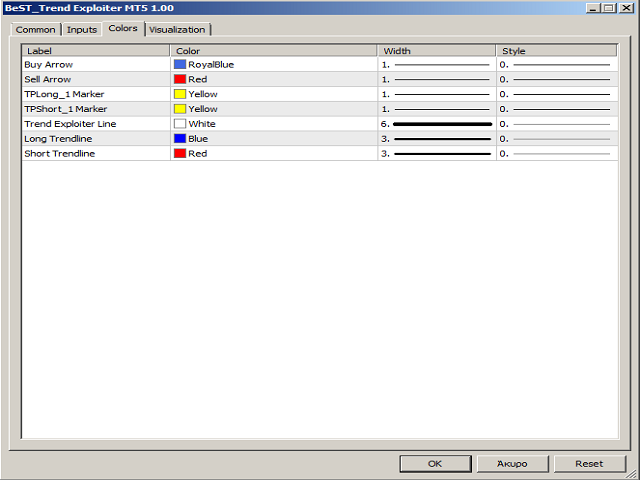
== Graphical Settings - for selecting the color, size and distance of drawn objects.
== Panel Settings - for selecting to show or not the panel and choosing its colors.
== Alert Settings - for controlling the use of Entry and Exit alerts.
- Buy Arrow and Sell Arrow : Buffers = 0,1
- TP Long and TP Short : Buffers = 2,3

Very good entries and exits, supports and resistances maybe misses some. Adjustable look for each taste.