Price deviation from MA
- 지표
-
Illia Zhavarankau
 I program in MQL4 trading robots. I am looking for interesting people who are interested in this direction.
I run my blog https://botrader.org. - 버전: 1.1
- 업데이트됨: 9 8월 2019
- 활성화: 5
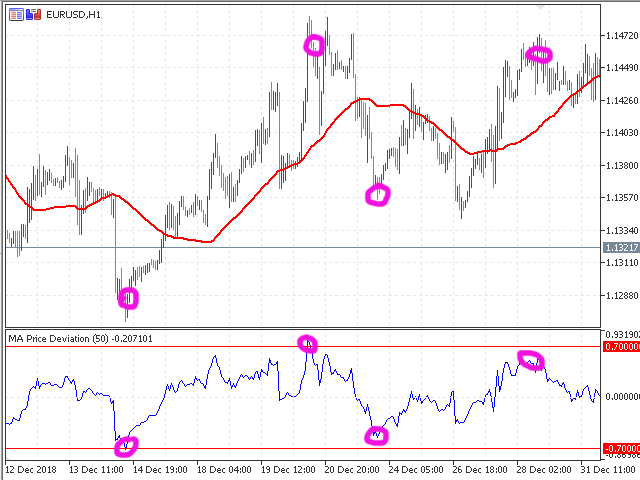
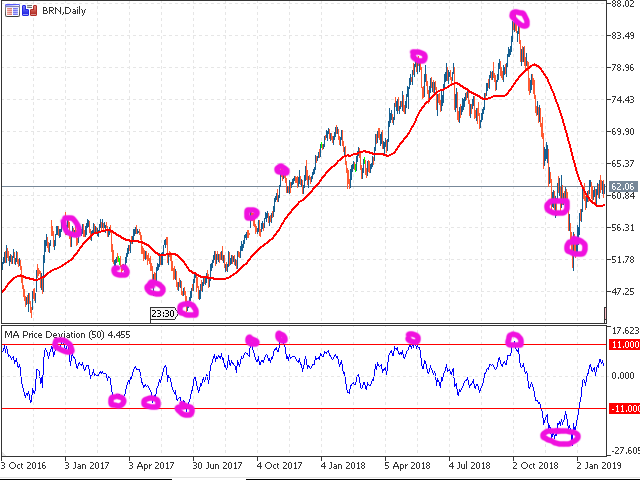
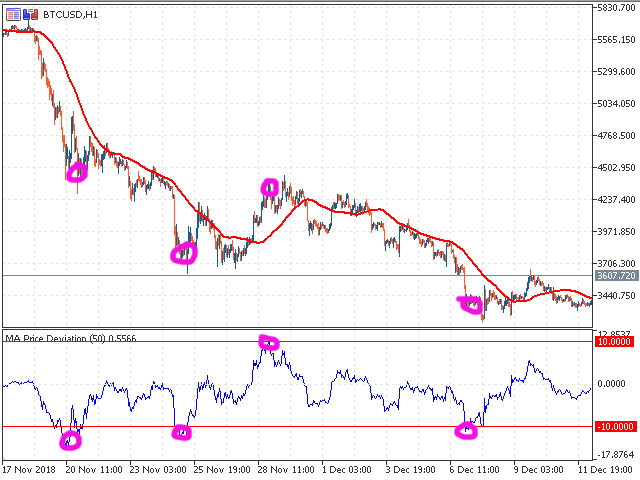
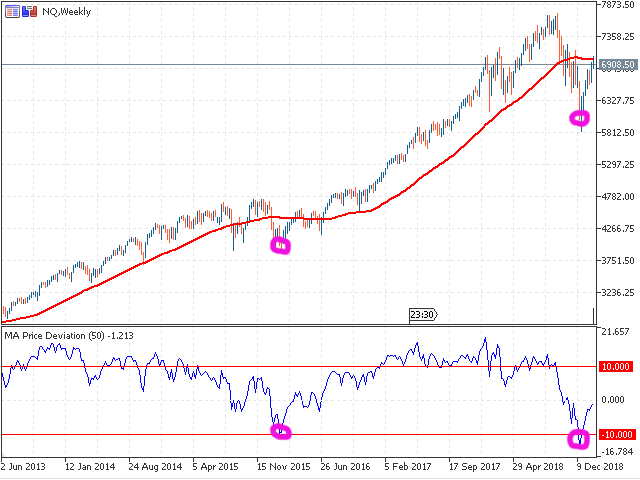
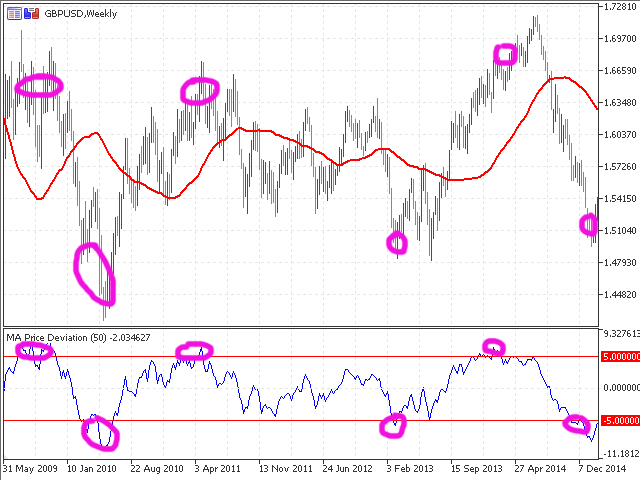
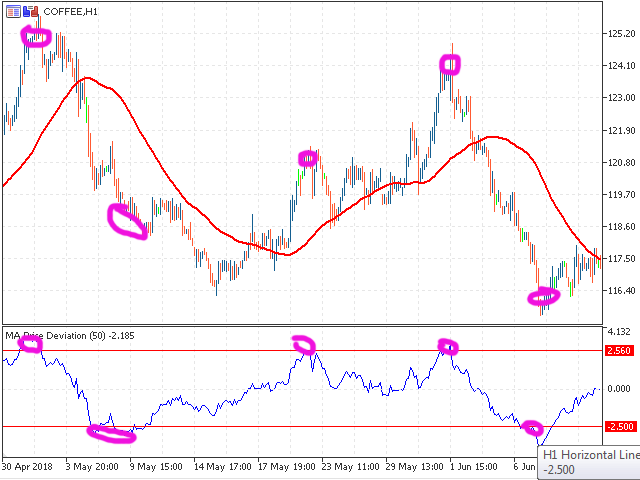
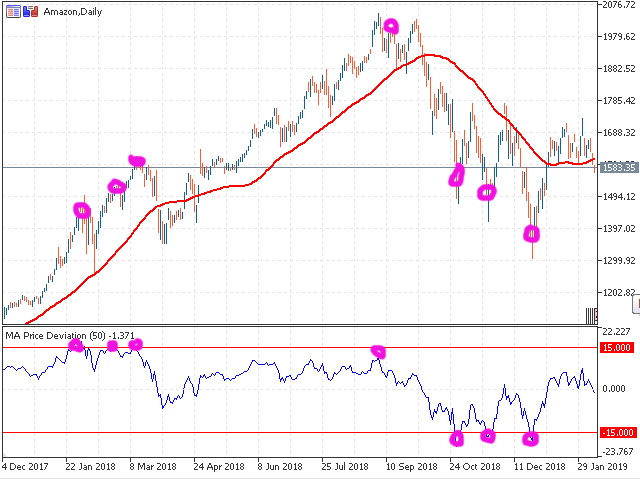
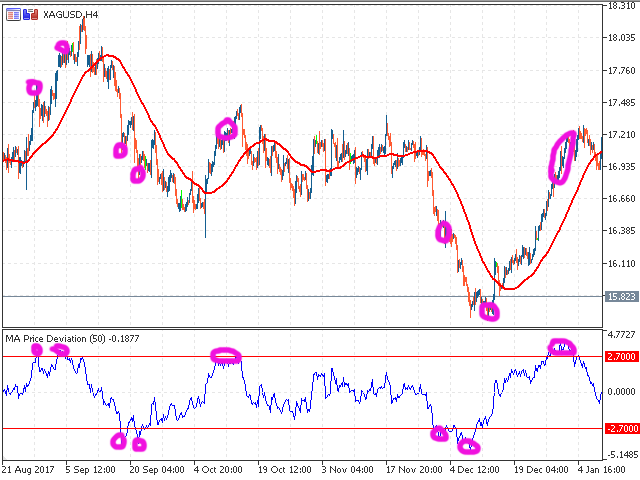
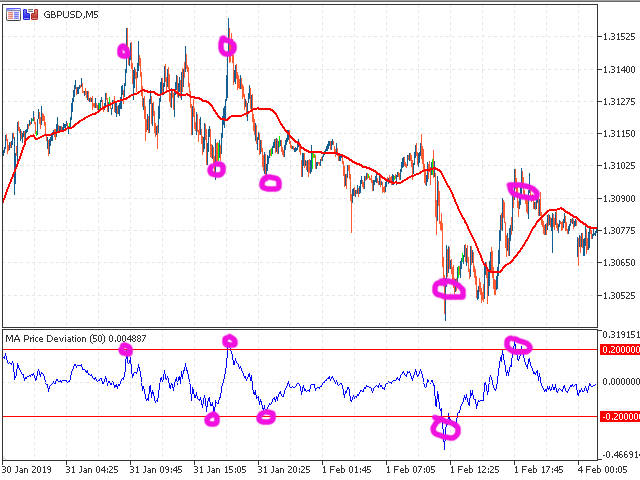
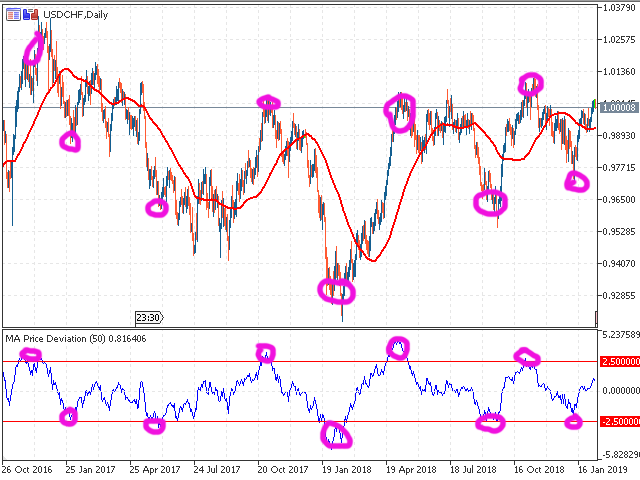
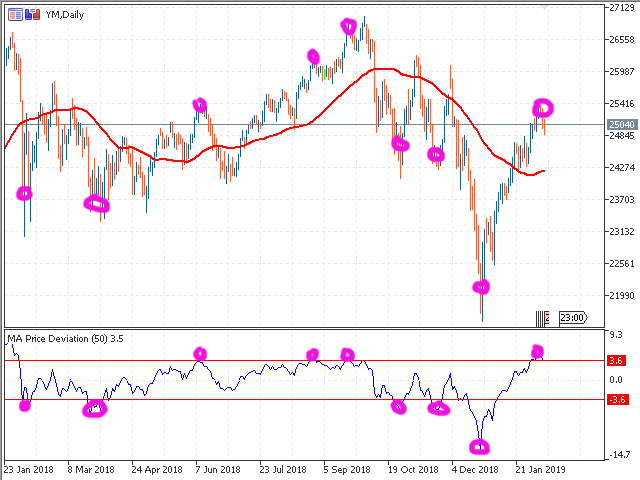
Price deviation from MA
The indicator in a separate window displays the value of the price deviation (%) from the specified value of the Moving Average.
It can be used both for fixing positions and opening new positions.
Input parameters:
1. The averaging period for calculating the moving average.
2. Averaging method. It can be any of the ENUM_MA_METHOD values:
MODE_SMA - Simple averaging;
MODE_EMA - Exponential averaging;
MODE_SMMA - Smoothed averaging;
MODE_LWMA - Linear weighted averaging.
3. Used price. Can be one of the ENUM_APPLIED_PRICE price constants:
PRICE_CLOSE - closing price;
PRICE_OPEN - Opening Price;
PRICE_HIGH - Maximum price for the period;
PRICE_LOW - Minimum price for the period;
PRICE_MEDIAN - Median price, (high + low) / 2;
PRICE_TYPICAL - Typical price, (high + low + close) / 3;
PRICE_WEIGHTED - Weighted Average Price, (high + low + close + close) / 4.