TargetX

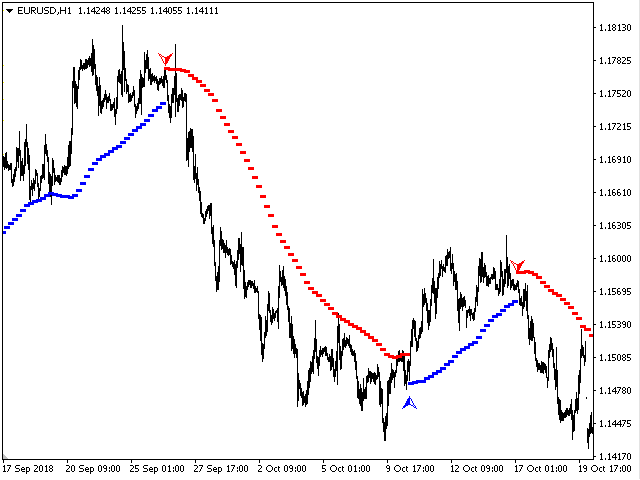
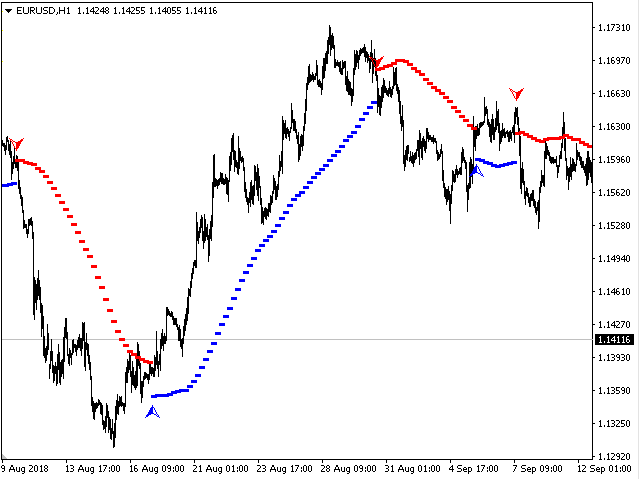
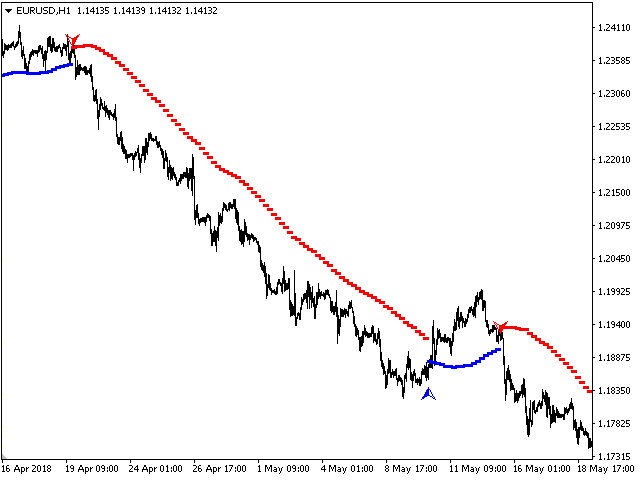
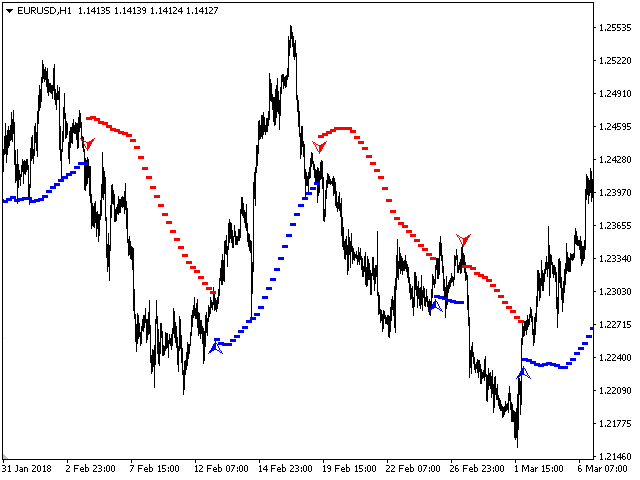
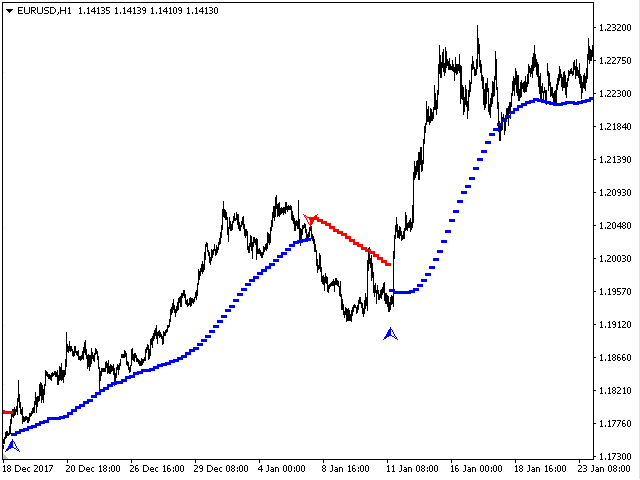
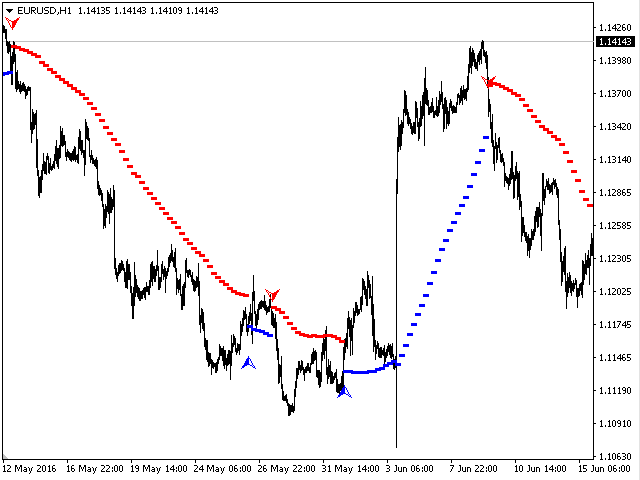
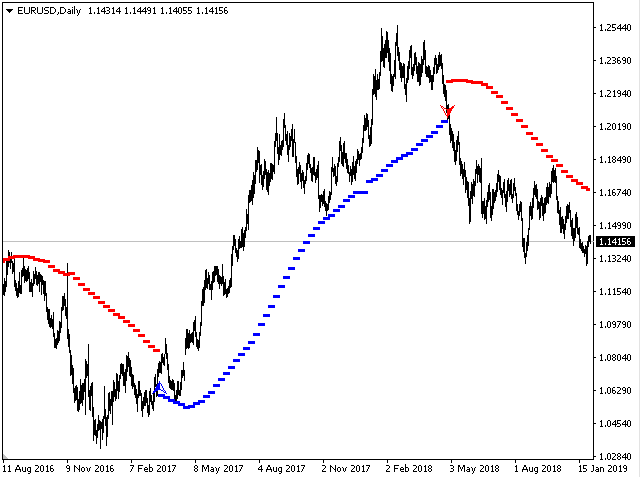
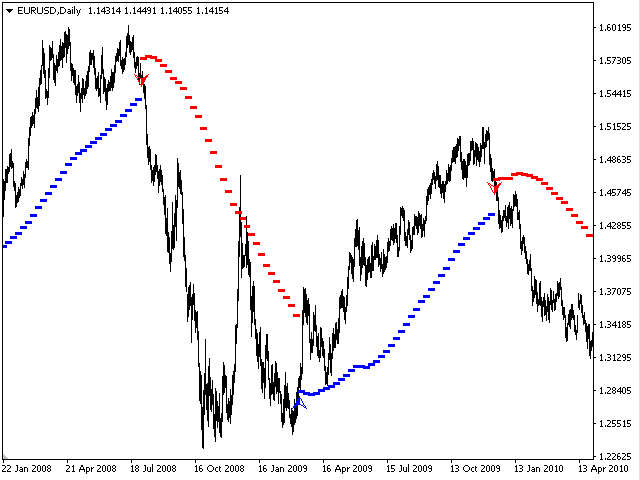
TargetX of the best Forex indicators, which is equipped with the most modern, adaptable and profitable trading algorithms. It is time to stop wandering in the dark and gain a clear vision of goals in intraday trading, for which this indicator was created.

One of the secrets of short-term trading is to know when to enter a trade. At the same time having the potential to earn the maximum number of points, but without unnecessary sitting out in the transaction in the hope of a ghostly profit. And this will help us professional forex indicator to determine the goals within the day - TargetX.

The indicator determines the trend reversal points and the direction of its movements. He will provide you with everything you need to overcome the losses due to human emotions. The indicator works fine in timeframes from one minute to four hours and informs the trader about the most successful moments of buying or selling a currency pair.
추천 제품
History Pattern Search
Yevhenii Levchenko
표시기는 현재 시세를 작성하여 과거 시세와 비교할 수 있으며 이를 바탕으로 가격 변동을 예측합니다. 표시기에는 원하는 날짜로 빠르게 이동할 수 있는 텍스트 필드가 있습니다. 옵션: 기호 - 표시기가 표시할 기호 선택. SymbolPeriod - 지표가 데이터를 가져올 기간 선택. IndicatorColor - 표시기 색상. HorisontalShift - 지시자가 그린 따옴표를 지정된 막대 수만큼 이동합니다. Inverse - true는 인용 부호를 반대로, false - 원래 보기를 반전합니다. ChartVerticalShiftStep - 차트를 수직으로 이동합니다(키보드의 위/아래 화살표). 다음은 날짜를 입력할 수 있는 텍스트 필드의 설정으로, '엔터'를 누르면 즉시 이동할 수 있습니다.
BoxChart MT4
Evgeny Shevtsov
4.4 (5)
The market is unfair if only because 10% of participants manage 90% of funds. An ordinary trader has slim changes to stand against these "vultures". This problem can be solved. You just need to be among these 10%, learn to predict their intentions and move with them. Volume is the only preemptive factor that faultlessly works on any timeframe and symbol. First, the volume appears and is accumulated, and only then the price moves. The price moves from one volume to another. Areas of volume accumu
Price vs Vwap
Pieter Gerhardus Van Zyl
Check out my German Pro Signal - https://www.mql5.com/en/signals/2354346 Price vs VWAP is a clean, non-repainting indicator that compares raw market price directly against a rolling Volume Weighted Average Price (VWAP) over a configurable time window. It plots two lines in a separate window: the real closing price and a dynamically calculated VWAP based on recent volume and price interaction. By adapting the VWAP lookback to the chart timeframe, it delivers a clear view of value versus executio
A technical indicator that calculates its readings on trading volumes. In the form of a histogram, it shows the accumulation of the strength of the movement of the trading instrument. It has independent calculation systems for bullish and bearish directions. Works on any trading instruments and time frames. Can complement any trading system. The indicator does not redraw its values, the signals appear on the current candle. It is easy to use and does not load the chart, does not require addition
Blahtech Market Profile
Blahtech Limited
4.53 (15)
Was: $249  Now: $99   Market Profile defines a number of day types that can help the trader to determine market behaviour. A key feature is the Value Area, representing the range of price action where 70% of trading took place. Understanding the Value Area can give traders valuable insight into market direction and establish the higher odds trade. It is an excellent addition to any system you may be using. Blahtech Limited presents their Market Profile indicator for the MetaTrader community. Ins
Market voleum profile
Israr Hussain Shah
Description The Market Profile & Volume Profile Indicator is a powerful technical analysis tool designed to visualize market activity and price distribution over specific timeframes. Unlike standard technical indicators that focus solely on price over time, this indicator organizes price data to show where the market spent the most time (TPO) and where the most volume was traded (Volume Profile). It automatically calculates and displays key structural levels such as the Point of Control (POC) ,
Auto Fibo Pro m
DMITRII GRIDASOV
"Auto FIBO Pro" Crypto_Forex 지표 - 거래에 유용한 보조 도구입니다! - 지표는 자동으로 Fibo 수준과 로컬 추세선(빨간색)을 계산하여 차트에 배치합니다. - Fibonacci 수준은 가격이 반전될 수 있는 주요 영역을 나타냅니다. - 가장 중요한 수준은 23.6%, 38.2%, 50%, 61.8%입니다. - 역전 스캘핑이나 존 그리드 거래에 사용할 수 있습니다. - Auto FIBO Pro 지표를 사용하여 현재 시스템을 개선할 수 있는 기회도 많습니다. - Info Spread Swap Display가 있습니다. 현재 Spread와 Swap이 부착된 외환 쌍을 표시합니다. - 디스플레이에는 계정 잔액, 자본 및 마진도 표시됩니다. - 차트의 어느 모서리에서나 Info Spread Swap Display를 찾을 수 있습니다. 0 - 왼쪽 상단 모서리, 1 - 오른쪽 상단, 2 - 왼쪽 하단, 3 - 오른쪽 하단. 여기를 클릭하여 고품질 트레이딩 로봇과
Dollar Mint Indicator
David Mwaniki Mbugua
Dollar mint indicator is a special workmanship with years of experience in forex.   Dollar mint ea is a fully non repaint indicator optimised with price action data such that once it gives you a signal t . The indicator   can be used to trade anything on the mt4 with much ease. Benefits ; Fully non repaint Use in any timeframe Use in all the available tradable assets on mt4 Best to use on h4. It generates fully analysed buy and sell signals based on trend and also filters out retracements and
This is a new strategy for SUPPLY DEMAND areas It is based on a calculation using the tick volume to detect the big price action in market for both bear /bull actions this smart volume action candles are used to determine the supply and demand areas prices in between main supply and demand lines indicate sideway market  up arrows will be shown when prices moves above the main supply and the secondary supply lines Down arrows will be shown when prices moves below the main demand and the secondary
SMC Venom Model BPR 지표는 Smart Money(SMC) 개념 내에서 일하는 트레이더를 위한 전문 도구입니다. 가격 차트에서 두 가지 주요 패턴을 자동으로 식별합니다. FVG (공정 가치 갭)는 3개의 캔들의 조합으로, 첫 번째와 세 번째 캔들 사이에 갭이 있습니다. 이는 볼륨 지원이 없는 레벨 사이에 구역을 형성하여 종종 가격 수정으로 이어집니다. BPR (균형 가격 범위)은 두 개의 FVG 패턴의 조합으로, "브리지"를 형성합니다. 이는 가격이 낮은 볼륨 활동으로 움직일 때 브레이크아웃과 레벨로의 복귀 구역으로, 캔들 사이에 갭을 생성합니다. 이러한 패턴은 거래자가 차트에서 거래량과 가격 역학을 분석하여 주요 지지/저항 수준, 돌파 구역 및 진입 지점을 식별하는 데 도움이 되며, 여기서 대형 시장 참여자와 일반 참여자 간의 상호 작용이 발생합니다. 이 지표는 사각형과 화살표 형태로 패턴을 시각화하며 유연한 경고 설정도 지원합니다. 주요 특징: 패턴 표시 모드:
Price Magnets
Ivan Simonika
Price Magnet — Price Density and Attraction Levels Indicator Price Magnet is a professional analytical tool designed to identify key support and resistance levels based on statistical Price Density. The indicator analyzes a specified historical period and detects price levels where the market spent the most time. These zones act as “magnets,” attracting price action or forming a structural base for potential reversals. Unlike traditional Volume Profile tools, Price Magnet focuses on price-time d
캔들의 종가를 예측하는 지표입니다. 지표는 주로 D1 차트에서 사용하기 위한 것이. 이 지표는 전통적인 외환 거래와 바이너리 옵션 거래 모두에 적합합니다. 지표는 독립형 거래 시스템으로 사용하거나 기존 거래 시스템에 추가로 사용할 수 있습니다. 이 표시기는 현재 양초를 분석하여 양초 본체 내부의 특정 강도 요인과 이전 양초의 매개변수를 계산합니다. 따라서 지표는 시장 움직임의 추가 방향과 현재 양초의 종가를 예측합니다. 이 방법 덕분에 지표는 단기 및 중장기 거래 모두에 적합합니다. 지표를 사용하면 시장 상황을 분석하는 동안 지표가 생성할 잠재적 신호의 수를 설정할 수 있습니다. 표시기 설정에는 이를 위한 특별한 매개변수가 있습니다. 또한 인디케이터는 새로운 신호에 대해 차트의 메시지 형태, 이메일 및 PUSH 알림 형태로 알릴 수 있습니다. 구매 후 저에게 꼭 써주세요! 나는 당신에게 지표와 거래에 대한 나의 추천을 줄 것입니다! 또한 보너스를 받으세요!
Super Reversal Pattern
Parfait Mujinga Ndalika
Super Reversal Pattern Indicator Unlock the power of advanced pattern recognition with our Super Reversal Pattern Indicator. Designed for traders seeking precision and reliability, this indicator identifies one of the most effective reversal patterns in technical analysis, offering a significant edge in your trading strategy. Key Features: Non-Repainting Accuracy: Enjoy the confidence of non-repainting technology. Once a Super Reversal Pattern is detected, it remains static, providing consiste
PipFinite Exit EDGE
Karlo Wilson Vendiola
4.83 (115)
Did You Have A Profitable Trade But Suddenly Reversed? In a solid strategy, exiting a trade is equally important as entering. Exit EDGE helps maximize your current trade profit and avoid turning winning trades to losers. Never Miss An Exit Signal Again Monitor all pairs and timeframes in just 1 chart www.mql5.com/en/blogs/post/726558 How To Trade You can close your open trades as soon as you receive a signal Close your Buy orders if you receive an Exit Buy Signal. Close your Sell orders if
Crypto_Forex 지표 "Morning Star pattern" for MT4. - 지표 "Morning Star pattern"은 가격 액션 거래에 매우 강력한 지표입니다. 다시 칠할 필요 없고 지연도 없습니다. - 지표는 차트에서 강세 Morning Star 패턴을 감지합니다. 차트에 파란색 화살표 신호가 있습니다(그림 참조). - PC, 모바일 및 이메일 알림이 있습니다. - 또한 형제인 약세 "Evening Star pattern" 지표도 사용할 수 있습니다(아래 링크를 따라가세요). - 지표 "Morning Star pattern"은 지지/저항 수준과 결합하기에 매우 좋습니다. 여기를 클릭하여 고품질 트레이딩 로봇과 지표를 확인하세요! 이것은 이 MQL5 웹사이트에서만 제공되는 오리지널 제품입니다.
The Super Arrow Indicator provides non-repainting buy and sell signals with exceptional accuracy. Key Features No repainting – confirmed signals remain fixed Clear visual arrows: green for buy, red for sell Real-time alerts via pop-up, sound, and optional email Clean chart view with no unnecessary clutter Works on all markets: Forex, gold, oil, indices, crypto Adjustable Parameters TimeFrame Default: "current time frame" Function: Sets the time frame for indicator calculation Options: Can be set
Gold Phoenix
Yaroslav Varankin
The perfect tool for Scalng in the Forex markets You can trade both from signal to signal and using take profit  The algorithm does not use Zigzag!  No redrawing!  This is a channel instrument that uses a moving average as a filter. Moving Average  There are 2 parameters for the settings Ma Period = 5 period Moving Average  Channel 1.0 distance of channel lines from the chart Price Signal Filter - calculation of signal opening and filter There is a complete set of Alert There is a multi-timefram
Ultimate Supply Demand
Ramon Sobrevals Arce
5 (3)
After working during many months, with the help of Neural Networks, we have perfected the ultimate tool you are going to need for identifying key price levels (Supports and Resistances) and Supply and Demand zones. Perfectly suitable to trigger your trades, set up your future actions, decide your Take Profit and Stop Loss levels, and confirm the market direction. Price will always move between those levels, bouncing or breaking; from one zone to another, all the remaining movements are just mark
BarsOldTimeframes
Victor Krupinskiy
The BarsOldTimeFrame indicator is designed to analyze bar formation on a higher timeframe, projecting bars from it onto the current timeframe. The indicator draws higher timeframe bars on the current chart as rectangles with filled candlestick bodies and transparent shadows. The higher timeframe and fill colors for bullish and bearish bar bodies are selected in the settings.
It will be the best tool for you to make a profit! Through unique algorithms You're going to see an amazing amount of right trading signals Make huge profits every day and realize more possibilities!   Like the car no money to buy it, the love of the girls dare not to pursue?Or the credit card bill is not paid, the rent does not have the extra money to settle?Or are you fed up with being bossed around by your boss and Hope to get more people's respect?Can't afford to buy the things you want ? wa
리페인트 없음 리드로 없음 지연 없음 모든 신호는 영구적입니다. 보이는 것이 얻는 것입니다. 일본 트레이더 커뮤니티에서 이미 사용 중 일본의 골드 트레이더 커뮤니티에서 판매 및 활발히 사용 중. 초보자도 쉽게 사용할 수 있다고 호평. 처음으로 전 세계에 공개합니다. 사용법 — 3단계 차트에 화살표 신호가 나타남 패널에서 TP 가격, SL 가격, R:R 비율 확인 주문하고 대기 추측 없음. 복잡한 분석 없음. 화살표를 따라가기만 하면 됩니다. 진입뿐 아니라 청산도 화살표 — 진입 방향과 가격 녹색 영역 — 정확한 가격의 Take Profit 목표 빨간 영역 — 정확한 가격의 Stop Loss 수준 패널에 TP, SL, R:R 비율이 숫자로 표시됩니다. 그 숫자를 주문에 입력하면 됩니다. 7개의 독립 필터 신호가 나타나기 전에 시장은 7개의 독립 필터를 통과해야 합니다: 변동성 이상 감지 — ATR 급등 및 정체 시장에서 신호 차단
WanaScalper MT4
Isaac Wanasolo
1 (1)
A scalping indicator based on mathematical patterns, which on average gives signals with relatively small SL, and also occasionally helps to catch big moves in the markets (more information in the video) This indicator has three main types of notifications: The first type warns of a possible/upcoming signal on the next bar The second type indicates the presence of a ready signal to enter the market/open a position The third type is for SL and TP levels - you will be notified every time price re
PZ Harmonacci Patterns
PZ TRADING SLU
3.17 (6)
Trade smarter, not harder: Empower your trading with Harmonacci Patterns This is arguably the most complete harmonic price formation auto-recognition indicator you can find for the MetaTrader Platform. It detects 19 different patterns, takes fibonacci projections as seriously as you do, displays the Potential Reversal Zone (PRZ) and finds suitable stop-loss and take-profit levels. [ Installation Guide | Update Guide | Troubleshooting | FAQ | All Products ] It detects 19 different harmonic pric
Dynamic Trend Sniper MT4
Vincent Georges David Ferrier
Trade Like an Institution. Protect Like a Professional. Early Sniper Access: Limited Launch Offer! Get ready to elevate your trading precision. We are offering an exclusive, highly limited launch price for the first Dynamic Trend Sniper users. Our Unbeatable Launch Offer: First 10 Snipers Only: $69 (Full lifetime access + all v1.x updates) Standard Retail Price (After 10 Purchases): $129 Why Act Now? This is not just a discount; it's a strategic entry point. We are committed to rewarding o
Volume Compair
Thiago Pereira Pinho
Professional Cumulative Delta & Volume Median Indicator Track   real buying/selling pressure   with this powerful volume analysis tool. The   Volume Compare Indicator   combines   Cumulative Delta   and   Volume Medians   to help you identify institutional activity, imbalances, and potential reversals. Key Features: Cumulative Delta Histogram   – Visualizes net buying vs. selling volume in real-time. Buy/Sell Volume Medians   – Horizontal lines showing average buy & sell volume levels. Smart Vo
We present you the indicator "Candle closing counter", which will become your indispensable assistant in the world of trading. That’s why knowing when the candle will close can help: If you like to trade using candle patterns, you will know when the candle will be closed. This indicator will allow you to check if a known pattern has formed and if there is a possibility of trading. The indicator will help you to prepare for market opening and market closure. You can set a timer to create a pre
Before
Nadiya Mirosh
The Before indicator predicts the most likely short-term price movement based on complex mathematical calculations. Most of the standard indicators commonly used in trading strategies are based on fairly simple calculations. This does not mean that there were no outstanding mathematicians in the world at the time of their creation. It is just that computers did not yet exist in those days, or their power was not enough for the sequential implementation of complex mathematical operations. Nowad
UPD1 Profile Levels
Vitaliy Kuznetsov
5 (6)
표시기는 지정된 막대 수에 대한 작업 히스토그램에서 최대 및 최소 가격 볼륨(시장 프로필)의 수준을 찾습니다.   복합 프로파일. 히스토그램의 높이는 완전 자동이며 모든 기기 및 기간에 맞게 조정됩니다. 저자의 알고리즘이 사용되며 잘 알려진 아날로그를 반복하지 않습니다. 두 히스토그램의 높이는 촛불의 평균 높이와 거의 같습니다. 스마트 경고는 볼륨 레벨에 관한 가격에 대해 알려 도움이 될 것입니다. 개념Smart Money. Low Volume - Imbalance. ,좋은 시장 상황을 찾아 시장의 구조를 결정하고 바이너리 옵션에 대한 필터로 사용됩니다. 그것은 가격에 대한 자석입니다. High Volume - Liquidity. 는 시험을 위해 축적을 나갈 때 사용됩니다. 입력 매개 변수. 기본. Bars Count - 계산 및 표시 할 막대 수. Signal Fractal = 5 (색상 신호 레벨). 수준은 다음과 같은 조건에서 신호가 될 것입니다:그것을 초과하지 않는 상
VR Grid
Vladimir Pastushak
5 (3)
VR 그리드 표시기는 사용자 정의 설정으로 그래픽 그리드를 생성하도록 설계 되었습니다. 표준 그리드 와 달리 VR 그리드는 원형 레벨 을 구축하는 데 사용됩니다. 사용자의 선택에 따라 라운드 수준 사이의 단계는 임의적일 수 있습니다. 또한 VR Grid는 다른 인디케이터나 유틸리티와는 달리 기간이 바뀌거나 단말기를 재부팅해도 그리드의 위치 를 유지합니다. 설정, 세트 파일, 데모 버전, 지침, 문제 해결 등은 다음에서 얻을 수 있습니다. [블로그] 다음에서 리뷰를 읽거나 작성할 수 있습니다. [링크] 버전 [MetaTrader 5] 수직 수준 은 실제 시간 간격을 기준으로 하며 누락 또는 존재하지 않는 기간은 무시 합니다. 따라서 레벨 사이의 단계는 사용자가 선택한 값과 엄격하게 일치합니다. VR 그리드 표시기를 사용할 때 트레이더는 모든 수준에서 스타일 , 수직선 및 수평선의 색상 및 두께를 변경할 수 있습니다. 이를 통해 금융 상품의 라운드 수준 을 제어할 수 있습니다. 라운
FREE
TPS Zero Scalper EA is a high-performance automated trading solution meticulously engineered to excel in rapid-paced market conditions. Built by the experts at Trading Public School, this EA is specifically designed for scalpers seeking precision and speed in their trading strategies. With TPS Zero Scalper EA, you gain access to a powerful algorithm that swiftly identifies micro-market trends and price differentials. The EA's lightning-fast execution and advanced risk management tools allow yo
이 제품의 구매자들이 또한 구매함
Scalper Inside PRO
Alexey Minkov
4.74 (69)
An exclusive indicator that utilizes an innovative algorithm to swiftly and accurately determine the market trend. The indicator automatically calculates opening, closing, and profit levels, providing detailed trading statistics. With these features, you can choose the most appropriate trading instrument for the current market conditions. Additionally, you can easily integrate your own arrow indicators into Scalper Inside Pro to quickly evaluate their statistics and profitability. Scalper Inside
Atomic Analyst
Issam Kassas
5 (4)
우선적으로 언급할 점은이 거래 지표가 다시 그리지 않고 지연되지 않으며 이를 통해 수동 및 로봇 거래 모두에 이상적이라는 점입니다. 사용자 매뉴얼: 설정, 입력 및 전략. Atomic Analyst는 가격의 강도와 모멘텀을 활용하여 시장에서 더 나은 이점을 찾는 PA Price Action Indicator입니다. 고급 필터를 장착하여 잡음과 거짓 신호를 제거하고 거래 잠재력을 높이는 데 도움이 됩니다. 복잡한 지표의 다중 레이어를 사용하여 Atomic Analyst는 차트를 스캔하고 복잡한 수학적 계산을 간단한 신호와 색상으로 변환하여 초보 트레이더가 이해하고 일관된 거래 결정을 내릴 수 있도록합니다. "Atomic Analyst"는 새로운 및 경험이 풍부한 트레이더를위한 종합적인 거래 솔루션입니다. 프리미엄 지표와 최고 수준의 기능을 하나의 거래 전략에 결합하여 모든 종류의 트레이더에 대한 다재다능한 선택지가되었습니다. 인트라데이 거래 및 스캘핑 전략 : 빠르고 정확한 일일
Trend Lines PRO
Roman Podpora
5 (1)
트렌드 라인즈 프로       이 지표는 시장이 실제로 어떤 방향으로 전환되는지 파악하는 데 도움이 됩니다. 실제 추세 반전 지점과 주요 시장 참여자들이 다시 진입하는 지점을 보여줍니다. 보시다시피       BOS 라인       복잡한 설정이나 불필요한 노이즈 없이 더 높은 시간대의 추세 변화와 주요 레벨을 확인할 수 있습니다. 신호는 차트에 다시 그려지지 않고 캔들이 마감된 후에도 계속 표시됩니다. VERSION MT 5   -   RFI LEVELS PRO   표시기   와 결합할 때 최대 잠재력을 발휘합니다. 지표가 보여주는 내용: 실제 변화       추세(BOS 라인) 한 번 신호가 나타나면 그 신호는 계속 유효합니다! 이는 신호를 발생시킨 후 변경될 수 있는 리페인팅 방식의 지표와 중요한 차이점입니다. 리페인팅 방식의 지표는 잠재적으로 자금 손실로 이어질 수 있습니다. 이제 더욱 높은 확률과 정확도로 시장에 진입할 수 있습니다. 또한 화살표가 나타난 후 목표가(익절)
Dynamic Scalper System
Vitalyi Belyh
5 (1)
" Dynamic Scalper System " 지표는 추세 파동 내에서 스캘핑 방식으로 거래하도록 설계되었습니다. 주요 통화쌍 및 금에서 테스트되었으며, 다른 거래 상품과의 호환성이 가능합니다. 추가적인 가격 변동 지원을 통해 추세에 따라 단기 포지션 진입 신호를 제공합니다. 지표의 원리 큰 화살표는 추세 방향을 결정합니다. 작은 화살표 형태의 스캘핑 신호를 생성하는 알고리즘은 추세 파동 내에서 작동합니다. 빨간색 화살표는 상승 방향을, 파란색 화살표는 하락 방향을 나타냅니다. 민감한 가격 변동선은 추세 방향으로 그려지며, 작은 화살표의 신호와 함께 작용합니다. 신호는 다음과 같이 작동합니다. 적절한 시점에 선이 나타나면 진입 신호가 형성되고, 선이 있는 동안 미결제 포지션을 유지하며, 완료되면 거래를 종료합니다. 권장되는 작업 시간대는 M1~H4입니다. 화살표는 현재 캔들에 형성되며, 다음 캔들이 이미 시작되었더라도 이전 캔들의 화살표는 다시 그려지지 않습니다. 입력 매개
Quantum Breakout Indicator PRO
Bogdan Ion Puscasu
4.96 (26)
소개       Quantum Breakout PRO   , 브레이크아웃 존 거래 방식을 변화시키는 획기적인 MQL5 지표! 13년 이상의 거래 경험을 가진 숙련된 트레이더 팀이 개발한   Quantum Breakout PRO는   혁신적이고 역동적인 브레이크아웃 영역 전략으로 거래 여정을 새로운 차원으로 끌어올리도록 설계되었습니다. Quantum Breakout Indicator는 5개의 이익 목표 영역이 있는 브레이크아웃 영역의 신호 화살표와 브레이크아웃 상자를 기반으로 한 손절 제안을 제공합니다. 초보자 거래자와 전문 거래자 모두에게 적합합니다. Quantum EA 채널:       여기를 클릭하세요 MT5 버전 :   여기를 클릭하세요 중요한! 구매 후 설치 매뉴얼을 받으려면 개인 메시지를 보내주십시오. 추천: 기간: M15 통화쌍: GBPJPY, EURJPY, USDJPY,NZDUSD, XAUUSD 계정 유형: 스프레드가 매우 낮은 ECN, Raw 또는 Razo
Currency Strength Exotics
Bernhard Schweigert
4.88 (33)
현재 20% 할인! 초보자 또는 전문가 트레이더를 위한 최고의 솔루션! 이 표시기는 Exotic Pairs Commodities, Indexes 또는 Futures와 같은 기호에 대한 통화 강도를 표시하는 데 특화되어 있습니다. 금, 은, 석유, DAX, US30, MXN, TRY, CNH 등의 진정한 통화 강도를 보여주기 위해 9번째 줄에 모든 기호를 추가할 수 있습니다. 이것은 독특하고 고품질이며 저렴한 거래 도구입니다. 우리는 많은 독점 기능과 새로운 공식을 통합했습니다. 새로운 추세 또는 스캘핑 기회의 정확한 트리거 포인트를 정확히 찾아낼 수 있기 때문에 거래가 어떻게 개선될지 상상해 보십시오. 사용 설명서: 여기를 클릭 https://www.mql5.com/en/blogs/post/708876 모든 시간대에 작동합니다. TREND를 빠르게 확인할 수 있습니다! 새로운 기본 알고리즘을 기반으로 설계되어 잠재적인 거래를 더욱 쉽게 식별하고 확인할 수 있습니다. 8개의
Route Lines Prices - 은 가격 방향을 찾는 데 사용되는 지표입니다. 간단한 인터페이스에는 가격 움직임 및 미래 방향 계산을 위한 다양한 알고리즘이 포함되어 있습니다. 이러한 알고리즘에는 사용된 시간대에 따른 변동성 계산 및 가격 평활화 기능이 있습니다. 이 지표는 " Calculating price values " 값을 변경하는 단일 매개변수를 제공합니다. 기본값인 1은 균형 잡힌 자동 계산을 제공하며, 별도의 설정 없이 바로 사용할 수 있습니다. 2에서 500 사이의 값을 수동으로 변경하여 자신만의 거래 시스템에 맞게 지표를 맞춤 설정할 수 있습니다. 이 지표는 M1부터 H4까지의 시간대에서 사용을 권장합니다. 모든 거래 상품에 적용 가능합니다. 신호 화살표는 캔들 종가에 생성되며, 과거 차트에는 다시 그려지지 않습니다. 메인 차트에 동일한 화살표가 표시됩니다. 다양한 유형의 알림을 사용할 수 있으며, 내장된 라인 궤적 카운터는 종가를 기반으로 작동합니다. 이는
CRT Multi-Timeframe Market Structure & Liquidity Sweep Indicator Non-Repainting | Multi-Asset | MT5 Version Available MT5 Version:   https://www.mql5.com/en/market/product/162075 Full User Guide — explains what each feature does and why:   https://www.mql5.com/en/blogs/post/767525 Quick Start User Guide  — explains how to configure and in what order:  https://www.mql5.com/en/blogs/post/767540 Indicator Overview CRT Ghost Candle HTF Fractal is a complete institutional-grade market structure too
현재 40% 할인 ! 초보자 또는 전문가 트레이더를 위한 최고의 솔루션! 이 대시보드 소프트웨어는 28개의 통화 쌍에서 작동합니다. 2가지 주요 지표(Advanced Currency Strength 28 및 Advanced Currency Impulse)를 기반으로 합니다. 전체 Forex 시장에 대한 훌륭한 개요를 제공합니다. 고급 통화 강도 값, 통화 이동 속도 및 모든(9) 시간대의 28 Forex 쌍에 대한 신호를 보여줍니다. 추세 및/또는 스캘핑 기회를 정확히 파악하기 위해 차트의 단일 지표를 사용하여 전체 시장을 볼 수 있을 때 거래가 어떻게 개선될지 상상해 보십시오! 잠재적인 거래를 식별하고 확인하면서 강력한 통화와 약한 통화를 더욱 쉽게 식별할 수 있도록 이 지표에 기능을 내장했습니다. 이 표시기는 통화의 강세 또는 약세가 증가 또는 감소하는지 여부와 모든 시간대에서 수행되는 방식을 그래픽으로 보여줍니다. 추가된 새로운 기능은 현재 시장 조건 변화에 적응하는
Advanced Supply Demand
Bernhard Schweigert
4.91 (299)
현재 40% 할인! 초보자나 전문 트레이더를 위한 최고의 솔루션! 이 보조지표는 우리가 다수의 독창적 기능과 새로운 공식을 통합한 독특하고 고품질이며 저렴한 거래 도구입니다. 이 업데이트를 통해 이중 시간대를 표시할 수 있습니다. 더 높은 TF를 표시할 수 있을 뿐만 아니라 차트 TF와 더 높은 TF 모두를 표시할 수 있습니다: 중첩 영역 표시. 모든 Supply Demand 트레이더들이 좋아할 것입니다. :) 중요한 정보 공개 Advanced Supply Demand의 잠재력을 극대화하려면 다음을 방문하십시오. https://www.mql5.com/ko/blogs/post/720245   진입 또는 목표의 명확한 트리거 포인트를 정확히 찾아냄으로 해서 거래가 어떻게 개선될지 상상해 보십시오. 새로운 알고리즘을 기반으로 매수자와 매도자 간의 잠재적인 불균형을 훨씬 더 쉽게 분간할 수 있습니다. 왜냐하면 가장 강한 공급영역과 가장 강한 수요 영역과 과거에 어떻게 진행 되었는지를(이전
Super Signal Market Slayer 비재페인트 | 고정확도 | 멀티 마켓 지능형 추세 지표 트레이딩에서 진짜 어려운 것은 주문이 아니라, 시장 변동 속에서 추세가 시작되는 순간을 정확히 파악하는 것입니다. Market Slayer 는 이를 위해 만들어졌습니다. 이 지표는 데이 트레이딩을 위해 설계된 비재페인트 지능형 지표입니다. 다중 확인 및 추세 필터링을 통해 중요한 시점에서만 명확하고 신뢰할 수 있는 Buy / Sell 신호를 제공합니다. 핵심 장점 비재페인트 신호 한 번 생성된 신호는 이동하거나 사라지지 않습니다. 고정확도 추세 판단 다양한 종목에서 테스트되었으며, 특히 골드 M5 / M15에서 안정적인 성과를 보입니다. 멀티 마켓 지원 골드, 외환, 지수, 주요 암호화폐 지원. 데이 트레이딩 최적화 M5, M15에 집중하여 노이즈를 줄이고 실행력을 향상. 직관적 구조 초보자도 쉽게 이해하고 사용할 수 있습니다. 기술 로직 요약 Market Slayer 는 단일
Super Reversal Indicator with Alert 개요 Super Reversal Indicator with Alert는 다중 시간 프레임 분석을 기반으로, 스토캐스틱 모멘텀, 수요와 공급 영역, 그리고 가격 반전 신호를 결합하여 높은 확률의 시장 반전 기회를 식별하도록 설계된 트레이딩 도구입니다. 이 지표는 명확한 시각적 신호와 실시간 알림을 통해 트레이더가 시장의 전환 지점을 쉽게 파악할 수 있도록 도와줍니다. 주요 기능 다중 시간 프레임 스토캐스틱 분석 상위 시간 프레임의 스토캐스틱 오실레이터 사용 (사용자 설정 가능) 모멘텀 변화 및 교차 신호 감지 정밀한 진입을 위한 과매수 및 과매도 구간 제공 반전 리젝션 신호 주요 가격 구간에서 강한 리젝션 캔들 감지 다음 위치에서의 반전 식별 일일 고점 (매도 반전) 일일 저점 (매수 반전) 차트에 화살표로 표시하여 직관적인 확인 가능 수요 및 공급 영역 H4 및 D1 시간 프레임에서 주요 영역 자동 표시 다음 영역 강조
Dynamic Forex28 Navigator
Bernhard Schweigert
4.43 (7)
Dynamic Forex28 Navigator - 차세대 외환 거래 도구. 현재 49% 할인. Dynamic Forex28 Navigator는 오랫동안 인기 있는 지표의 진화형으로, 세 가지의 힘을 하나로 결합했습니다. 고급 통화 Strength28 지표(695개 리뷰) + 고급 통화 IMPULSE with ALERT(520개 리뷰) + CS28 콤보 신호(보너스). 지표에 대한 자세한 정보 https://www.mql5.com/en/blogs/post/758844 차세대 Strength 지표는 무엇을 제공합니까?  원래 지표에서 좋아했던 모든 것이 새로운 기능과 더 높은 정확도로 강화되었습니다. 주요 기능: 독점적인 통화 Strength 공식.  모든 시간대에 걸쳐 부드럽고 정확한 강도선. 추세와 정확한 진입을 식별하는 데 이상적입니다. 역동적인 시장 피보나치 수준(시장 피보나치).  이 지표에만 있는 고유한 기능. 가격 차트가 아닌 통화 강도에 피보나치가 적용됩니다.
GOLD Impulse with Alert
Bernhard Schweigert
4.67 (12)
이 지표는 Advanced Currency IMPULSE with ALERT  +   Currency Strength Exotics  의 2가지 제품의 슈퍼 조합입니다. 그것은 모든 시간 프레임에 대해 작동하며 8개의 주요 통화와 하나의 기호에 대한 강약의 충동을 그래픽으로 보여줍니다! 이 표시기는 금, 이국적인 쌍, 상품, 지수 또는 선물과 같은 기호에 대한 통화 강도 가속을 표시하는 데 특화되어 있습니다. 금, 은, 오일, DAX, US30, MXN, TRY, CNH 등의 진정한 통화 강도 가속(충동 또는 속도)을 표시하기 위해 9번째 줄에 모든 기호를 추가할 수 있습니다. 새로운 기본 알고리즘을 기반으로 구축되어 잠재적인 거래를 훨씬 더 쉽게 식별하고 확인할 수 있습니다. 이는 통화의 강세 또는 약세가 가속되는지 여부를 그래픽으로 표시하고 가속 속도를 측정하기 때문입니다. 자동차의 속도계처럼 생각하면 됩니다. 가속화할 때 Forex 시장에서 동일한 일이 분명히 더 빠르
Reversal Master
Alexey Minkov
4.8 (15)
The Reversal Master is an indicator for determining the current direction of price movement and reversal points. The indicator will be useful for those who want to see the current market situation better. The indicator can be used as an add-on for ready-made trading systems, or as an independent tool, or to develop your own trading systems. The Reversal Master indicator, to determine the reversal points,  analyzes a lot of conditions since the combined analysis gives a more accurate picture of t
FX Power MT4 NG
Daniel Stein
4.95 (21)
FX Power: 통화 강세 분석으로 더 스마트한 거래 결정을 개요 FX Power 는 어떤 시장 상황에서도 주요 통화와 금의 실제 강세를 이해하기 위한 필수 도구입니다. 강한 통화를 매수하고 약한 통화를 매도함으로써 FX Power 는 거래 결정을 단순화하고 높은 확률의 기회를 발견합니다. 트렌드를 따르거나 극단적인 델타 값을 사용해 반전을 예측하고자 한다면, 이 도구는 귀하의 거래 스타일에 완벽히 적응합니다. 단순히 거래하지 말고, FX Power 로 더 스마트하게 거래하세요. 1. FX Power가 거래자에게 매우 유용한 이유 통화와 금의 실시간 강세 분석 • FX Power 는 주요 통화와 금의 상대적 강세를 계산하고 표시하여 시장 역학에 대한 명확한 통찰력을 제공합니다. • 어떤 자산이 앞서고 있고 어떤 자산이 뒤처지는지 모니터링하여 보다 현명한 거래 결정을 내릴 수 있습니다. 포괄적인 멀티 타임프레임 뷰 • 단기, 중기 및 장기 타임프레임에서 통화와 금의 강세를
Volatility Trend System - a trading system that gives signals for entries. The volatility system gives linear and point signals in the direction of the trend, as well as signals to exit it, without redrawing and delays. The trend indicator monitors the direction of the medium-term trend, shows the direction and its change. The signal indicator is based on changes in volatility and shows market entries. The indicator is equipped with several types of alerts. Can be applied to various trading ins
RFI levels PRO
Roman Podpora
5 (1)
이 지표는 추세 반전 지점과 가격 반등 영역을 정확하게 보여줍니다.       주요 투자자들   . 새로운 트렌드가 형성되는 곳을 파악하고 최대한 정확하게 의사결정을 내리며 모든 거래를 완벽하게 통제합니다. TREND LINES PRO   지표와 함께 사용할 때 최대의 잠재력을 발휘합니다.  VERSION MT5 지표가 보여주는 내용: 새로운 추세의 시작 시 활성화되는 반전 구조 및 반전 수준. 최소한의 위험 대비 수익률을 갖는 이익 실현   (TAKE PROFIT)   및   손절매(STOP LOSS)   레벨 표시       RR 1:2   . 지능형 손실 감소 로직이 적용된 손절매 기능. 지정된 지표에서 두 가지 추세 유형에 대한 반전 패턴을 표시합니다. 지표: 트렌드를 따라   트렌드 라인 프로   (글로벌 트렌드 변화) 트렌드 프로   (빠른 트렌드 변화) 간단하고 효과적입니다       스캐너       실시간 추세 (신규). 다중 시간 프레임 도구 필터링. 표시하다  
Binary Volume Edge – Martingale Stats  Indicator for binary options with live pre-signals and full martingale stats Binary Volume Edge – Martingale Stats is a professional tool that combines powerful signal filtering, smart martingale analysis, and a unique early warning system. No magic – just clear rules and verifiable stats. What do you get? 1. Signals you can trust Absolute absence of redrawing – arrows appear only on closed candles and never change again. Preliminary signals on t
Harmonic Pattern Plus MT4
Young Ho Seo
4.44 (18)
Introduction Harmonic Patterns are best used to predict potential turning point. Traditionally, Harmonic Pattern was identified manually connecting peaks and troughs points in the chart. Manual harmonic pattern detection is painfully tedious and not suitable for everyone. You are often exposed under subjective pattern identification with manual pattern detection. To avoid these limitations, Harmonic Pattern Plus was designed to automate your harmonic pattern detection process. The functionality
Currency Strength Matrix
Raymond Gilmour
4.5 (26)
THE ONLY CURRENCY STRENGTH INDICATOR THAT IS BASED ON PRICE ACTION. DESIGNED FOR TREND, MOMENTUM & REVERSAL TRADERS This indicator  reads price action to confirm trend and strength . Advanced multi-currency and multi-time frame indicator that shows you simply by looking at one chart, every currency pair that is trending and the strongest and weakest currencies driving those trends. For full details on how to use this indicator, and also how to get a FREE chart tool, please see user manual HERE
Sygnalizator
Kacper Piskorz
Hi, I made one of best sygnalizators on a stock markets. It's prepared for a pro players. There is not even, a one mistake. It works on every timeframe and every stock market. Test it before you say something, in my 7 years I check houndreds of fakes. This one work right in time, not in slow motions. It' s a dot with 3 levels of strong power depends on how strong market is. If power is high you have very profitable results but the most important it's allways on time. So it is protecting your acc
Wave Cycle Counter
Eric Evert Ouweneel
Wave and Cycle counter to give an immediate indication how far the ongoing trend has progressed. Low numbers: trend has just started, ride the trend. Higher numbers: trend is 'older', watch for reversals This indicator is 100% compatible with the fantastic TopDog trading strategy. (I will NOT give any details about this Top Dog strategy) The trend direction is determined by a SMA value (or any other MA) you can set. Waves and cycles numbers and letters are derived from a SlowStoch setting. Wave
Miraculous Indicator – Gann Square of Nine 기반 100% 비리페인트 Forex 및 바이너리 도구 이 영상은 Miraculous Indicator 를 소개합니다. 이 지표는 Forex 및 바이너리 옵션 트레이더를 위해 특별히 개발된 매우 정확하고 강력한 트레이딩 도구입니다. 이 지표가 독특한 이유는 전설적인 **Gann Square of Nine(Gann 9의 사각형)**과 **Gann's Law of Vibration(Gann 진동의 법칙)**에 기반을 두고 있기 때문입니다. 이는 현대 트레이딩에서 가장 정밀한 예측 도구 중 하나로 손꼽힙니다. Miraculous Indicator는 완전히 비리페인트(non-repaint) 됩니다. 즉, 캔들이 마감된 후에도 신호가 변경되거나 사라지지 않습니다. 보이는 것이 곧 결과입니다. 이는 트레이더가 자신감을 가지고 거래에 진입하고 청산할 수 있는 신뢰할 수 있고 일관된 기반을 제공합니다. 주요 특징: Gann
Cyclic Impulse
Vitalyi Belyh
차트를 구조화하고 주기적인 가격 변동을 식별하는 기술 지표입니다. 모든 차트에서 작업할 수 있습니다. 다양한 유형의 알림. 그래프 자체에도 추가 화살표가 있습니다. 역사를 재구성하지 않고, 촛불을 닫는 작업에 임한다. M5 이상에서 권장되는 TF입니다. 사용 및 구성이 쉬운 매개변수입니다. 매개변수가 다른 2개의 지표를 사용하는 경우, 다른 지표 없이 해당 지표만 사용할 수 있습니다. 2개의 입력 매개변수가 있습니다 주기성과 신호 지속 시간 이 2개의 매개변수는 차트 구조의 처리와 관련이 있습니다. Cyclicity - 역전 주기가 얼마나 자주 바뀌는지 조절하고 주기를 매끄럽게 합니다. Signal duration - 최소 숫자에서는 가격 움직임의 충격을 감지하고, 최대 숫자에서는 장기적 추세 움직임을 감지합니다.. --------------------------------
FX Volume
Daniel Stein
4.63 (38)
FX Volume: 브로커 시각에서 바라보는 진짜 시장 심리 간단 요약 트레이딩 접근 방식을 한층 더 향상시키고 싶으신가요? FX Volume 는 소매 트레이더와 브로커의 포지션을 실시간으로 파악할 수 있게 해 줍니다. 이는 COT 같은 지연된 보고서보다 훨씬 빠릅니다. 꾸준한 수익을 추구하는 분이든, 시장에서 더 깊은 우위를 원하시는 분이든, FX Volume 을 통해 대규모 불균형을 찾아내고, 돌파 여부를 확인하며 리스크 관리를 정교화할 수 있습니다. 지금 시작해 보세요! 실제 거래량 데이터가 의사결정을 어떻게 혁신할 수 있는지 직접 경험해 보시기 바랍니다. 1. 트레이더에게 FX Volume이 매우 유익한 이유 탁월한 정확도를 지닌 조기 경보 신호 • 다른 사람들보다 훨씬 앞서, 각 통화쌍을 매수·매도하는 트레이더 수를 거의 실시간으로 파악할 수 있습니다. • FX Volume 은 여러 리테일 브로커에서 추출한 실제 거래량 데이터를 종합해 명확하고 편리한 형태로 제공하는
GEM Signal MT4
Shengzu Zhong
GEM Signal Pro GEM Signal Pro는 MetaTrader 4용 추세추종형 지표로, 차트에서 더 명확한 신호, 더 구조적인 트레이드 설정, 그리고 더 실용적인 리스크 관리를 원하는 트레이더를 위해 설계되었습니다. 단순한 화살표만 표시하는 것이 아니라, GEM Signal Pro는 전체 트레이드 아이디어를 더 깔끔하고 읽기 쉬운 방식으로 보여줍니다. 조건이 확인되면 진입가, 손절가, 목표가를 차트에 표시하여 트레이더가 설정을 더 효율적으로 검토할 수 있도록 도와줍니다. 작동 방식 이 지표는 먼저 내부 로직에 따라 유효한 초기 신호를 식별합니다. 확인 조건이 충족되면, GEM Signal Pro는 차트에 전체 설정을 표시합니다. 이를 통해 트레이더는 거래 구조를 더 명확하게 보고, 수동 분석 작업을 줄일 수 있습니다. 차트에 표시되는 거래 레벨 확인된 신호에 대해, GEM Signal Pro는 다음을 표시할 수 있습니다. 진입가 손절가 목표가 1 목표가 2 목표가 3 손
Linear Trend Predictor - 진입 지점과 방향성 지원선을 결합한 추세 지표입니다. 고가/저가 채널을 돌파하는 원칙에 따라 작동합니다. 지표 알고리즘은 시장 노이즈를 걸러내고 변동성과 시장 역학을 고려합니다. 표시기 기능  평활화 방법을 사용하여 시장 추세와 BUY 또는 SELL 주문을 시작하기 위한 진입 시점을 보여줍니다.  모든 기간의 차트를 분석하여 단기 및 장기 시장 움직임을 파악하는 데 적합합니다.  어떠한 시장과 시간대에도 적용할 수 있으며, 입력 매개변수를 통해 거래자는 자신에게 맞게 지표를 독립적으로 사용자 지정할 수 있습니다.  설정된 지표 신호는 사라지거나 다시 그려지지 않습니다. 이는 캔들 마감 시 결정됩니다.  여러 유형의 알림이 화살표와 결합되어 있습니다.  이 지표는 독립적인 거래 시스템으로 사용할 수도 있고, 다른 거래 시스템에 추가하는 용도로도 사용할 수 있습니다.  모든 수준의 경험을 가진 거래자가 사용할 수 있습니다. 주요 매
Hidden Block Finder MT4
Umar Ilyas Raja Muhamma Ilyas
히든 블록 인디케이터 프로 트레이딩 도구   제품 개요 Hidden Block 인디케이터는 차트에서 숨겨진 기관 반응 구역을 표시하는 구조 기반 도구입니다.   주요 기능 내부 구조 기반 자동 블록 탐지 동적 지지·저항 시장 구조·추세와 정렬 변동성 기반 검증 깔끔한 차트 모든 종목·타임프레임 지원 확정 후 재도색 없음   왜 Hidden Block? 큰 움직임 전 가격이 조용히 반응하는 지점.   사용 방법 추세 파악 블록 재진입 대기 구조 변화/캔들 반응 확인 진입 & 리스크 관리 구역으로 활용   대상 SMC, 구조·프라이스액션 트레이더   호환성 MT4 & MT5   성능 낮은 CPU 사용 고변동 장에서도 안정 히스토리 재계산 없음   주의 단독 시스템 아님.   FAQ 재도색? → 없음 초보자? → 기본 구조 지식 필요 단독 사용? → 불가   설명 가격이 Hidden Block에서 멈추거나 반전하거나 지속함
Smart Price Action Concepts
Issam Kassas
4.75 (12)
우선적으로, 이 거래 도구는 전문적인 거래에 이상적인 비-다시 그리기 및 지연되지 않는 지표입니다.  온라인 강좌, 사용자 매뉴얼 및 데모. 스마트 가격 액션 컨셉트 인디케이터는 신규 및 경험 많은 트레이더 모두에게 매우 강력한 도구입니다. Inner Circle Trader Analysis 및 Smart Money Concepts Trading Strategies와 같은 고급 거래 아이디어를 결합하여 20가지 이상의 유용한 지표를 하나로 결합합니다. 이 인디케이터는 스마트 머니 컨셉트에 중점을 두어 대형 기관의 거래 방식을 제공하고 이동을 예측하는 데 도움을 줍니다.  특히 유동성 분석에 뛰어나 기관이 어떻게 거래하는지 이해하는 데 도움을 줍니다. 시장 트렌드를 예측하고 가격 변동을 신중하게 분석하는 데 탁월합니다. 귀하의 거래를 기관 전략에 맞추어 시장의 동향에 대해 더 정확한 예측을 할 수 있습니다. 이 인디케이터는 시장 구조를 분석하고 중요한 주문 블록을 식별하고 다양한
제작자의 제품 더 보기
Fortune
Andriy Sydoruk
3 (2)
Advisor (Fortune): Your Reliable Tool for High-Frequency Forex Trading The Fortune advisor is designed to be used on any timeframe, any currency pair, and on any broker's server. Its unique trading system makes it a versatile tool for traders. For optimal performance, it is recommended to trade liquid forex pairs, maintain a low spread, and use a VPS. You can start with a $100 deposit and a lot size of 0.01. Key Features and Benefits High-Frequency Trading : Utilizes two trading options: with v
ForexTrendMT4
Andriy Sydoruk
5 (1)
ForexTrendMT4 Indicator: A Reliable Tool for Market Tracking The ForexTrendMT4 indicator offers reliable market trend tracking, filtering out sudden fluctuations and market noise. This tool helps identify trends and signals favorable entry points into the market using arrows. It is suitable for both scalping on shorter timeframes and long-term trading strategies. Based on the principles of technical analysis, ForexTrendMT4 takes into account the cyclical nature of the market. Key Features and A
Agile
Andriy Sydoruk
This is a professional Expert Advisor, which implements the strategy of trading using the Divergents and DivergentsPoint indicators, as wells as filters of the global trend on higher periods. Analyzing the indicators, the system enters the market with a limited martingale and the ability to open up to 8 orders in one direction. Each series of orders has mandatory TakeProfit and StopLoss levels. Also, a trailing stop based on the SAR indicator is activated for a series in breakeven. The robot aut
Divergents
Andriy Sydoruk
Indicator of divergences. It can help you identify the flat and trend areas. It can be applied as a trading filter. It has only one parameter - Period . The indicator does not show entry points, but only visualizes the information. Keep in mind that the approach to trading should be comprehensive, additional information is required for entering the market. Parameters Period - period of the indicator.
DivergentsPoint
Andriy Sydoruk
Trend indicator based on the price divergence. It can help you in finding the entry points during the analysis. It can be applied as a trading filter. It has two parameters: Period and Level . The Level parameter allows filtering out unnecessary signals. For example, the Level parameter can be set to 0.0001 for EURUSD. The indicator can work both as an entry point generator and as a filter. The indicator clearly visualizes the information. Keep in mind that the approach to trading should be comp
RaptorF4
Andriy Sydoruk
2.6 (5)
The Expert Advisor system works with ticks. Works with a deposit of $100! The elementary unit of analysis for an internal algorithm is a tick. Classical scalping trading method. The robot works well on any historic period with any currency pair. The key value is spread, with default settings can work with the spread up to 10. If the spread is greater than 10, you should use other parameter values. Testing was performed with the spread up to 10 on all ticks. Testing using open prices makes no sen
Carousel
Andriy Sydoruk
Carousel expert system compensates drawdowns. The main indicator is Divergents . The EA allows working in one direction (for example, sell order series), while another direction (for example, buy order series) is in drawdown (compensation mode). If series in both directions operate in normal mode, the system does not switch to compensation mode. If a drawdown is detected in one of the directions, the EA goes into the compensation mode and starts compensating the loss-making series by the profita
Versatile
Andriy Sydoruk
Versatile expert system follows the principle "stay in the market for as long as possible". The main indicators are Moving Average and Relative Strength Index. The EA supports working in two directions simultaneously both following a trend and against it depending on the settings. A limited number of orders LimitOrders is used for operation. The EA correctly handles errors and reliably works with a deposit 1000 USD and higher. M5 and higher timeframes are supported. The EA has very flexible sett
IdeaClassic
Andriy Sydoruk
Экспертная система IdeaClassic создана для спокойной торговли на рынке. Основная ее задача - работа с одни ордером без увеличения лота с обязательными стопами, причем стоп-лосс и тейк-профит должны быть одного порядка. Также есть возможность использовать трейлинг-стоп. Для формирования входного сигнала используется индикатор IdeaTrend . Для анализа данного индикатора используется функция, которая может анализировать данные индикатора комплексно. Анализируется до десяти последних сигналов от инди
IdeaIlan
Andriy Sydoruk
5 (1)
IdeaIlan expert system applies IdeaTrend indicator. The EA applies the martingale principle. The EA allows trading in two directions simultaneously. It also has a full set of tools allowing the EA to follow a trend and add to a position if the trend moves in unfavorable direction. The EA correctly handles errors and reliably works with a deposit of 10 000 USD and higher. M5 and higher timeframes are supported. Stop levels and trailing stop are applied. Parameters Magic - magic number; Requotes
PowerFlash
Andriy Sydoruk
PowerFlash - Советник реализует известную торговую стратегию на основе сетки. Это автоматическая торговая система. Вся работа автоматизирована. Бот использует минимум настроек.  Бот работает следующим образом. Выставляется, одновременно, сетка отложенных ордеров в обе стороны от текущей цены на дистанции, указанной пользователем. Размер сетки регулируется от 1 до 100. После чего, куда бы ни пошел рынок, отложенные ордера будут переходить в рыночные. Если рыночные ордера зайдут в общий профит, то
SpatialJump
Andriy Sydoruk
A unique expert system that works as without optimization, with the same settings (although it can be optimized if desired, especially for some brokers). You can test as you like, all ticks, control points, opening prices. The figure has an example. The potential result when testing an average of 100-500% over 3 years. It is recommended to make a multi-currency, if you choose a balanced combination, you can get results up to 500-1000% per annum with potential testing. Verified by EURUSD. The bot
Prophet
Andriy Sydoruk
Prophet is a trend indicator. Shows the direction of turning points. Can be used with an optimal risk-to-profit ratio. The arrows indicate favorable moments and directions for entering the market. Uses one parameter for setting (adjust from 1 to 3). The probability of a successful trend is very high. In the course of work, the take-profit is much larger than the stop-loss! Works on all currency pairs and on all timeframes.
Trendes
Andriy Sydoruk
The Trendes indicator works on all currency pairs and on all timeframes. The arrows indicate favorable moments and directions for entering the market. The probability of a successful trend is very high. Trendes can be used for both small pits and long-term trading. The indicator determines the entry points according to the methods described in the book "How to play and win on the stock exchange". Options LengthA  - The number of bars for calculating the first function; LengthB - The number of b
Martingal
Andriy Sydoruk
The indicator Martingal works on all currency pairs and on all timeframes. The arrows indicate the optimal input points for the future Martingale averaging, even with a zero exponent. The indicator shows the signal to close the series only if all the previous signals can be closed in the profit. After closing the series in profit, you must immediately open the order in the direction of the signal. Thus, the signal for closing is simultaneously the point of reverse opening to the other side of th
Spin
Andriy Sydoruk
If you do not yet have your trading strategy, you can take advantage of our ready-made trading strategy, which is most effective! The trend indicator Spin is created on the basis of price divergence. Will help in finding the entry points for analysis. Can be used as a filter in the trade. Has one Length parameter. The indicator can work for both entry points and filters. The indicator reflects information in a visual form. Do not forget that the approach to trading should be comprehensive, to en
Variator
Andriy Sydoruk
Intelligent algorithm indicator Variator with accuracy generates input signals and output levels. If the average price is blue, you should look for entry points to open long positions when the market is not overbought, and if the average price is red, you should look for entry points to open short positions when the market is not oversold. The rules can be summarized as follows. You should buy during an uptrend when the price reaches the average or oversold, and sell during a downtrend when the
Prognosticator
Andriy Sydoruk
This indicator shows not just a line of the price balance, but also forecasts it for the specified number of bars ahead. That is, the level of the probable balance of the price reflects on the chart in the future. The level of balancing is set by the Balance parameter, that is, it can be drawn at any level. Forecasting the future with the Shift parameter. The indicator reflects information in a visual form. Do not forget that the approach to trading should be comprehensive, to enter the market r
Tic Tac Toe
Andriy Sydoruk
The algorithm of the Tic Tac Toe indicator differs from the usual indicators on the price charts in that it completely ignores the flow of time and reflects only changes in the price. Instead of displaying the time intervals on the X axis, and the price value on the Y axis, the Tic Tac Toe indicator displays price changes on both axes. The indicator displays in red if prices rise by a certain base value (TicTacToe) and blue if prices fall on the same value. If prices fell / rose by less than a c
FiboZag
Andriy Sydoruk
Indicator FiboZag - transfer the indicator to the chart and the Fibonacci levels will be built automatically on the last ZigZag turn. The main advantage lies in the correct construction of Fibonacci levels and markup of price levels. Simple, visual and effective use. The indicator is not redrawn and does not lag. Works on all currency pairs and on all timeframes.
TrendCloud
Andriy Sydoruk
Realization of trend movement indication with points for potential stops in the TrendCloud indicator. It can be easily used as an independent trading system. You can interpret this: the location of the course above or below the shadows show the presence of a trend. The transition to the shadow warns of a possible reversal. Entering the price inside the shadow speaks in a flat motion. The indicator tracks the market trend with unsurpassed reliability, ignoring sharp market fluctuations and noises
Doonchian
Andriy Sydoruk
The Doonchian channel consists of two channel displays. Channel lines are determined by a simple and reliable algorithm. The channel is preferably used for trading inside the channel. The indicator does not redraw and does not lag; simple algorithms are the basis of the work. It works on all currency pairs and on all timeframes. As always a warning, we must not forget that the approach must be comprehensive, the indicator signals require additional information to enter the market.
VictoryCPM
Andriy Sydoruk
The VictoryCPM (Currency Power Meter) indicator will show the strength of currency pairs. The indicator is created for those traders who prefer to trade several currency pairs at once. This tool is able to display on the trading chart data on the current strength of various currencies. The foreign exchange market has a dynamic structure, which is why different currencies affect each other. For this reason, in order to identify the optimal point for creating an order, it is necessary to familiari
Progressive
Andriy Sydoruk
The  Progressive  Expert System works using sharp tick movements. Works with a deposit of $ 100! The classic method of trading scalping. It is also worth noting that with the allowable spread level, the bot goes through any historical period on any currency pair. There is no point in testing at opening prices, either checkpoints or all tics. It is possible to work on accounts with a floating spread, entry into the market will occur only when the spread is lower than the level specified in the se
Element33
Andriy Sydoruk
Экспертная система Element33 работает, на любых типах счетов. Работает как в 4-х так и с 5-значными котировками. Спрэд и реквоты не критичны, подойдет любой брокер. Экспертная система разбивает историю на 4 квартала, для оптимизации рекомендовано три года на периоде H1 или H4. Оптимизацию можно проводить по ценах открытия, результаты мало отличаются от тестирования по реальным тикам, поскольку бот работает по ценам открытия. Оптимизировать достаточно один раз в месяц! Для получения более хороших
FiboPoint
Andriy Sydoruk
A trend indicator that shows the direction of pivot points. It can be used with an optimal risk to reward ratio. The probability of a success trend is very high. The indicator uses arrows to show favorable time to enter the market and market entry directions. Uses only one adjustable parameter (a value from 1 to 3). Take profit is much larger than stop loss! The indicator works on all currency pairs and time frames.
WiseBW
Andriy Sydoruk
The  WiseBW  indicator simplifies decision making by recognizing turns using the built-in algorithm, and then confirms signals at support / resistance levels. Thus, the indicator tracks the market trend with unsurpassed reliability, ignoring sharp market fluctuations and noise around the average price. The indicator can be used both for pipsing at small periods, and for long-term trading. Options: updown  - offset pips for indentation of icons; back  - how many bars to take into account; CountBa
TrendCross
Andriy Sydoruk
The indicator bounds the price according to a cyclic wave dependency using moving averages. Thus, all the crossing points, in which the movement is changed considering the indicator period, are the optimal ones. The crossing points can be used as the potential market reversal points. However, do not forget about the complex approach: the indicator signals require additional data to enter the market.
ComplexPulse
Andriy Sydoruk
ComplexPulse - pulse indicator or signal. Sensitive and responsive to price movements. The indicator shows the interdependence of various currency pairs, namely: USD, EUR, GBP, CHF, JPY. Currencies are measured in relative units, so in each unit of time the sum of all currencies will be equal to zero. Hence, one of the main elements of cluster indicators is the zero line, or the balance line (zero line). If a currency is below the balance line, then it is said that the currency is oversold rela
RegressionXP
Andriy Sydoruk
Индикатор RegressionXP рассчитывает два типа регрессии и вычисляет среднеквадратичную девиацию цены на данном диапазоне. Важна прямая золотая линия (регрессия первой степени), показывающая направление и состояние текущего тренда на выбранном таймфрейме. Чем больше угол с горизонталью, тем сильнее тренд. Таким образом, мы имеем возможность делать выводы относительно состояния валютной пары по текущему расположению цены относительно линии регрессии. На расстоянии от золотой линии проходят параллел
필터:
리뷰 없음
리뷰 답변