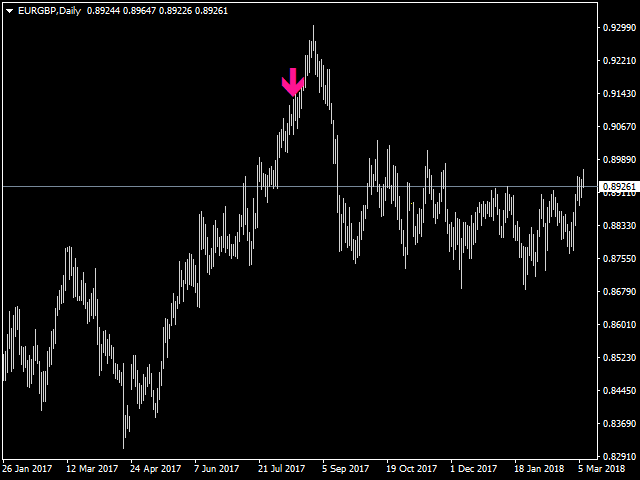
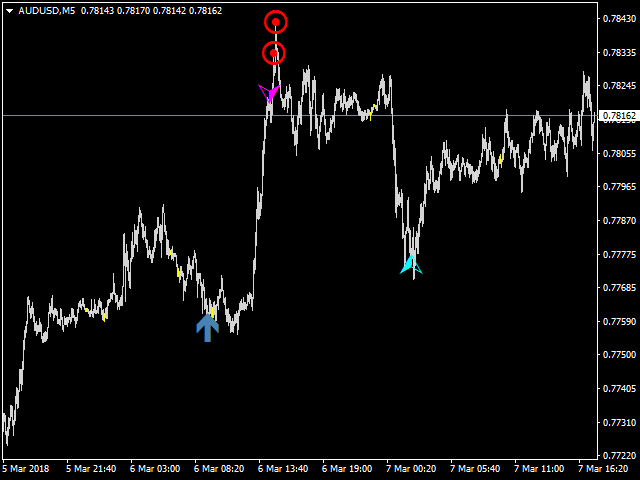
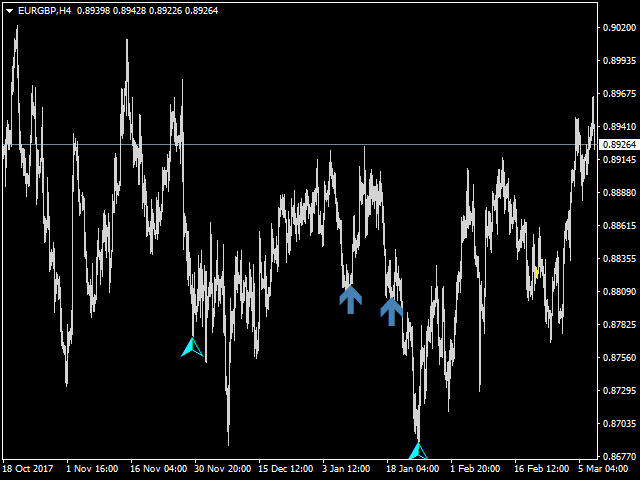
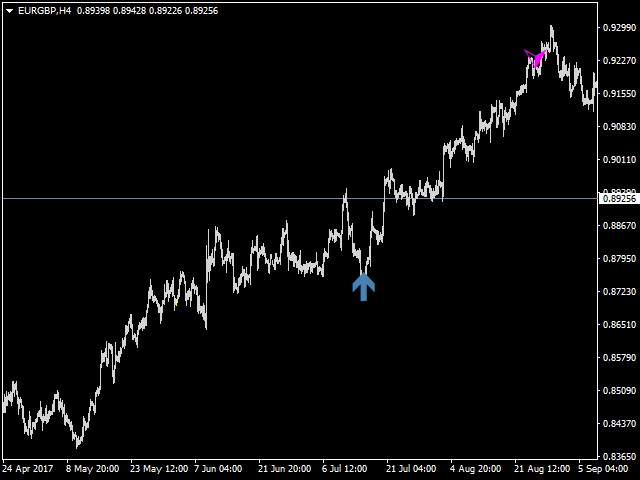
Reversal 4 Signal
- 지표
-
Reda Hadhod
 Adopted on the basis of supply and demand in determining the areas of entry and exit My way is not
affected by the news, is the Volume of the most important ways in which followed as it allows me areas - 버전: 1.0
- 활성화: 5
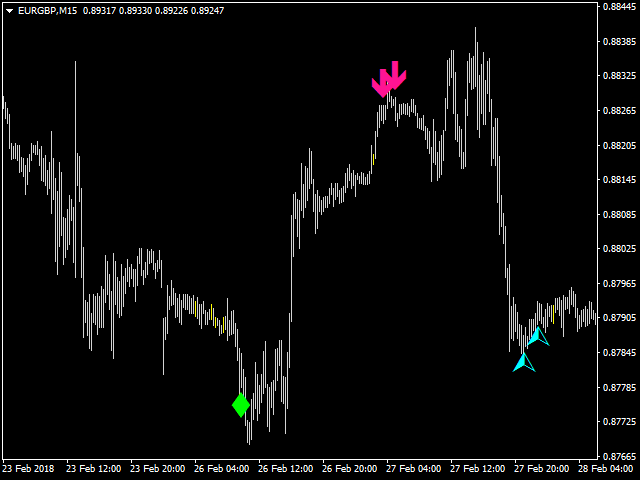
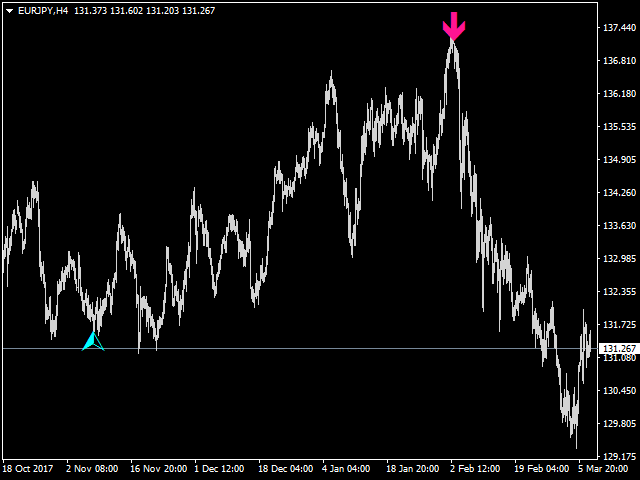
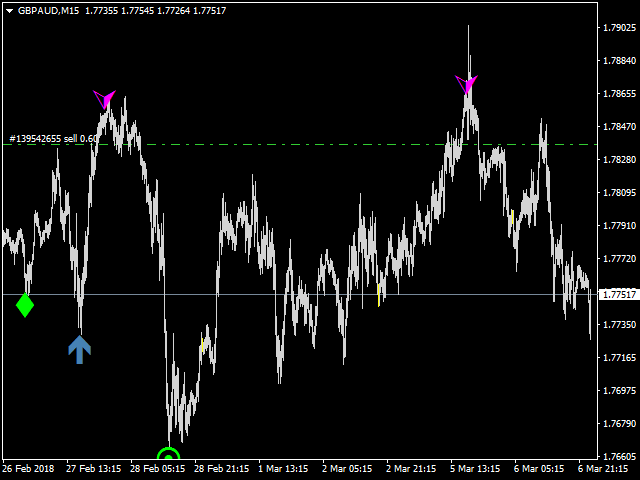
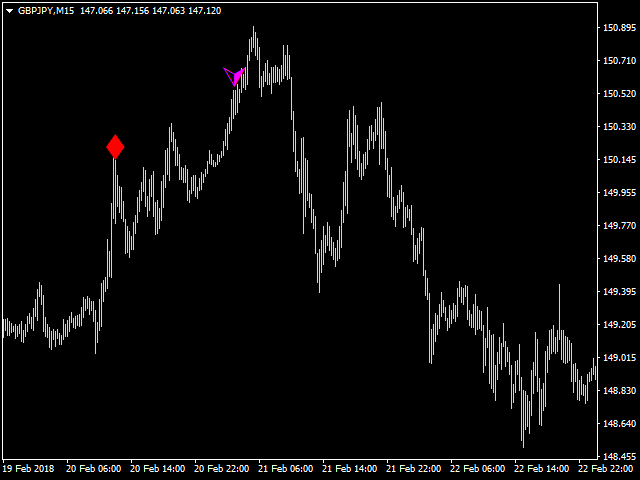
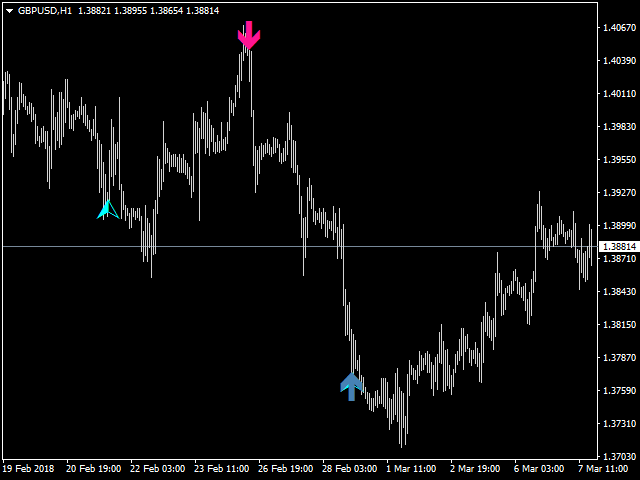
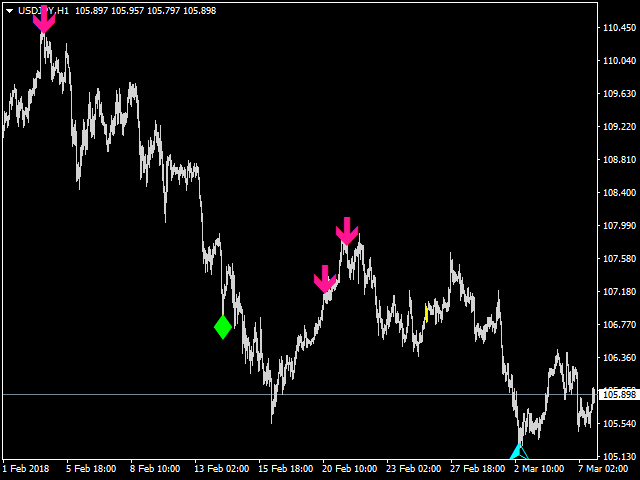
The indicator displays market entry arrows based on RSI, MFI, DeMarker, CCI and Multi Stochastic.
Inputs
- period — values of all indicators used.
- Enable_Alert — audio and text notifications on a trend change.
- Send_Notifications — push notifications to mobile devices.
- E-mail alert — email notifications. Make sure to configure email parameters in the terminal settings.
Features
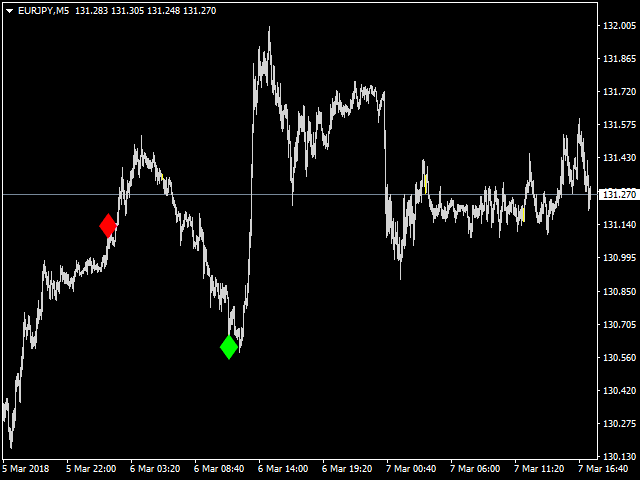
- The indicator does not repaint.
- The indicator does not recalculate.
- The indicator works on all timeframes.
- The indicator works on all pairs, stocks, currencies, metals, futures and CFDs.
- It gives signals on the current candle.
How to Trade?
- Open a buy trade when an up arrow appears.
- Open a sell trade when a down arrow appears.