TSO Currency Trend Aggregator

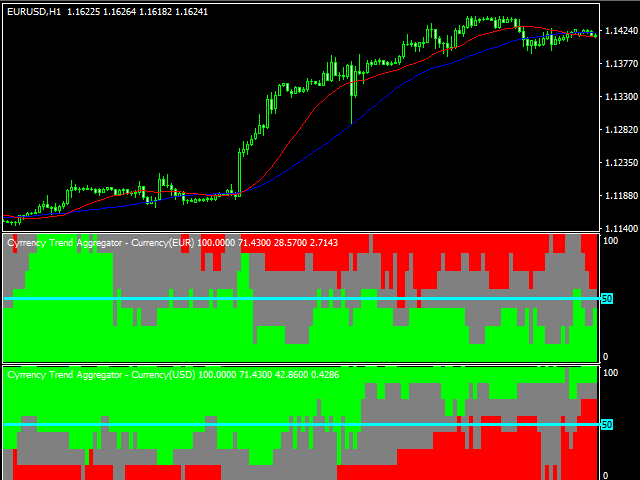
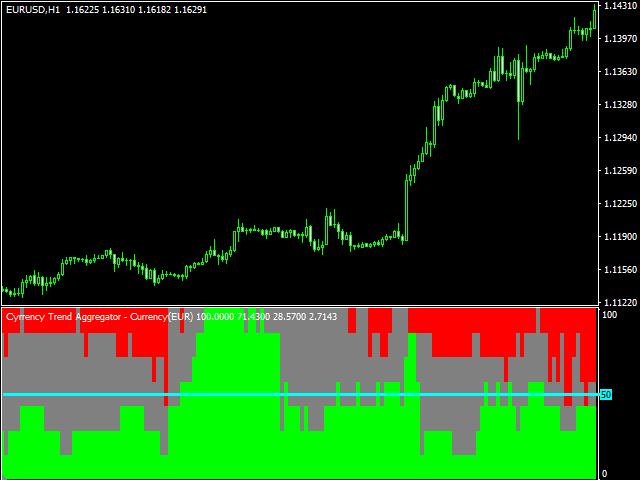
The TSO Currency Trend Aggregator is an indicator that compares a selected currency's performance in 7 different pairs.

  • Instantly compare how a currency is performing in 7 different pairs.
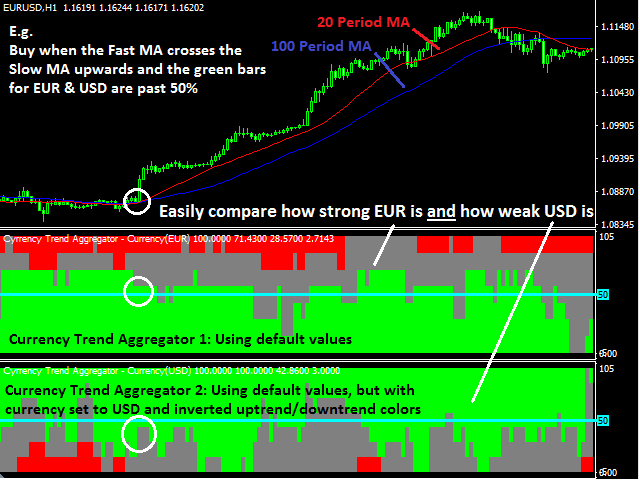
  • Easily get confirmation of a currency's strength
  • Combine the indicator for both currencies of a pair to get the total view of how strong/weak each currency is.
  • The trend is classified as positive (green), negative (red) or neutral (grey).
  • Can easily be used in an EA (see below)


Currencies

  1. EUR
  2. USD
  3. GBP
  4. JPY
  5. AUD
  6. NZD
  7. CAD
  8. CHF


Definitions

  1. Positive Trend (green): When the fast MA is above the slow MA and below the current price.
  2. Negative Trend (red): When the fast MA is below the slow MA and above the current price.
  3. Neutral (grey): Any other case.

This indicator reads prices from 7 different Forex pairs at a time. Ensure that the price history for all pairs has been downloaded before testing it in the strategy tester. The indicator will show trend signals only for the time periods for which data for all required pairs are available. It will be blank during the time periods for which no data are available.


Inputs

  1. Symbol: The currency to be compared.
  2. Prefix: If the currency pairs provided by your broker have a prefix before the name of the pair input it here.
  3. Suffix: If the currency pairs provided by your broker have a prefix before the name of the pair input it here (e.g. for EURUSD.m input .m)
  4. Timeframe: The timeframe on which the moving averages are applied.
  5. Fast MA Period: The period of the fast moving average.
  6. Fast MA Method: The type of the fast moving average
  7. Fast MA Applied Price: The candle price on which the fast moving average is based
  8. Slow MA Period: The period of the slow moving average.
  9. Slow MA Method: The type of the slow moving average
  10. Slow MA Applied Price The candle price on which the fast moving average is based


For EA Developers

  • Buffer 3: Returns a double with two decimals.
    • The number on the left of the decimal point shows the dominant trend and takes values:
      • 0 = Uptrend
      • 1 = Downtrend
      • 2 = No trend
    • The number on the right of the decimal point shows the percentage of pairs that are in the dominant direction rounded to 2 digits.
    • For example, if the dominant trend is downtrend (1) and there is a downtrend in 3 out of 7 pairs (3/7*100 ≈ 43), the return value is 1.43
추천 제품
This is a combination of multiple oscillators into a single divergence system that creates the impression of a more reliable divergence indicator. It is multi-currency based and works best on 15 minutes timeframe and above. Every time a signal is generated, it shows an alert to the user. It is more ideal if combined with other price action indicators or trading systems.
Dynamic Forex28 Navigator
Bernhard Schweigert
4.43 (7)
Dynamic Forex28 Navigator - 차세대 외환 거래 도구. 현재 49% 할인. Dynamic Forex28 Navigator는 오랫동안 인기 있는 지표의 진화형으로, 세 가지의 힘을 하나로 결합했습니다. 고급 통화 Strength28 지표(695개 리뷰) + 고급 통화 IMPULSE with ALERT(520개 리뷰) + CS28 콤보 신호(보너스). 지표에 대한 자세한 정보 https://www.mql5.com/en/blogs/post/758844 차세대 Strength 지표는 무엇을 제공합니까?  원래 지표에서 좋아했던 모든 것이 새로운 기능과 더 높은 정확도로 강화되었습니다. 주요 기능: 독점적인 통화 Strength 공식.  모든 시간대에 걸쳐 부드럽고 정확한 강도선. 추세와 정확한 진입을 식별하는 데 이상적입니다. 역동적인 시장 피보나치 수준(시장 피보나치).  이 지표에만 있는 고유한 기능. 가격 차트가 아닌 통화 강도에 피보나치가 적용됩니다.
Auto Fibo Pro m
DMITRII GRIDASOV
"Auto FIBO Pro" Crypto_Forex 지표 - 거래에 유용한 보조 도구입니다! - 지표는 자동으로 Fibo 수준과 로컬 추세선(빨간색)을 계산하여 차트에 배치합니다. - Fibonacci 수준은 가격이 반전될 수 있는 주요 영역을 나타냅니다. - 가장 중요한 수준은 23.6%, 38.2%, 50%, 61.8%입니다. - 역전 스캘핑이나 존 그리드 거래에 사용할 수 있습니다. - Auto FIBO Pro 지표를 사용하여 현재 시스템을 개선할 수 있는 기회도 많습니다. - Info Spread Swap Display가 있습니다. 현재 Spread와 Swap이 부착된 외환 쌍을 표시합니다. - 디스플레이에는 계정 잔액, 자본 및 마진도 표시됩니다. - 차트의 어느 모서리에서나 Info Spread Swap Display를 찾을 수 있습니다. 여기를 클릭하여 고품질 트레이딩 로봇과 지표를 확인하세요! 이것은 이 MQL5 웹사이트에서만 제공되는 오리지널 제품입니다.
Wolfe Wave Scanner MT4
Reza Aghajanpour
4.64 (11)
**  All Symbols  x  All Timeframes  scan just by pressing scanner button ** *** Contact me  to send you instruction and add you in "Wolfe Wave Scanner group" for sharing or seeing experiences with other users. Introduction: A Wolfe Wave is created with five-wave patterns in price. It shows supply and demand and a fight towards a balance price. T hese waves of price actions can help traders identify the boundaries of   the trend . Also  It helps forecast how the price will move in the near future
Forex Gump Trend is a universal indicator for highly effective determination of the trend direction. If you identify the trend correctly, this is 95% of trading success, because you will be able to open trades in the direction of the price movement and benefit from it. The Forex Gump Trend indicator helps traders with a high degree of efficiency to determine the current trend direction, as well as trend reversal points. The direction of the trend is shown by colored lines on the chart, and the
Trendiness Index
Libertas LLC
5 (3)
"The trend is your friend" is one of the best known sayings in investing, because capturing large trendy price movements can be extremely profitable. However, trading with the trend is often easier said than done, because many indicators are based on price reversals not trends. These aren't very effective at identifying trendy periods, or predicting whether trends will continue. We developed the Trendiness Index to help address this problem by indicating the strength and direction of price trend
MT4용 Crypto_Forex 지표 "FORCE 지수 및 2개 이동 평균". 리페인트 불필요. - 이 지표는 추세 방향의 모멘텀 트레이딩에 매우 유용합니다. - "FORCE 지수 및 2개 이동 평균" 지표를 사용하면 Force 지수의 빠르고 느린 이동 평균을 확인할 수 있습니다. - Force 지수는 가격과 거래량 데이터를 단일 값으로 결합하는 최고의 지표 중 하나입니다. - Force 지수 자체는 가격 변동에 사용된 파워의 양을 측정하는 강력한 오실레이터입니다. - 지표는 추세 변화를 매우 조기에 확인할 수 있는 기회를 제공합니다. - 이 지표는 매개변수를 통해 매우 쉽게 설정할 수 있으며, 모든 시간대에서 사용할 수 있습니다. - 그림에서 매수 및 매도 진입 조건을 확인할 수 있습니다. 여기를 클릭하여 고품질 트레이딩 로봇과 지표를 확인하세요! MQL5 웹사이트에서만 제공되는 오리지널 제품입니다.
Alpha Trend sign has been a very popular trading tool in our company for a long time. It can verify our trading system and clearly indicate trading signals, and the signals will not drift. Main functions: Based on the market display of active areas, indicators can be used to intuitively determine whether the current market trend belongs to a trend market or a volatile market. And enter the market according to the indicator arrows, with green arrows indicating buy and red arrows indicating se
Crypto_Forex 지표 HTF Ichimoku for MT4. - Ichimoku 지표는 가장 강력한 트렌드 지표 중 하나입니다. HTF는 - Higher Time Frame을 의미합니다. - 이 지표는 트렌드 트레이더와 가격 액션 항목과의 조합에 탁월합니다. - HTF Ichimoku 지표를 사용하면 더 높은 타임프레임의 Ichimoku를 현재 차트에 첨부할 수 있습니다. - 상승 추세 - 파란색 선 위에 빨간색 선(두 선 모두 클라우드 위에 있음) / 하락 추세 - 파란색 선 아래에 빨간색 선(두 선 모두 클라우드 아래에 있음). - 가격이 Ichimoku 클라우드 상단 테두리를 돌파했을 때만 BUY 주문을 엽니다. - 가격이 Ichimoku 클라우드 하단 테두리를 돌파했을 때만 SELL 주문을 엽니다. - HTF Ichimoku 지표는 큰 트렌드를 포착할 수 있는 기회를 제공합니다. 여기를 클릭하여 고품질 트레이딩 로봇과 지표를 확인하세요! 이 MQL5 웹사이트에서만
The Analytical Trend indicator can track sustained price movement in a specific direction. In this case, the movement itself can be downward, upward or sideways, when the market movement does not have a pronounced direction. The indicator works on the basis of two moving averages and an oscillator. Using the signal search algorithm, the indicator generates signals in the form of arrows. Flexible settings allow you to receive more accurate signals for opening positions. You can quickly understan
Rainbow Price Visualizer
Vincent Jose Proenca
Rainbow Price Visualizer v1.21 See where the market really breathes. Turns your MT4 chart into an ultra-precise heatmap that highlights price zones favored by big players. Why it matters 300 price levels at 0.2‑pip resolution — microscopic detail. 8 visual themes (Rainbow, Fire, Ocean…) for instant readibility. Smart opacity: low noise fades, real zones pop. Lightweight rendering with automatic cleanup. Fully customizable: saturation, opacity, resolution, history depth. Bands project into the f
VR Cub
Vladimir Pastushak
VR Cub 은 고품질 진입점을 얻는 지표입니다. 이 지표는 수학적 계산을 용이하게 하고 포지션 진입점 검색을 단순화하기 위해 개발되었습니다. 지표가 작성된 거래 전략은 수년 동안 그 효율성을 입증해 왔습니다. 거래 전략의 단순성은 초보 거래자라도 성공적으로 거래할 수 있다는 큰 장점입니다. VR Cub은 포지션 개시 지점과 이익 실현 및 손절매 목표 수준을 계산하여 효율성과 사용 편의성을 크게 높입니다. 간단한 거래 규칙을 이해하려면 아래 전략을 사용한 거래 스크린샷을 살펴보세요. 설정, 세트 파일, 데모 버전, 지침, 문제 해결 등은 다음에서 얻을 수 있습니다. [블로그] 다음에서 리뷰를 읽거나 작성할 수 있습니다. [링크] 버전 [MetaTrader 5] 진입점 계산 규칙 포지션 개설 진입점을 계산하려면 VR Cub 도구를 마지막 최고점에서 마지막 최저점까지 늘려야 합니다. 첫 번째 지점이 두 번째 지점보다 빠른 경우, 거래자는 막대가 중간선 위에서 마감될 때까지 기다립니다
ZhiBiMACD MT4
Qiuyang Zheng
4.5 (2)
This is a unique MACD indicator that is more accurate and easy to use than traditional MACD. It is suitable for any chart cycle and is suitable for any market variety. The red column is the (Buy) band signal, and the blue column is the (Sell) band signal. The yellow and green lines are trend lines, and the two lines never cross. Buy: In the blue column, look at the green line up through the middle 0 axis. Sell: In the red column, look at the yellow line down the middle 0 axis. The MACD's de
MACD Divergence
Sergey Deev
2.5 (2)
The indicator detects divergence signals - the divergences between the price peaks and the MACD oscillator values. The signals are displayed as arrows in the additional window and are maintained by the messages in a pop-up window, e-mails and push-notifications. The conditions which formed the signal are displayed by lines on the chart and in the indicator window. Indicator Parameters MacdFast - fast MACD line period MacdSlow - slow MACD line period MacdSignal - MACD signal line period MacdPric
Colored trend indicator advanced is a trend indicator that is based on Fast Moving Average and Slow Moving Average and also uses RSI and Momentum to give a trend strength in percent. It is aimed to find more healthy trends with this indicator. This indicator can be used alone as a trend indicator. Colors (Default) Green = Uptrend (Default) Red = Downtrend No color = No trend, no good trend Indicator Parameters WarnPosTrendchange: Warns you when the trend may change. FullColor: See screenshot.
RaysFX Supertrend Bar RaysFX Supertrend Bar è un indicatore personalizzato per MetaTrader 4. Utilizza l'indice di canale delle materie prime (CCI) per generare segnali di trading. L'indicatore mostra dei puntini in una finestra separata sotto il grafico principale per indicare i segnali di trading. Caratteristiche principali: Calcola il CCI per diversi periodi temporali. Visualizza puntini per indicare i segnali di trading. Permette all'utente di modificare i periodi temporali e la distanza tra
The Expert Advisor tool has been developed for XAUUSD (GOLD), based on SUPPORT/RESISTANCE level . All trading positions contain a DYNAMIC TAKE-PROFIT and DYNAMIC STOP_LOSS. .  The signal: https://www.mql5.com/en/signals/997939?source=Site+Signals+My There is no need to set up parameters - all settings are already optimized and fine-tuned. Features Each deal is protected by Dynamic Take-profit and Dynamic Stop-loss. A fixed lot are used. No martingale, no grid. All settings optimized. Long-term
SMC OrderBlocks AIO MT4
Catur Cipto Nugroho
Order Blocks All-in-One — SMC Indicator for MT4 For MT5 version :  https://www.mql5.com/en/market/product/166409 The only Order Block indicator you'll ever need. Track the complete lifecycle of every Order Block — from formation to mitigation to breakout — all in one single, powerful indicator. Built on Smart Money Concepts (SMC) originally introduced by the ICT community , this tool brings institutional-level market structure analysis dire
PABT Pattern Indicator - it's classical system one of the signal patterns. Indicator logic - the Hi & Lo of the bar is fully within the range of the preceding bar, look to trade them as pullback in trend. In the way if indicator found PABT pattern it's drawing two lines and arrow what showing trend way.  - First line - it's entry point and drawing at: 1. On the high of signal bar or on middle of the signal bar (depending from indicator mode) for buy; 2. On the low of signal bar or on middle of t
Trend PA
Mikhail Nazarenko
5 (3)
The Trend PA indicator uses   Price Action   and its own filtering algorithm to determine the trend. This approach helps to accurately determine entry points and the current trend on any timeframe. The indicator uses its own algorithm for analyzing price changes and Price Action. Which gives you the advantage of recognizing, without delay, a new nascent trend with fewer false positives. Trend filtering conditions can be selected in the settings individually for your trading style. The indicator
Indicador Taurus All4
Fabio Oliveira Magalhaes
Taurus All4 Taurus All4 is a high-performance indicator, it will tell you the strength of the trend, and you will be able to observe the strength of the candle. Our indicator has more than 4 trend confirmations. It is very simple and easy to use. Confirmation Modes Candle Trend Confirmations: When the candle switches to light green the trend is high. When the candle switches to light red the trend is reverting down. When the candle changes to dark red the trend is low. Trendline Trend Confirm
Reback
Yazhou Liu
This index can be traced back to historical transactions, and can clearly see the trading location, trading type, profit and loss situation, as well as statistical information. Showlabel is used to display statistics. Summy_from is the start time of order statistics. This parameter is based on the opening time of the order. Backtracking can help us to correct the wrong trading habits, which is very important for beginners to learn manual transactions. This index is suitable for each time per
TradeHistoryMapper EA
Dora Nafwa Mwabini
TradeHistoryMapper로 트레이딩 우위를 시각화하세요 모든 성공적인 트레이더는 자신의 트레이딩 기록이 미래 수익의 열쇠라는 것을 알고 있습니다. TradeHistoryMapper는 계좌 기록을 강력한 시각적 지도로 만들어 수익과 손실, 그리고 개선 방법을 정확하게 보여줍니다. 모든 거래를 차트에서 직접 확인할 수 있는데, 끝없는 계좌 기록 탭을 헤매실 필요가 있을까요? 1. 명확한 색상 코드로 수익과 손실 거래를 즉시 표시합니다. 2. 여러 종목과 시간대에 걸친 성과를 분석합니다. 3. 청산된 거래와 현재 진행 중인 거래를 모두 추적하여 완벽한 통찰력을 제공합니다. 4. 진입 및 청산 패턴을 한눈에 파악합니다. 5. 간단한 설정 - 기록 첨부, 실행, 그리고 실시간으로 기록 확인 자신의 투자 습관을 이해하려는 초보자든, 심층 분석을 원하는 고급 트레이더든 TradeHistoryMapper는 무엇이 효과적이고 무엇이 효과적이지 않은지 파악하여 자신 있게 전략을 개선
DivirgentMAX
Mikhail Bilan
Indicator without redrawing Divergent MAX The DivirgentMAX indicator is a modification based on the MACD. The tool detects divergence based on OsMA and sends signals to buy or sell (buy|sell), taking into account the type of discrepancies detected. Important!!!! In the DivirgentMAX indicator, the optimal entry points are drawn using arrows in the indicator's basement. Divergence is also displayed graphically. In this modification of the MACD, the lag problem characteristic of its predecessor i
This indicator is another variant of the famous powerful indicator Fibonacci-SS https://www.mql5.com/en/market/product/10136 but has different behaviour in placing Pending Order and TP Line. Automatically places Fibonacci retracement lines from the last highest and lowest visible bars on the chart with: An auto Pending Order (Buy/Sell). Taking Profit 1, Taking Profit 2 is pivot point and Taking Profit 3 for extended reward opportunity. The best risk and reward ratio. Simple and powerful indicat
Ichimoku Trade Alarm
Miroslaw Stachowiak
The most effective signals generated by Ichimoku strategies. Ichimoku Trade Alarm is a supplement for Ichimoku Trade Panel and it shows the signals that Expert Advisor reacts to. Visualization of signals:  Price / Kijun sen cross - the candle body must be between Min_Candlestick_Body and Max_Candlestick_Body. The candle must close above / below Kijun sen, minimum in 1/3 of its body. Open candle must be located above / below Kijun sen. Chinkou span must be under the price of 26 periods in advanc
Fractal Zig Zag
Mikhail Nazarenko
A   professional version of the ZigZag indicator for visualizing the structure of price movements by fractals. Fractal ZigZag fixes the flaws of the standard version of the ZigZag indicator MT4. It uses Price action and a unique filtering algorithm to determine fractals. Suitable for all types of trading. Ideal for trading according to the WM pattern "Sniper" strategy !!! Features Marks the place of price reversal during the formation of a new fractal with specified parameters. Suitable for al
Crosskalp1
Mikhail Bilan
Добрый День уважаемые трейдеры!  Вашему вниманию индикатор созданный и работающий на базе трендовика ADX,  для торговли на смене направления движения который учитывает коррекцию и даёт возможность на ней заработать.  Применяю этот индикатор для скальпинга. Рекомендую таймфреймы от 15 ти минутного(М15) до часового (Н1) периодов.  Красный кружок сигнал на продажу- Sell) Зелёный кружок  сигнал на покупку Buy) Чем меньше ваш таймфрейм тем меньше пунктов вы зарабатываете.   Важно выставлять стопы! !В
Trend Oscillator mw
DMITRII GRIDASOV
Trend Oscillator - 고급 맞춤형 Crypto_Forex 지표, 효율적인 거래 도구입니다! .......................................................................................... - 고급 새로운 계산 방법 사용 - 매개변수 "계산 가격"에 대한 20가지 옵션. - 지금까지 개발된 가장 매끄러운 오실레이터. - 상승 추세는 녹색, 하락 추세는 빨간색. - 과매도 값: 5 미만, 과매도 값: 95 이상. - 이 지표로 표준 전략도 업그레이드할 수 있는 기회가 많습니다. - PC 및 모바일 알림. .................................................................... 여기를 클릭하여 고품질 트레이딩 로봇과 지표를 확인하세요! 이 MQL5 웹사이트에서만 제공되는 오리지널 제품입니다.
REX complete 3in1
Christophe Godart
This is the complete REX package. It consists of the lite, pro and ULTRA version.  Perfect for beginners and intermediates. REX complete is 100% non repaint. The strategy is based on a mix of different strategies, statistics, including pivot points, oscillators and patterns.  As the trading idea consists of a variety of some classic indicators like Momentum, Williams Percent Range, CCI, Force Index, WPR, DeMarker, CCI, RSI and Stochastic, it is clear that the fundamental indicators have being u
이 제품의 구매자들이 또한 구매함
Neuro Poseidon MT4
Daria Rezueva
4.94 (31)
Neuro Poseidon is a new indicator by Daria Rezueva. It combines precise trading signals with adaptive TP/SL levels - creating best possible trades as a result! Message me and get  Neuro Poseidon Assistant  as a gift to automize your trading process! What makes it stand out? 1. Proven profitability on all assets and timeframes 2. Only confirmed BUY and SELL signals present on the chart 3. Adaptive TP & SL levels generated by the software for each trade 4. Easy to understand - suitable for all
Gann Made Easy
Oleg Rodin
4.84 (164)
Gann Made Easy 는 mr.의 이론을 사용하여 최고의 거래 원칙을 기반으로 하는 전문적이고 사용하기 쉬운 Forex 거래 시스템입니다. W.D. 간. 이 표시기는 Stop Loss 및 Take Profit Levels를 포함하여 정확한 BUY 및 SELL 신호를 제공합니다. PUSH 알림을 사용하여 이동 중에도 거래할 수 있습니다. 구매 후 거래 방법 안내 및 유용한 추가 지표를 무료로 받으시려면 저에게 연락주세요! 아마도 Gann 거래 방법에 대해 이미 여러 번 들었을 것입니다. 일반적으로 Gann의 이론은 초보자 거래자뿐만 아니라 이미 거래 경험이 있는 사람들에게도 매우 복잡한 것입니다. Gann의 거래 방식은 이론적으로 적용하기 쉽지 않기 때문입니다. 나는 그 지식을 연마하고 Forex 지표에 최고의 원칙을 적용하기 위해 몇 년을 보냈습니다. 표시기는 적용하기가 매우 쉽습니다. 차트에 첨부하고 간단한 거래 권장 사항을 따르기만 하면 됩니다. 지표는 지속적으로 시장 분석
M1 Sniper
Oleg Rodin
5 (23)
M1 SNIPER 는 사용하기 쉬운 거래 지표 시스템입니다. M1 시간대에 맞춰 설계된 화살표 지표입니다. 이 지표는 M1 시간대 스캘핑을 위한 단독 시스템으로 사용할 수 있으며, 기존 거래 시스템의 일부로도 사용할 수 있습니다. 이 거래 시스템은 M1 시간대 거래용으로 특별히 설계되었지만, 다른 시간대에도 사용할 수 있습니다. 원래는 XAUUSD와 BTCUSD 거래를 위해 이 방법을 설계했지만, 다른 시장 거래에도 유용하다는 것을 알게 되었습니다. 이 지표의 신호는 추세 방향과 반대로 거래될 수 있습니다. 저는 지표의 신호를 활용하여 양방향으로 거래할 수 있도록 돕는 특별한 거래 기법을 알려드립니다. 이 방법은 특별한 동적 지지선과 저항선 가격 영역을 활용하는 것을 기반으로 합니다. 구매하시면 M1 SNIPER 화살표 지표를 바로 다운로드하실 수 있습니다. 또한, 아래 스크린샷에 표시된 Apollo Dynamic SR 지표는 M1 SNIPER 도구를 사용하는 모든 사용자에게 무료로
Scalper Inside PRO
Alexey Minkov
4.74 (68)
Scalper Inside PRO Scalper Inside PRO is an intraday trend and scalping indicator for MetaTrader 4 that uses an exclusive algorithm to quickly detect market direction and key target levels. It automatically calculates entry, exit and multiple profit targets, and shows detailed performance statistics so you can see how different instruments and strategies performed. This helps you choose the most suitable trading instruments for the current market conditions. Additionally, you can easily integrat
Enigmera
Ivan Stefanov
5 (8)
ENIGMERA: 시장의 핵심 중요: MQL5.com의 데모는 Strategy Tester에서 실행되며 Enigmera의 기능을 완전히 반영하지 못할 수 있습니다. 설명, 스크린샷 및 비디오를 확인하여 자세한 내용을 확인하십시오. 질문이 있으면 언제든지 메시지를 보내주세요! 인디케이터의 코드는 완전히 다시 작성되었습니다. 버전 3.0은 새로운 기능을 추가하고 인디케이터가 처음 출시된 이후 누적된 버그를 수정했습니다. 소개 이 인디케이터 및 거래 시스템은 금융 시장에 대한 주목할 만한 접근 방식입니다. ENIGMERA는 프랙탈 주기를 사용하여 정확하게 지원 및 저항 수준을 계산합니다. 실제 축적 단계를 보여주고 방향과 목표를 제공합니다. 트렌드와 수정 모두에서 작동하는 시스템입니다. 작동 방식 인디케이터의 대부분의 기능은 차트 왼쪽에 있는 버튼을 통해 제어되며, 이를 통해 다양한 시장 상황에 빠르게 대응할 수 있습니다. 버튼 ON/OFF – 인디케이터 전체를 표시하거나 숨깁니다.
KT Alpha Hunter Arrows MT4
KEENBASE SOFTWARE SOLUTIONS
대부분의 화살표 지표는 신호만 보여주고, 나머지 판단은 모두 트레이더에게 맡깁니다. KT Alpha Hunter Arrows는 완성된 트레이딩 플랜을 함께 제공합니다. 각 신호 화살표가 표시될 때마다 차트에는 진입 라인, 손절선, 네 개의 익절 목표, 그리고 현재 종목과 시간대가 지금 거래할 만한 가치가 있는지 알려주는 실시간 엣지 판정이 함께 그려집니다. 포함된 Trade Manager EA는 사용자가 수동으로 진입한 이후의 실행 관리를 맡아, 시장이 흔들리고 감정이 개입되기 쉬운 순간에도 거래 원칙을 유지할 수 있도록 돕습니다. 리페인트 없음. 확정된 캔들 기준 신호만 표시. Forex, 골드, 지수, 그리고 사용자가 거래하는 모든 상품을 위해 설계되었습니다. 주요 기능 캔들이 마감된 후에만 표시되는 비리페인트 매수 및 매도 화살표. 각 신호마다 진입 라인, 구조적 손절선, 네 개의 익절 목표 제공. Edge Dashboard가 현재 차트의 매수와 매도 셋업을 별도로 평가. 판
Neo Wave PRO
Nikolay Raykov
5 (1)
Price & Time Market Structure Indicator A professional market structure tool that analyzes waves through both price and time — not price alone. Main Description NeoWave PRO is a professional market structure indicator for MetaTrader 4 designed for traders who want to move beyond traditional one-dimensional wave tools such as ZigZag, swing indicators, and basic high/low systems. Most wave indicators analyze only one thing: Price. But a real market wave is not only a price movement. A true wave de
PRO Renko System
Oleg Rodin
5 (30)
PRO Renko System 은 RENKO 차트 거래를 위해 특별히 고안된 매우 정확한 거래 시스템입니다. 이것은 다양한 거래 상품에 적용될 수있는 보편적 인 시스템입니다. 체계는 효과적으로 당신에게 정확한 반전 신호에 접근을 주는 소위 시장 소음을 중화합니다. 이 표시기는 사용하기가 매우 쉽고 신호 생성을 담당하는 매개 변수가 하나만 있습니다. 당신은 쉽게 당신의 선택의 어떤 무역 계기에 공구를 적응시킬 수 있고 renko 막대기의 크기. 나는 항상 당신이 내 소프트웨어로 수익성있게 거래 할 수 있도록 추가 지원을 제공 할 준비가되어 있습니다! 나는 당신에게 행복하고 수익성있는 거래를 기원합니다! 구매 후 저에게 연락하십시오! 내 렌코 차트 생성기를 보내드립니다. 또한 내 개인 권장 사항 및 시스템의 다른 모듈을 무료로 공유 할 것입니다!
Trend Lines PRO
Roman Podpora
5 (1)
트렌드 라인즈 프로       이 지표는 시장이 실제로 어떤 방향으로 전환되는지 파악하는 데 도움이 됩니다. 실제 추세 반전 지점과 주요 시장 참여자들이 다시 진입하는 지점을 보여줍니다. 보시다시피       BOS 라인       복잡한 설정이나 불필요한 노이즈 없이 더 높은 시간대의 추세 변화와 주요 레벨을 확인할 수 있습니다. 신호는 차트에 다시 그려지지 않고 캔들이 마감된 후에도 계속 표시됩니다. VERSION MT 5   -   RFI LEVELS PRO   표시기   와 결합할 때 최대 잠재력을 발휘합니다. 지표가 보여주는 내용: 실제 변화       추세(BOS 라인) 한 번 신호가 나타나면 그 신호는 계속 유효합니다! 이는 신호를 발생시킨 후 변경될 수 있는 리페인팅 방식의 지표와 중요한 차이점입니다. 리페인팅 방식의 지표는 잠재적으로 자금 손실로 이어질 수 있습니다. 이제 더욱 높은 확률과 정확도로 시장에 진입할 수 있습니다. 또한 화살표가 나타난 후 목표가(익절)
Trend Catcher ind
Ramil Minniakhmetov
5 (2)
트렌드 캐처 인디케이터 트렌드 캐처 인디케이터는 개발자가 자체 개발한 맞춤형 적응형 트렌드 분석 지표들을 조합하여 시장 가격 움직임을 분석합니다. 단기적인 노이즈를 제거하고 근본적인 모멘텀 강도, 변동성 확대, 가격 구조 움직임에 집중하여 진정한 시장 방향을 파악합니다. 또한 이동 평균, RSI, 변동성 필터와 같은 맞춤형 지표들을 활용하여 가격을 평활화하고 트렌드를 필터링합니다. 실제 운영 모니터링 및 기타 제품은 다음 링크에서 확인하실 수 있습니다: https://www.mql5.com/en/users/mechanic/seller 텔레그램에서는 EA나 설정 파일을 판매하지 않습니다. 사기이니 주의하세요. 모든 설정 파일은 블로그에서 무료로 제공됩니다. 중요! 구매 후 즉시 연락 주시면 사용 방법 및 보너스를 드립니다!
Genesis Matrix Pro is a professional multi-timeframe trend detection indicator designed to help traders identify high-quality market alignment with clarity and structure. It combines 12 different technical indicators into one visual alignment matrix, allowing traders to quickly see when market conditions are bullish, bearish, or neutral. A signal is generated only when the selected strategies are aligned, helping reduce noise and improve decision-making. PLEASE CONTACT ME AFTER PURCHASE TO GET
Current event:  https://c.mql5.com/1/326/A2SR2025_NoMusic.gif A. A2SR이란 무엇입니까 ?   * 선행 기술 지표입니다(재도장 없음, 지연 없음). -- 안내 : https://www.mql5.com/en/blogs/post/734748/page4#comment_16532516 -- 및 https://www.mql5.com/en/users/yohana/blog A2SR에는 지원(수요) 및 저항(공급) 수준을 결정하는 특별한 기술이 있습니다. 우리가 인터넷에서 본 일반적인 방식과 달리 A2SR은 실제 SR 수준을 결정하는 독창적인 개념을 가지고 있습니다. 원래 기술은 인터넷에서 가져온 것이 아니며 인터넷에 게시된 적도 없습니다. A2SR은 거래 스타일에 따라 SR 수준을 자동으로 선택합니다. 시간 프레임을 변경해도 SR 레벨은 그대로 유지됩니다. 사용하는 시간 프레임에서 실제 SR을 얻지 못하기 때문입니다. A2SR은 거래를
PZ Trend Trading
PZ TRADING SLU
4.8 (5)
Capture every opportunity: your go-to indicator for profitable trend trading Trend Trading is an indicator designed to profit as much as possible from trends taking place in the market, by timing pullbacks and breakouts. It finds trading opportunities by analyzing what the price is doing during established trends. [ Installation Guide | Update Guide | Troubleshooting | FAQ | All Products ] Trade financial markets with confidence and efficiency Profit from established trends without getting whips
Step into the world of Forex trading with confidence, clarity, and precision using   Gold Indicator   a next-generation tool engineered to take your trading performance to the next level. Whether you’re a seasoned professional or just beginning your journey in the currency markets, Gold Indicator equips you with powerful insights and help you trade smarter, not harder. Built on the proven synergy of three advanced indicators, Gold Indicator focuses exclusively on medium and long-term trends eli
이 제품은 2026년 시장에 맞게 업데이트되었으며 최신 MT5 빌드에 최적화되었습니다. 가격 업데이트 안내: Smart Trend Trading System은 현재 $99 에 제공됩니다. 다음 30회 구매 후 가격은 $199 로 인상됩니다. 특별 혜택: Smart Trend Trading System 구매 후 저에게 개인 메시지를 보내시면 Smart Universal EA를 무료 로 받을 수 있으며, Smart Trend 신호를 자동 거래로 전환할 수 있습니다. Smart Trend Trading System은 리페인트 없음, 재그리기 없음, 지연 없음의 완전한 트레이딩 시스템으로, 더 깨끗한 신호, 더 나은 추세 방향, 그리고 더 체계적인 시장 거래 방식을 원하는 트레이더를 위해 제작되었습니다. Online course , manual and download presets . 이 시스템은 추세 감지, 반전 구간, Smart Cloud, 트레일링 스톱 로직, 지지와 저항, 캔들 색
Scalper Vault
Oleg Rodin
5 (37)
Scalper Vault 는 성공적인 스캘핑에 필요한 모든 것을 제공하는 전문 스캘핑 시스템입니다. 이 표시기는 외환 및 바이너리 옵션 거래자가 사용할 수 있는 완전한 거래 시스템입니다. 권장 시간 프레임은 M5입니다. 시스템은 추세 방향으로 정확한 화살표 신호를 제공합니다. 또한 상단 및 하단 신호와 Gann 시장 수준을 제공합니다.  이 시스템은 사용하기가 매우 쉽습니다. 원하는 시장 지역의 화살표만 따라가면 됩니다. 엑시트는 가격이 적정 수준에 도달하거나 시장의 고점 또는 저점 신호가 나타날 때 수행됩니다.  표시기는 PUSH 알림을 포함한 모든 유형의 경고를 제공합니다. 인디케이터 구매 후 연락주세요. 내 개인 거래 권장 사항과 훌륭한 보너스 지표를 무료로 공유합니다! 나는 당신에게 행복하고 유익한 거래를 기원합니다!
PZ Swing Trading
PZ TRADING SLU
5 (3)
Protect against whipsaws: revolutionize your swing trading approach Swing Trading is the first indicator designed to detect swings in the direction of the trend and possible reversal swings. It uses the baseline swing trading approach, widely described in trading literature. The indicator studies several price and time vectors to track the aggregate trend direction and detects situations in which the market is oversold or overbought and ready to correct. [ Installation Guide | Update Guide | Tro
BTMM State Engine Pro MT4
Garry James Goodchild
BTMM State Engine Pro is a MetaTrader 4 indicator for traders who use the Beat The Market Maker approach: Asian session context, kill zone timing, level progression, peak formation detection, and a multi-pair scanner from a single chart. It combines cycle state logic with a built-in scanner dashboard so you do not need the same tool on many charts at once. What it does Draws the Asian session range; session times can follow broker server offset or be set in inputs. Tracks level progression (L
Dynamic Scalper System
Vitalyi Belyh
5 (1)
" Dynamic Scalper System " 지표는 추세 파동 내에서 스캘핑 방식으로 거래하도록 설계되었습니다. 주요 통화쌍 및 금에서 테스트되었으며, 다른 거래 상품과의 호환성이 가능합니다. 추가적인 가격 변동 지원을 통해 추세에 따라 단기 포지션 진입 신호를 제공합니다. 지표의 원리 큰 화살표는 추세 방향을 결정합니다. 작은 화살표 형태의 스캘핑 신호를 생성하는 알고리즘은 추세 파동 내에서 작동합니다. 빨간색 화살표는 상승 방향을, 파란색 화살표는 하락 방향을 나타냅니다. 민감한 가격 변동선은 추세 방향으로 그려지며, 작은 화살표의 신호와 함께 작용합니다. 신호는 다음과 같이 작동합니다. 적절한 시점에 선이 나타나면 진입 신호가 형성되고, 선이 있는 동안 미결제 포지션을 유지하며, 완료되면 거래를 종료합니다. 권장되는 작업 시간대는 M1~H4입니다. 화살표는 현재 캔들에 형성되며, 다음 캔들이 이미 시작되었더라도 이전 캔들의 화살표는 다시 그려지지 않습니다. 입력 매개
MonsterDash Harmonic Indicator
Paul Geirnaerdt
4.54 (26)
MonsterDash Harmonic Indicator is a harmonic pattern dashboard. It recognizes all major patterns. MonsterDash is a dashboard that displays all detected patterns for all symbols and (almost) all timeframes in sortable and scrollable format. Users can add their own user defined patterns . MonsterDash can open and update charts with the pattern found. Settings MonsterDash's default settings are good enough most of the time. Feel free to fine tune them to your needs. The color settings are for thos
Apollo SR Master
Oleg Rodin
5 (2)
Apollo SR Master는 지지/저항 구간에서의 거래를 더욱 쉽고 안정적으로 만들어 주는 특수 기능을 갖춘 지지/저항 지표입니다. 이 지표는 지역 가격의 고점과 저점을 감지하여 시간 지연 없이 실시간으로 지지/저항 구간을 계산합니다. 새롭게 형성된 저항 구간을 확인하기 위해 지표는 해당 저항 구간을 실제 매도 또는 매수 신호로 활용할 수 있음을 나타내는 특수 신호를 표시합니다. 이 경우, 저항 구간의 강도가 높아지고, 따라서 저항 구간에서의 성공적인 거래 가능성도 높아집니다. 이것이 바로 이 지표의 핵심 아이디어입니다. SR 존은 손절매와 이익실현을 더욱 쉽게 할 수 있도록 해줍니다. 신호 방향에 따라 SR 존 위 또는 아래 공간을 손절매로 활용할 수 있습니다. 또한, 반대쪽 SR 존은 잠재적 이익실현 영역으로 활용할 수 있습니다. 또한 Apollo SR Master 지표를 사용하는 모든 사용자에게 "Apollo Price Action System" 지표를 무료로 제공합니다.
지진계 Marketquake Detector. Description in English : https://www.mql5.com/en/market/product/113869?source=Site+Market+Product+Page#description How to use the Seismograph : https://www.mql5.com/en/market/product/113869#!tab=comments&page=2&comment=52806941 Create an EA : https://www.mql5.com/en/market/product/113869#!tab=comments&page=3&comment=52816509 어떤 방식으로 거래하든 유동성이 낮은 시장에 진입하는 것을 피하고 싶을 것입니다.- 지진계는 시장 랠리 전에 시장에 진입할 수 있는 적절한 시기를 도와줄 것입니다. 그러나 바쁠 시장 시간에 진입을 확인했음에도 불구하고 많은 사람들이 유동성이 부족한 시
Advanced Currency Strength28 Indicator
Bernhard Schweigert
4.91 (657)
현재 40% 할인 초보자 또는 전문가 트레이더를 위한 최고의 솔루션! 이 지표는 우리가 독점 기능과 새로운 공식을 통합했기 때문에 독특하고 고품질이며 저렴한 거래 도구입니다. 단 하나의 차트로 28 Forex 쌍의 통화 강도를 읽을 수 있습니다! 새로운 추세 또는 스캘핑 기회의 정확한 트리거 포인트를 정확히 찾아낼 수 있기 때문에 거래가 어떻게 개선될지 상상해 보십시오. 사용 설명서: 여기를 클릭  https://www.mql5.com/en/blogs/post/697384 그것이 첫 번째, 원본입니다! 쓸모없는 지망생 클론을 사지 마십시오. 더 스페셜  강력한 통화 모멘텀을 보여주는 하위 창의 화살표 GAP가 거래를 안내합니다! 기본 또는 호가 통화가 과매도/과매도 영역(외부 시장 피보나치 수준)에 있을 때 개별 차트의 기본 창에 경고 표시가 나타납니다. 통화 강도가 외부 범위에서 떨어질 때 풀백/반전 경고. 교차 패턴의 특별 경고 추세를 빠르게 볼 수 있는 다중 시간
Auto Optimized Parabolic RSI: 고급 3D 모멘텀 엔진 대부분의 개인 투자자용 보조지표는 시장의 변동성이 변하는 순간 무용지물이 되는 정적인 입력값에 의존하기 때문에 실패합니다. Auto Optimized Parabolic RSI는 자체적인 수학적 우위를 지속적으로 재계산하여 "보조지표 노후화" 문제를 해결하며, 기관급 퀀트 트레이딩의 적응력을 귀하의 MT5 터미널에 직접 제공합니다. 핵심 이점: 맞춤형 인메모리 3D 최적화   표준 자동 최적화 도구들은 일반적인 보조지표 호출로 터미널에 과부하를 일으켜 MT5 플랫폼을 멈추게 하는 경우가 많습니다. 이 도구는 이러한 병목 현상을 완전히 우회합니다. 맞춤형 네이티브 RAM 기반 계산기로 구축된 내부 엔진은 차트를 로드하거나 타임프레임을 변경할 때마다 빛처럼 빠른 3D 그리드 검색을 실행합니다. RSI 기간(주기), SAR 스텝(가속도) 및 SAR 최대치(속도 제한)를 동시에 스캔하여 플랫폼 지연 없이 수만 개의
Advanced Supply Demand
Bernhard Schweigert
4.91 (300)
현재 40% 할인! 초보자나 전문 트레이더를 위한 최고의 솔루션! 이 보조지표는 우리가 다수의 독창적 기능과 새로운 공식을 통합한 독특하고 고품질이며 저렴한 거래 도구입니다. 이 업데이트를 통해 이중 시간대를 표시할 수 있습니다. 더 높은 TF를 표시할 수 있을 뿐만 아니라 차트 TF와 더 높은 TF 모두를 표시할 수 있습니다: 중첩 영역 표시. 모든 Supply Demand 트레이더들이 좋아할 것입니다. :) 중요한 정보 공개 Advanced Supply Demand의 잠재력을 극대화하려면 다음을 방문하십시오. https://www.mql5.com/ko/blogs/post/720245   진입 또는 목표의 명확한 트리거 포인트를 정확히 찾아냄으로 해서 거래가 어떻게 개선될지 상상해 보십시오. 새로운 알고리즘을 기반으로 매수자와 매도자 간의 잠재적인 불균형을 훨씬 더 쉽게 분간할 수 있습니다. 왜냐하면 가장 강한 공급영역과 가장 강한 수요 영역과 과거에 어떻게 진행 되었는지를(이전
이 인디케이터는 엘리어트 파동 이론과 두 가지 방식으로 작동합니다: 자동 작동: 이 모드에서는 인디케이터가 엘리어트 파동 이론에 따라 차트 상의 모든 5개의 모티브 웨이브를 자동으로 감지하고 예측 및 잠재적인 반전 지역을 제공합니다. 또한 중요한 개발 사항을 트레이더에게 알릴 수 있는 경보 및 푸시 메시지를 생성할 수 있는 능력을 갖추고 있습니다. 이 자동 기능은 엘리어트 파동 패턴의 식별과 분석 프로세스를 간소화합니다. 수동 작동: 이 옵션은 엘리어트 파동 이론을 수동으로 다루고 싶은 트레이더를 위해 설계되었습니다. 이를 통해 사용자는 아홉 가지 다른 등급을 사용하여 웨이브를 그릴 수 있습니다. 각 등급은 나타난 후에 차트에 그려진 라인을 조정하여 개별적으로 정의할 수 있습니다. 이 기능은 웨이브를 수동으로 그리는 프로세스를 간소화하며 더 효율적으로 만들어 줍니다. 중요한 점으로 모든 그림 데이터가 미래 참조를 위해 플랫폼 데이터 폴더에 저장된다는 것을 기억해야 합니다. 파라미터:
Introduction to Fractal Pattern Scanner Fractal Indicator refers to the technical indicator that makes use of the fractal geometry found in the financial market. Fractal Pattern Scanner is the advanced Fractal Indicator that brings the latest trading technology after the extensive research and development work in the fractal geometry in the financial market. The most important feature in Fractal Pattern Scanner is the ability to measure the turning point probability as well as the trend probabi
Bull versus Bear
Mohamed Hassan
4.5 (18)
Send us a message after your purchase to receive more information on how to get your  BONUS  for FREE  that works in great combination with Bull vs Bear ! Bull versus Bear is an easy-to-use Forex indicator that gives traders clear and accurate signals based on clear trend retests . Forget about lagging indicators or staring at charts for hours because  Bull vs Bear provides real-time entries with no lag and no repaint, so you can trade with confidence. Bull vs Bear  helps you enter trades during
The Propfolio Master Suite is the ultimate all-in-one analytical workstation for professional traders. Combining the power of the Beat The Market Maker (BTMM) methodology, Smart Money Concepts (SND/Liquidity), and Advanced Volume Profile, this suite replaces multiple different indicators with one optimized engine. Monitor up to 14 pairs simultaneously from a single chart, instantly identify market cycles, and seamlessly map institutional footprints with the click of a button. The Command Center
Harmonic Pattern Plus MT4
Young Ho Seo
4.44 (18)
Introduction Harmonic Patterns are best used to predict potential turning point. Traditionally, Harmonic Pattern was identified manually connecting peaks and troughs points in the chart. Manual harmonic pattern detection is painfully tedious and not suitable for everyone. You are often exposed under subjective pattern identification with manual pattern detection. To avoid these limitations, Harmonic Pattern Plus was designed to automate your harmonic pattern detection process. The functionality
제작자의 제품 더 보기
TSO Stochastic RSI MT5
Dionisis Nikolopoulos
4.5 (2)
Stochastic RSI makes a stochastic calculation on the RSI indicator. The Relative Strength Index (RSI) is a well known momentum oscillator that measures the speed and change of price movements, developed by J. Welles Wilder. Features Find overbought and oversold situations. Sound alert when overbought/oversold level is reached. Get email and/or push notification alerts when a signal is detected. The indicator is non-repainting. Returns buffer values for %K and %D to be used as part of an EA. (se
FREE
TSO Moving Average Slope MT5
Dionisis Nikolopoulos
5 (3)
The Moving Average Slope (MAS) subtracts the moving average level n-periods ago from the current moving average level. This way, the trend of the moving average can be drawn on the moving average line. Features Observe uptrends and downtrends at a glance. The indicator is non-repainting. Returns buffer values for the trend of the moving average to be used as part of an EA. (see below) Inputs Moving Average Period : The period of the moving average (MA). Slope Period : Number of periods between
FREE
Variable Index Dynamic Average (VIDYA) is an original method of calculating the Exponential Moving Average (EMA) with the dynamically changing period of averaging, developed by Tushar Chande. The length of period in VIDYA depends on market volatility as indicated by the Chande Momentum Oscillator (CMO). Typical Signals VIDYA generates buy and sell signals when the price crosses over and under the bands: When the price crosses over the upper band of VIDYA, this can be interpreted as a signal to
FREE
TSO Moving Average Slope
Dionisis Nikolopoulos
3.67 (3)
The Moving Average Slope (MAS) subtracts the moving average level n-periods ago from the current moving average level. This way, the trend of the moving average can be drawn on the moving average line. Features Observe uptrends and downtrends at a glance. The indicator is non-repainting. Returns buffer values for the trend of the moving average to be used as part of an EA. (see below) Inputs Moving Average Period : The period of the moving average (MA). Slope Period : Number of periods between
FREE
TSO Stochastic RSI
Dionisis Nikolopoulos
4.25 (4)
Stochastic RSI makes a stochastic calculation on the RSI indicator. The Relative Strength Index (RSI) is a well known momentum oscillator that measures the speed and change of price movements, developed by J. Welles Wilder. Features Find overbought and oversold situations. Sound alert when overbought/oversold level is reached. Get email and/or push notification alerts when a signal is detected. The indicator is non-repainting. Returns buffer values for %K and %D to be used as part of an EA . (s
FREE
TSO Choppy Market Index
Dionisis Nikolopoulos
4.67 (3)
The Choppy Market Index (CMI) is an indicator of market volatility. The smaller the value of the indicator, the more unstable the market. It calculates the difference between the closing of the last bar and a bar n periods ago and then divides that value by the difference between the highest high and lowest low of these bars. Features Easily separate trends from the market noise The indicator is non-repainting. Returns CMI values through buffer. (see below) Inputs Period: The number of periods
FREE
The Adaptive Moving Average (AMA), created by Perry Kaufman, is a moving average variation designed to have low sensitivity to market noise and volatility combined with minimal lag for trend detection. These characteristics make it ideal for identifying the overall market trend, time turning points and filtering price movements. A detailed analysis of the calculations to determine the AMA can be found in MetaTrader 5 Help ( https://www.metatrader5.com/en/terminal/help/indicators/trend_indicators
FREE
TSO Signal Builder
Dionisis Nikolopoulos
5 (1)
TSO Signal Builder is a MetaTrader 4 Expert Advisor that provides a solid platform to quickly build test and develop automated trading strategies based on indicator signals. Contains 29 indicators, including trend and volume indicators, oscillators as well as many indicators described by Bill Williams. Basic as well as advanced order management features. All indicators are configurable and can be combined to create strategies with different entry and exit signals as well as reverse orders. Made
TSO Loss Management Lite
Dionisis Nikolopoulos
TSO Loss Management Lite contains all the features of TSO Loss Management except from the Swings mechanism and the other mechanisms based on Swings. Adapts to diverse market conditions and micromanages each trade opened so that the loses are covered as fast as possible but also with minimum risk. It uses all the tools of the TSO Signal Builder EA - almost infinite entry/exit strategies. Add negative management to any strategy (manual or automated) to eliminate losing trades. No pending orders ar
TSO Loss Management
Dionisis Nikolopoulos
TSO Loss Management is an Expert Advisor that incorporates advanced mechanics to eliminate losses from losing trades. Adapts to diverse market conditions and micromanages each position to cover losses as fast as possible and with minimum risk. It uses all the tools of the TSO Signal Builder EA - almost infinite entry/exit strategies. Add negative management to any strategy (manual or automated) to eliminate losing trades. No pending orders placed. Any account size - $1,000+ is recommended. Allow
TSO Order Recovery
Dionisis Nikolopoulos
TSO Order Recovery is an expert advisor that provides a known and tested method of covering losses from open positions through hedging. It uses all the tools of the TSO Signal Builder EA - almost infinite entry/exit strategies Add negative management to any strategy (manual or automated) to eliminate losing trades No pending orders are placed Any account size - a minimum of $1,000 is recommended Works on any currency pair Allows for a lot of customization (a default strategy is included for demo
TSO Total Negative Management
Dionisis Nikolopoulos
1 (1)
The TSO Total Negative Management EA contains an adaptive negative management system that can prevent losing trades and even account collapse in almost any market condition. Adapts to adverse market conditions and switches to the correct negative management strategy for any situation. TSO Signal Builder , TSO Order Recovery and TSO Loss Management are included and can be used in combination or individually. Apply negative management to any strategy (manual or automated). No pending orders placed
A must-have tool for any strategy based on divergence detection. 10 different oscillators can be used to detect divergences and can be combined with Double Top/Bottom patterns to confirm reversal signals. SCANNER is included . Now with Scanner you can find trading opportunities and setups easily and faster. Features Easily detect strong reversal signals. 10 different oscillators are available for divergence detection. Divergence & Top/Bottom detection can operate independently or combined. Get
TSO Top Bottom Divergence
Dionisis Nikolopoulos
This indicator combines double bottom and double top reversal chart patterns together with RSI divergence detection. Features Easily detect strong reversal signals Allows to use double top/bottom and RSI divergence signals combined or independently. Get email and/or push notification alerts when a signal is detected. Custom colors can be used The indicator is not repainting Can easily be used in an EA (see below) Inputs ENABLE Double Top - Bottom: Enable the double top - bottom indicator ENABL
TSO Fibonacci Chains
Dionisis Nikolopoulos
5 (1)
Fibonacci retracement is a method of technical analysis for determining support and resistance levels. The TSO Fibonacci Chains Indicator is different from a simple Fibonacci Retracements indicator in that it provides the targets for each retracement level. In other words, there is an Extension Level (D) for every Retracement Level (C). In addition, if an Extension Level is reached, then a new Fibonacci setup is created automatically. These consecutive Fibonacci setups create a chain that reveal
TSO Strength vs Exhaustion
Dionisis Nikolopoulos
A visually-simplified version of the RSI. The Relative Strength Index (RSI) is a well known momentum oscillator that measures the speed and change of price movements, developed by J. Welles Wilder. Color-coded bars are used to quickly read the RSI value and history. Features Find overbought and oversold situations at a glance. The indicator is non-repainting. The indicator can be easily used as part of an EA. (see below) Basic Strategy Look for shorts when the indicator is overbought. Look for
TSO Top Bottom Divergence MACD
Dionisis Nikolopoulos
5 (1)
This indicator combines double bottom and double top reversal chart patterns together with detection of divergences between the price chart and the MACD oscillator. Features Easily detect strong reversal signals Allows to use double top/bottom and MACD divergence signals combined or independently Get email and/or push notification alerts when a signal is detected Custom colors can be used The indicator is not repainting Can easily be used in an EA (see below) Inputs ENABLE Double Top - Bottom:
This indicator combines double bottom and double top reversal chart patterns together with detection of divergences between the price chart and the Momentum oscillator. Features Easily detect strong reversal signals Allows to use double top/bottom and Momentum divergence signals combined or independently Get email and/or push notification alerts when a signal is detected Custom colors can be used The indicator is not repainting Can easily be used in an EA (see below) Inputs ENABLE Double Top -
The Moving Average Slope (MAS) is calculated by detecting the moving average level n-periods ago and comparing it with the current moving average level. This way, the trend of the moving average can be drawn on the moving average line. This indicator allows to compare the slopes of two moving averages (fast and slow) to cancel out noise and provide better quality entry and exit signals SCANNER is included . Now with Scanner you can find trading opportunities and setups easily and faster. Featur
TSO Bollinger Bandit Strategy is an indicator based on the Bollinger Bandit Trading Strategy as presented in the book Building Winning Trading Systems with TradeStation by G. Pruitt and J. R. Hill. SCANNER is included . Now with Scanner you can find trading opportunities and setups easily and faster. Features A complete entry and exit strategy for trending markets. Get email / push notifications when an entry signal occurs. The indicator is not repainting. Can easily be used in an EA. (see For
TSO Price Channel
Dionisis Nikolopoulos
TSO Price Channel is complete trading strategy focused on creating profit from market volatility. The system takes advantage of the intrinsic tendency of the market to reach its periodic maximum and minimum levels. By allowing the use of multiple instruments, the exposure of the system to any single instrument is reduced. Complete strategy including fully integrated positive and negative management. Works on any instrument. No pending orders placed. Any account size - $1,000+ is recommended. Ba
TSO Thermostat Strategy is an indicator that can adapt to the current market conditions by switching from a trend-following mode to a short-term swing mode, thus providing the best possible entry/exit signals in any situation. It is based on the  Thermostat Trading Strategy  as presented in the book  Building Winning Trading Systems with TradeStation by G. Pruitt and J. R. Hill.   Strategy The Thermostat Strategy uses different entry and exit conditions based on the current situation of the mark
This indicator combines double bottom and double top reversal chart patterns together with RSI divergence detection. Features Easily detect strong reversal signals. Allows to use double top/bottom and RSI divergence signals combined or independently. Get email and/or push notification alerts when a signal is detected. Custom colors can be used. The indicator is not repainting. Can easily be used in an EA. (see below) Inputs ENABLE Double Top - Bottom: Enable the double top - bottom indicator.
TSO Fibonacci Chains MT5
Dionisis Nikolopoulos
Fibonacci retracement is a method of technical analysis for determining support and resistance levels. The TSO Fibonacci Chains Indicator is different from a simple Fibonacci Retracements indicator in that it provides the targets for each retracement level. In other words, there is an Extension Level (D) for every Retracement Level (C). In addition, if an Extension Level is reached, then a new Fibonacci setup is created automatically. These consecutive Fibonacci setups create a chain that reveal
TSO Signal Builder MT5
Dionisis Nikolopoulos
TSO Signal Builder MT5 is a MetaTrader 5 Expert Advisor that provides a solid platform to quickly build test and develop automated trading strategies based on indicator signals. Contains 29 indicators, including trend and volume indicators, oscillators as well as many indicators described by Bill Williams. Basic as well as advanced order management features. All indicators are configurable and can be combined to create strategies with different entry and exit signals as well as reverse orders.
TSO Order Recovery MT5
Dionisis Nikolopoulos
TSO Order Recovery is an expert advisor that provides a known and tested method of covering losses from open positions through hedging. It uses all the tools of the TSO Signal Builder EA - almost infinite entry/exit strategies Add negative management to any strategy (manual or automated) to eliminate losing trades No pending orders are placed Any account size - a minimum of $1,000 is recommended Works on any currency pair Allows for a lot of customization (a default strategy is included for demo
TSO Loss Management Lite contains all the features of TSO Loss Management except from the Swings mechanism and the other mechanisms based on Swings. Adapts to diverse market conditions and micromanages each trade opened so that the loses are covered as fast as possible but also with minimum risk. It uses all the tools of the TSO Signal Builder EA - almost infinite entry/exit strategies. Add negative management to any strategy (manual or automated) to eliminate losing trades. No pending orders ar
TSO Loss Management MT5
Dionisis Nikolopoulos
TSO Loss Management is an Expert Advisor that incorporates advanced mechanics to eliminate losses from losing trades. Adapts to diverse market conditions and micromanages each position to cover losses as fast as possible and with minimum risk It uses all the tools of the TSO Signal Builder EA - almost infinite entry/exit strategies Add negative management to any strategy (manual or automated) to eliminate losing trades No pending orders placed Any account size - $1,000+ is recommended Allows for
The TSO Total Negative Management EA contains an adaptive negative management system that can prevent losing trades and even account collapse in almost any market condition. Adapts to adverse market conditions and switches to the correct negative management strategy for any situation. TSO Signal Builder , TSO Order Recovery and TSO Loss Management are included and can be used in combination or individually. Apply negative management to any strategy (manual or automated). No pending orders placed
This indicator combines double bottom and double top reversal chart patterns together with detection of divergences between the price chart and the MACD oscillator. Features Easily detect strong reversal signals Allows to use double top/bottom and MACD divergence signals combined or independently Get email and/or push notification alerts when a signal is detected Custom colors can be used The indicator is not repainting Can easily be used in an EA (see below) Inputs ENABLE Double Top - Bottom:
필터:
리뷰 없음
리뷰 답변