TSO Strength vs Exhaustion
- 지표
-
Dionisis Nikolopoulos
 We are a small team of individuals with a strong passion for trading.
Our research is focused in the area of trading methods and mechanical trading systems
developed on the MT4 and MT5 trading platforms.
Many more features will be coming in the future, so stay with us! - 버전: 1.0
- 활성화: 10
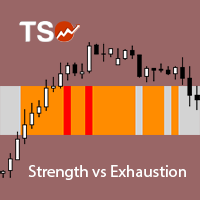
A visually-simplified version of the RSI. The Relative Strength Index (RSI) is a well known momentum oscillator that measures the speed and change of price movements, developed by J. Welles Wilder. Color-coded bars are used to quickly read the RSI value and history.
Features
- Find overbought and oversold situations at a glance.
- The indicator is non-repainting.
- The indicator can be easily used as part of an EA. (see below)
Basic Strategy
- Look for shorts when the indicator is overbought.
- Look for longs when the indicator is oversold.
Inputs
- Select RSI Period: Set the period of the RSI (21 is recommended)
- Last Bar Included: Include the bar being drawn in the RSI calculation
- LEVELS SETTINGS
- Level 1 Lower Limit (Overbought): The RSI value from which and above the market is considered the most overbought.
- Level 2 Lower Limit: The RSI value from which and above Level 2 starts.
- Level 3 Lower Limit: The RSI value from which and above Level 3 starts.
- Level 4 Lower Limit (Neutral): The RSI value from which and above Level 4 starts.
- Level 5 Lower Limit: The RSI value from which and above Level 5 starts.
- Level 6 Lower Limit: The RSI value below which the market is considered the most oversold.
- Level 7 Lower Limit = 0 (Oversold): Always 0, since the RSI ranges from 0 to 100.
- COLOR SETTINGS
- Level 1 Color (Overbought): The color of the indicator when the RSI has a value from the lower limit of level 1 and above.
- Level 2 Color : The color of the indicator when the RSI has a value from the lower limit of level 2 and above, till the lower limit of level 1.
- Level 3 Color : The color of the indicator when the RSI has a value from the lower limit of level 3 and above, till the lower limit of level 2.
- Level 4 Color (Neutral): The color of the indicator when the RSI has a value from the lower limit of level 4 and above, till the lower limit of level 3.
- Level 5 Color: The color of the indicator when the RSI has a value from the lower limit of level 5 and above, till the lower limit of level 4.
- Level 6 Color: The color of the indicator when the RSI has a value from the lower limit of level 6 and above, till the lower limit of level 5.
- Level 7 Color (Oversold):The color of the indicator when the RSI has a value below the lower limit of level 6.
For EA Developers
Use Buffer = 7 to load the RSI level to an EA. The return values are:
- Level 1 = 0
- Level 2 = 1
- Level 3 = 2
- Level 4 = 3
- Level 5 = 4
- Level 6 = 5
- Level 7 = 6