Ichimoku Trade Alarm
- 지표
- 버전: 1.0
- 활성화: 5

The most effective signals generated by Ichimoku strategies.
Ichimoku Trade Alarm is a supplement for Ichimoku Trade Panel and it shows the signals that Expert Advisor reacts to.
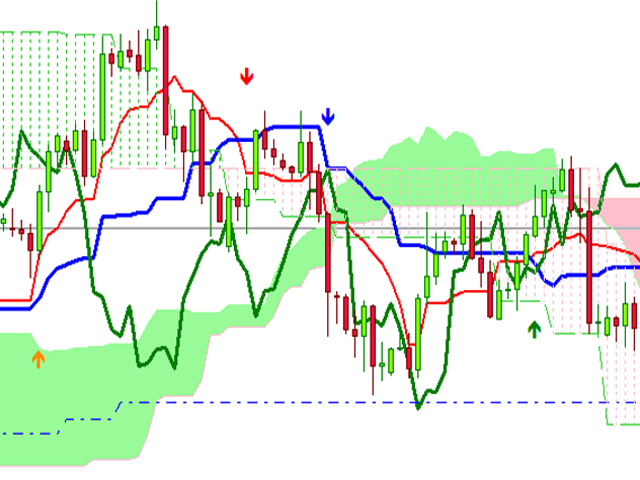
Visualization of signals:
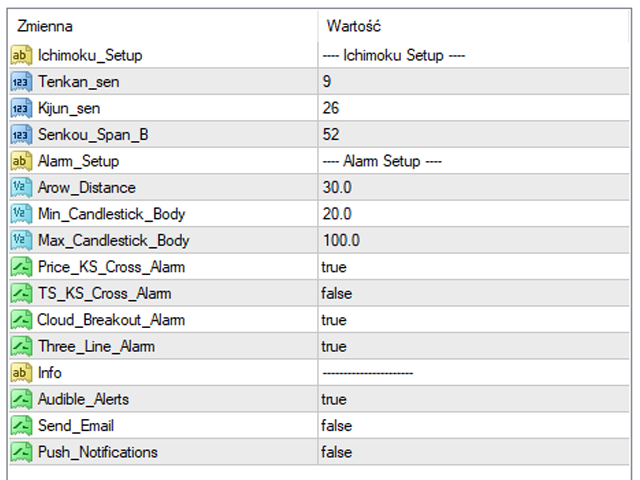
- Price / Kijun sen cross - the candle body must be between Min_Candlestick_Body and Max_Candlestick_Body. The candle must close above / below Kijun sen, minimum in 1/3 of its body. Open candle must be located above / below Kijun sen. Chinkou span must be under the price of 26 periods in advance.
- Tenkan sen / Kijun sen cross - closing the candle above / at Kijun sen and crossed Tenkan sen with Kijun sen.
- Cloud Breakout - the candle closing above / below the cloud, and the minimum of the candle must be inside the cloud. Tenkan sen must be above / below Kijun sen, while the candle body must be between Min_Candlestick_Body and Max_Candlestick_Body. Chinkou span must be under the price of 26 periods in advance.
- Three Line - the candle closing above / below Tenkan sen, Tenkan sen must be above / below Kijun sen, Kijun sen must be above / below the above / below cloud, candle body must be between Min_Candlestick_Body and Max_Candlestick_Body.