• 미리보기
  • 리뷰 (6)
  • 코멘트 (21)
  • 새 소식

Chart patterns scanner

4.67

recommend you to read the product's blog (manual) from start to end so that it is clear from the beginning what the indicator offers.

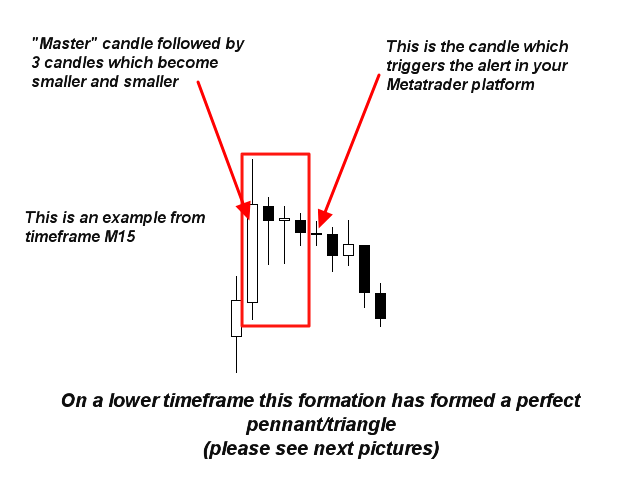
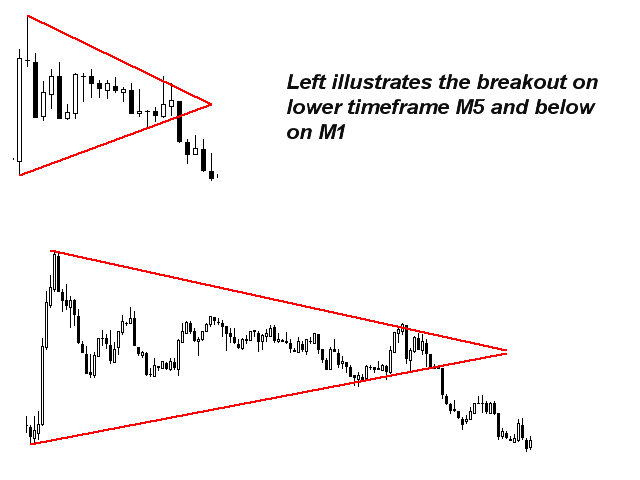
This multi time frame and multi symbol indicator identifies double top/bottom, head & shoulders, pennant/triangle and flag patterns. It is also possible to setup alerts only when a neckline/triangle/flagpole breakout has occured (neckline breakout = confirmed signal for top/bottoms and head & shoulders). The indicator can also be used in single chart mode. Please read more about this option in the product's blog. Combined with your own rules and techniques, this indicator will allow you to create (or enhance) your own powerful system.

Features

  • Can monitor all symbols visible in your Market Watch window at the same time. Apply the indicator to just one chart and instantly monitor the entire market.
  • Can monitor every time frame, from M1 to MN, and sends you a real-time alert when when the pattern has been identified or at neckline breakout (top/bottom and head and shoulders). All Metatrader native alert types are supported.
  • Can use RSI as a trend filter to properly identify potential reversals.
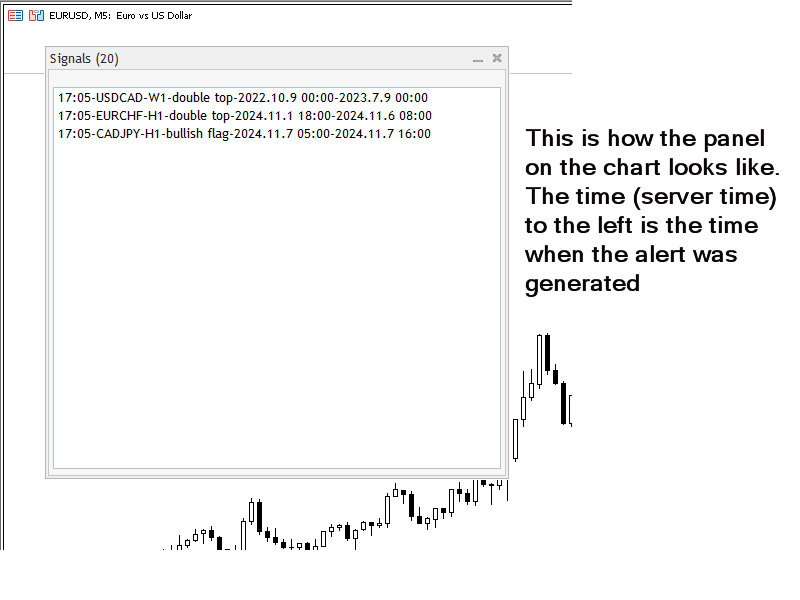
  • The indicator includes an interactive panel. When clicking on an item a new chart will be opened with the symbol and time frame in question.
  • The indicator writes the signals to a text file which can be used by an Expert Advisor (EA) for auto trading. You can find more information about the content and location of the text file in the blog.

Input parameters

The description and explanation of the input parameters can be found here.

Important

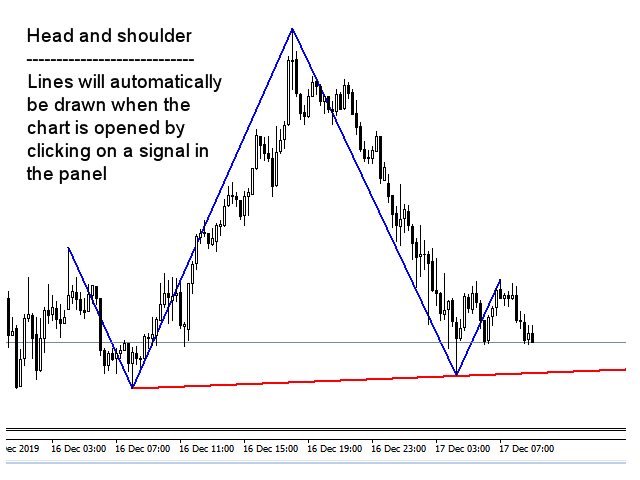
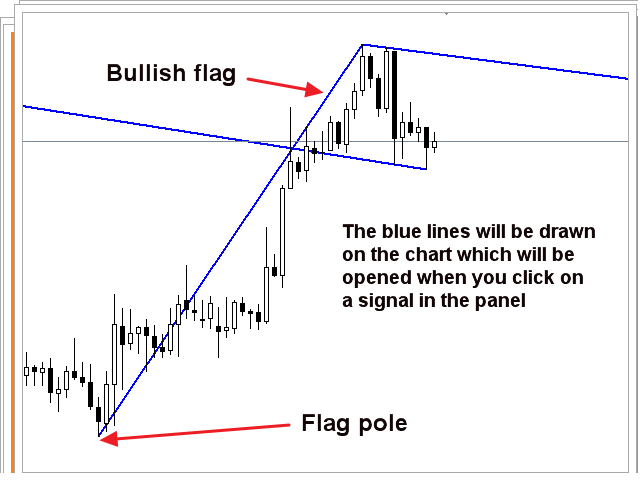
Please note that due to the multi functionality neither buy and sell advice nor lines and arrows will be drawn on the chart where the indicator is installed. Lines showing the pattern will be drawn on the chart which will be opened by clicking on a signal in the panel.

The indicator must be put on a clean (empty) chart without any other indicators or Expert Advisors on it which could interfere with the scanner.


리뷰 6
yamez
202
yamez 2023.01.29 04:08 
 

I've had this indicator for some time. Great for confirming reversals on lower TF, with higher TF confluences. Don't just take the signals as is. Saves me a lot of screen time.

Suvashish Halder
12329
Suvashish Halder 2021.10.15 20:53 
 

A++ Rated Scanner

viamal777
378
viamal777 2020.09.30 22:04 
 

This is the only scanner that actually works. And this is the developer that considers your requests to make it even better.

추천 제품
I  recommend you to read the   product's blog  (manual) from start to end so that it is clear from the beginning what the indicator offers. This multi time frame and multi symbol indicator scans for engulfing and tweezer formations. The indicator can also be used in single chart mode. Combined with your own rules and techniques, this indicator will allow you to create (or enhance) your own powerful system. Features Can monitor all symbols visible in your Market Watch window at the same time. Ap
My Point MT4
Claudia Ramona Angerer
4 (1)
Diagnosis of major and minor pivot Trend detection with many signals Can be used in all symbols Can be used in all time frames Settings: Back Show: The number of candles it displays If you need any adjustments, or have any questions or suggestions, message me How to trade: Blue: sell signal Red: buy signal Blue and red at the same time: no signal Exit signal: Opposite signal
Trend Lines
Rohlan Samino
This indicator is suitable for seeing trends and determining the time to open a position. It is equipped with a Stop Loss position. Easy to use. Just watch the arrows provided. Indicator parameters Shift - the number of bars used for the indicator shift to Right." Step Point per Period - the number of pips for down or Up trend lines" Time Frame - Calculate @ this Time Frame." Max_Bar - the number of bars used for calcuulate indicators (if '0' then All bars to calcuulate)." Alert_On - On or Off
이 다중 기호 및 다중 시간 프레임 표시기는 다음 촛대 패턴을 스캔합니다(패턴 설명은 스크린샷 참조). 백병 3명(역전>연속 패턴) 검은 까마귀 3마리(역전>연속 패턴) 강세 및 약세 쓰리 라인 스트라이크(역전 패턴) 지표 설정의 엄격한 옵션이 활성화된 경우 패턴이 더 높은 기간에 자주 나타나지 않습니다. 그러나 그렇게 할 때 그것은 매우 높은 가능성의 설정입니다. Thomas Bulkowski(국제적으로 알려진 촛대 패턴의 저자이자 선도적인 전문가)에 따르면 Three line strike는 모든 촛대 패턴의 전체 성능 순위가 가장 높습니다. 고유한 규칙 및 기술과 결합하여 이 표시기를 사용하면 강력한 시스템을 생성(또는 강화)할 수 있습니다. 특징 Market Watch 창에 표시되는 모든 기호를 동시에 모니터링할 수 있습니다. 하나의 차트에만 지표를 적용하고 전체 시장을 즉시 모니터링하십시오. M1에서 MN까지 모든 시간 프레임을 모니터링할 수 있으며 패턴이 식별되면 실시간 경
Trend Suffer
Philip Effiong Philip
Alerts you on new trends, with ENTRY and EXIT points. INSTRUCTIONS  Select asset of choice, activate the indicator on the chart and just follow the signals from the arrows. ITS FREE, GIVE ME A GOOD RATING! Platform : Metatrader4 Asset : All Currencies, Gold, BTCUSD, NASDAQ PS : F or newbie and pro traders. Used by more 3,000 traders around the world. Send  a mail for further help and information...........
Waddah Attar Explosion MT4
Do Thi Phuong Anh
5 (1)
The Waddah Attar Explosion (WAE) indicator is a potent tool in Forex trading, offering buy, sell, exit buy, and exit sell signals. It assesses trends as trend power and momentum as explosion power. Trend Direction: - Green bars indicate a bullish trend. - Red bars indicate a bearish trend. Signal Line: - A line serves as a threshold for momentum. Buy Trade Setup: **Entry:** Go long when a green bar crosses above the threshold. Place a stop loss below the entry candle. **Exit:** Close the
I recommend you to read the   product's blog  (manual) from start to end so that it is clear from the beginning what the indicactor offers. This multi time frame and multi symbol indicator identifies double or triple top/bottom formations or a following neckline breakout (confirmed top/bottom). It offers filters for RSI overbought/oversold, candle patterns (pin bar, engulfing, tweezer, morning/evening star, three line strike) and divergences (MACD, OsMA, Awesome (AO), RSI, CCI, Stochastic) whic
Introducing the Donchian Channels indicator for MQL4, a powerful technical analysis tool designed to boost your trading success. This indicator consists of four lines that represent the upper and lower boundaries of price movement over a specified period. With the Donchian Channels indicator, you can easily identify potential breakouts and reversals in the market. The upper line shows the highest high of the specified period, while the lower line represents the lowest low. The space between thes
Implement
Vitalii Zakharuk
5 (1)
Implement analyzes market dynamics for pivot points. If you want to learn how to spot the correct reversals for consistently likely profitable trading, buy this indicator. Shows favorable moments of entering the market in stripes. Ready-made trading system. The principle of operation of the indicator is to automatically determine the current state of the market when placed on a chart, analyze historical data based on historical data and display instructions for further actions on the trader's
Fibo Linear Channel
Igor Semyonov
4 (1)
Colored indicator of the linear channel based on the Fibonacci sequence. It is used for making trading decisions and analyzing market sentiment. The channel boundaries represent strong support/resistance levels, as they are the Fibonacci proportion levels. Users can select the number of displayed lines of channel boundaries on the chart by means of the input parameters. Attaching multiple instances of the indicator to the chart with different calculation periods leads to displaying a system of c
Th3 BarPlay Signals Mt4
Nnamdi Kennedy Ifeorah
이것은 3Bar_Play로 알려진 Price Action 기반 전략이며 3Bar 촛대 패턴 형성을 기반으로 합니다. 매수/매도 신호 화살표를 표시하기 전에 필터 및 확인을 위해 추가 표시기가 추가됩니다. 상승 추세, 하락 추세 또는 횡보 시장에서 거래될 수 있습니다. 추가된 지표는 다음과 같습니다. 스토캐스틱 - 모멘텀 피셔 - 트렌드 ATR - 신호 화살표의 베이스에서 손절매 배치를 명확하게 정의하는 변동성(ATR 손절매 방법 사용). 좋은 위험 관리를 통해 보상에 대한 위험은 1:1에서 1:4 사이가 될 수 있습니다. 매수 - 약세 막대 2개와 강세 막대 1개 후에 매수 신호가 나타날 때. 매도 - 2개의 강세 막대와 1개의 약세 막대 후에 매도 신호가 나타날 때. 추가 기능 차트의 신호를 켜거나 끄는 토글 버튼이지만 경보는 아닙니다. 설정 패널에서 조정 가능한 매개변수(다운로드 시 기본 설정). 이메일/푸시 알림을 활성화하여 화면에서 멀리 떨어져 있을 때 신호를 알려줍니다.
This unique auto trend line drawing indicator works on all time frames which can help you to easily trade short term trend reversals as well as  as well as short term trend breakouts indicating the stronger asset in the market. It uniquely allows you to get in EARLY for heavy swings. Inputs include:  - Max Candles Look Back for Trend Lines - Line Type and Color - Max Distance to Outer Band and Band Period - Options to Auto Re-Draw Trend Line off of the Pivot When a Confirmation Candle or
This indicator is based on Mr. Mark Fisher's ACD strategy, based on the book "The Logical Trader." - OR lines - A lines - C lines - Daily pivot range - N days pivot range - Customizable trading session - Drawing OR with the desired time Drawing levels A and C based on daily ATR or constant number - Possibility to display daily and last day pivots in color zone - Displaying the status of daily PMAs (layer 4) in the corner of the chart - Show the order of daily pivot placement with multi-day
FREE
Cloud Power
Andriy Sydoruk
Implementation of indication of trend movement with moments for potential stops in the Cloud Power indicator. The transition to the shadow warns of a possible reversal. The entry of the price inside the shadow speaks of a flat movement. The indicator tracks the market trend with unmatched reliability, ignoring sharp market fluctuations and noise around the average price. Simple, visual and efficient use. The indicator does not redraw and does not lag. It can be easily used as an independent
I recommend you to read the   product's blog  (manual) from start to end so that it is clear from the beginning what the indicactor offers. This multi time frame and multi symbol supply and demand zone dashboard indicator sends alerts when the price has reached a supply/demand zone. It is also possible to use it to be alerted about regular double tops/bottoms instead of zones. It can be used with all time frames from M1 to MN. It is possible to use RSI, divergence (MACD, OsMA, RSI or Awesome) a
Ross Hook is a price pattern indicator that help traders to forecast market inversions. The activation of the pattern could identify turning points by finding the breakout SR levels or technical analysis figures like triangles, rectangles or head and shoulder. The Indicator runs in  all Brokers  using  Metatrader 4  platform and can be used in an Expert Advisor or as a support of manual trading. This indicator is composed by the OnChart and OnWindow parts: OnChart : Draws the points 1, 2 and 3 t
The trader uses the Trend for Neuro indicator to determine the market situation. This is a trending algorithm that is convenient to download, install and use. The algorithm with acceptable accuracy generates input signals and output levels. Strategy for trend trading, filtering and all the necessary functions built into one tool! By launching the indicator, the user will see only two types of arrows that can change color to blue during an uptrend, to red during a downtrend there is no uncertaint
강력한 가격 행동 패턴을 감지하는 기술적 지표: 핀바, 인사이드 바, 아웃사이드 바 소개: 기술적 분석 분야에서 가격 행동 패턴은 잠재적인 시장 움직임의 중요한 지표로 기능합니다. 우리는 차트상의 견고한 가격 행동 패턴을 식별하는 데 도움을 주는 정교한 기술적 지표를 개발했습니다. 우리의 지표는 핀바, 인사이드 바, 아웃사이드 바라는 세 가지 중요한 패턴을 감지하는 데 특화되어 있습니다. 주요 감지 패턴: 핀바: 핀바 패턴은 시장 트렌드의 잠재적인 반전을 나타내는 단일 양초 형성입니다. 작은 몸체와 몸체 위나 아래로 튀어나온 긴 꼬리 또는 "위크"로 특징지어집니다. 상승 핀바는 가능한 상승 반전을 시사하며, 하락 핀바는 하락 반전을 시사합니다. 인사이드 바: 인사이드 바 패턴은 단일 양초의 전체 가격 범위가 이전 양초의 가격 범위 내에 들어가는 경우 발생합니다. 이 패턴은 임시적인 증시 합리화나 불확실성을 나타내며 종종 양방향으로의 돌파를 앞서는 신호로 작용합니다. 아웃사이드 바:
FE Fibo Expansion
Syahirul Nizzam Bin Haron
5 (1)
This is Fibo Expansion. You can use it, as profit target at any level... It use price Highs and Lows and price between... It is simple and easy to use... No Input menu, just drag it on your chart and it ready to use... The blue and red dot color indicate it direction... It also use as the same as fractal high and low price as the points to construct the levels... No more analysis to choose the points..
FREE
Bid Ask Level
Chantal Sala
Bid Ask Level is a very simple indicator but, at the same time, very powerful . Using the logic of the minimum and maximum of the previous periods is able to intercept the important levels of demand and supply. The indicator permits setting the numbers of history candles to read very important levels in the past and show them in the current chart. You can see these power levels with horizontal lines designed on the chart. The indicator also permits uploading many different levels (of different t
Part One : Characteristics Integrated line drawing and wave marking function Automatic adsorption( namely Auto Search High/Low )during Drawing Draw zigzag Lines and Fibo/Expansion at the same time Calculate the scale rate of  Interval Spans which is called Qjt for short Continuously delete objects by click Deleting drawings in batch Show/Hide Drawings and Wave-Marks Quickly save current chart as picture to certain folder Show/Hide main panel by  click certain zone of PriceAxis or by hotkey W Swi
Contact me for instruction, any questions! Introduction A flag can be used as an entry pattern for the continuation of an established trend. The formation usually occurs after a strong trending move. The pattern usually forms at the midpoint of a full swing and shows the start of moving. Bullish flags can form after an uptrend, bearish flags can form after a downtrend. Flag Pattern Scanner Indicator It is usually difficult for a trader to recognize classic patterns on a chart, as well as sear
The indicator sends messages to e-mail and mobile terminal when the price approaches the horizontal levels and trend lines that are drawn using the handy panel! The levels and trend lines are deleted and placed to the chart using one click on the panel, and they can be dragged on the chart by mouse! It is possible to set the interval between messages in the settings, the interval is applied to each object separately! Indicator Settings ===*** Main settings ***=== - below is the list of the mai
Effect
Maryna Shulzhenko
The Effect indicator shows the points of potential market reversal. Simple, visual and efficient trend detection. Ready-made trading system. The intelligent algorithm of the indicator determines the trend with good probability. Uses just one parameter for settings. The indicator does not redraw and does not lag. Works on all currency pairs and all timeframes. You should remember that using a combination of forecasting tools, it is advisable to choose 2-3 indicators for trading. Otherwise, the
KT Tether Line MT4
KEENBASE SOFTWARE SOLUTIONS
The KT Tether Line is a trend-following tool consisting of three indicators that work together to generate trading signals. It can correctly identify market trends while signaling trade entries. It was first introduced by Bryan Strain in the Stock & Commodities magazine in 2000 in "How to get with the trend and out at the end." The Concept When a market trend is confirmed, the most challenging part is determining the timing of the entries. This indicator alerts you to potential trend reversal
Clever RSI
Carlos Forero
Description Better version of RSI indicator which offer a complete visual trading strategy and realize an auto-optimization Support:   We create great tools for the entire trading community. Most of them are free. If you believe in what we do  Support Us Here.   KEY LINKS:   How to Install  –  Frequent Questions  -  All Products  How is this indicator useful? NEVER repaints. Detect best parameters of RSI indicator, based on profit factor during the specified period. This indicator can be used as
Rira VWAP Bands
Vitor Palmeira Abbehusen
VWAP Bands gives you the regular Volume-Weighted Average Price and also the deviation bands. Use this indicator to see the possible amount of market movement, find support and resistance lines, find good spots for entry and exit,  and the most important feature is to find possible pivot points. This indicator has been mathematically improved by Rira team. The calculation begins at the start of each trading day
Pivot levels Auto V1
Hafis Mohamed Yacine
What Is a Pivot Point? A pivot point is a technical analysis indicator, or calculations, used to determine the overall trend of the market over different time frames. The pivot point itself is simply the average of the intraday high and low, and the closing price from the previous trading day. On the subsequent day, trading above the pivot point is thought to indicate ongoing bullish sentiment, while trading below the pivot point indicates bearish sentimen How to Use Pivot Points The very e
I recommend you to read the   product's blog  (manual) from start to end so that it is clear from the beginning what the indicactor offers. This multi time frame and multi symbol indicator scans for pin bars. Combined with your own rules and techniques, this indicator will allow you to create (or enhance) your own powerful system. Features Can monitor all symbols visible in your Market Watch window at the same time. Apply the indicator to just one chart and instantly monitor the entire market.
The indicator draws trend lines based on Thomas Demark algorithm. It draws lines from different timeframes on one chart. The timeframes can be higher than or equal to the timeframe of the chart, on which the indicator is used. The indicator considers breakthrough qualifiers (if the conditions are met, an additional symbol appears in the place of the breakthrough) and draws approximate targets (target line above/below the current prices) according to Demark algorithm. Recommended timeframes for t
이 제품의 구매자들이 또한 구매함
Gann Made Easy
Oleg Rodin
4.96 (45)
Gann Made Easy 는 mr.의 이론을 사용하여 최고의 거래 원칙을 기반으로 하는 전문적이고 사용하기 쉬운 Forex 거래 시스템입니다. W.D. 간. 이 표시기는 Stop Loss 및 Take Profit Levels를 포함하여 정확한 BUY 및 SELL 신호를 제공합니다. PUSH 알림을 사용하여 이동 중에도 거래할 수 있습니다. 구매 후 연락주세요! 내 거래 팁과 훌륭한 보너스 지표를 무료로 공유하겠습니다! 아마도 Gann 거래 방법에 대해 이미 여러 번 들었을 것입니다. 일반적으로 Gann의 이론은 초보자 거래자뿐만 아니라 이미 거래 경험이 있는 사람들에게도 매우 복잡한 것입니다. Gann의 거래 방식은 이론적으로 적용하기 쉽지 않기 때문입니다. 나는 그 지식을 연마하고 Forex 지표에 최고의 원칙을 적용하기 위해 몇 년을 보냈습니다. 표시기는 적용하기가 매우 쉽습니다. 차트에 첨부하고 간단한 거래 권장 사항을 따르기만 하면 됩니다. 지표는 지속적으로 시장 분석 작업
Atomic Analyst
Issam Kassas
5 (1)
우선적으로 언급할 점은이 거래 지표가 다시 그리지 않고 지연되지 않으며 이를 통해 수동 및 로봇 거래 모두에 이상적이라는 점입니다. Atomic Analyst는 가격의 강도와 모멘텀을 활용하여 시장에서 더 나은 이점을 찾는 PA Price Action Indicator입니다. 고급 필터를 장착하여 잡음과 거짓 신호를 제거하고 거래 잠재력을 높이는 데 도움이 됩니다. 복잡한 지표의 다중 레이어를 사용하여 Atomic Analyst는 차트를 스캔하고 복잡한 수학적 계산을 간단한 신호와 색상으로 변환하여 초보 트레이더가 이해하고 일관된 거래 결정을 내릴 수 있도록합니다. "Atomic Analyst"는 새로운 및 경험이 풍부한 트레이더를위한 종합적인 거래 솔루션입니다. 프리미엄 지표와 최고 수준의 기능을 하나의 거래 전략에 결합하여 모든 종류의 트레이더에 대한 다재다능한 선택지가되었습니다. 인트라데이 거래 및 스캘핑 전략 : 빠르고 정확한 일일 거래 및 단기 거래를 위해 설계
TPSproTREND PrO
Roman Podpora
5 (15)
TPSpro TRENDPRO  - is a trend indicator that automatically analyzes the market and provides information about the trend and each of its changes, as well as giving signals for entering trades without redrawing! The indicator uses each candle, analyzing them separately. referring to different impulses - up or down impulse. Exact entry points into transactions for currencies, crypto, metals, stocks, indices!  -  Version MT5               DETAILED DESCRIPTION        /       TRADING SETUPS           
Quantum Trend Sniper Indicator MT4
Bogdan Ion Puscasu
4.59 (39)
소개       Quantum Trend Sniper Indicator는   추세 반전을 식별하고 거래하는 방식을 변화시키는 획기적인 MQL5 지표입니다! 13년 이상의 거래 경험을 가진 숙련된 트레이더 팀이 개발한       Quantum Trend Sniper 표시기       매우 높은 정확도로 추세 반전을 식별하는 혁신적인 방법으로 거래 여정을 새로운 차원으로 끌어올리도록 설계되었습니다. ***Quantum Trend Sniper Indicator를 구입하면 Quantum Breakout Indicator를 무료로 받을 수 있습니다!*** Quantum Trend Sniper Indicator는 추세 반전을 식별하고 세 가지 이익실현 수준을 제안할 때 경고, 신호 화살표를 제공합니다. 초보자 거래자와 전문 거래자 모두에게 적합합니다. Quantum EA 채널:       여기를 클릭하세요 MT5 버전:       여기를 클릭하세요
Scalper Vault
Oleg Rodin
5 (27)
Scalper Vault 는 성공적인 스캘핑에 필요한 모든 것을 제공하는 전문 스캘핑 시스템입니다. 이 표시기는 외환 및 바이너리 옵션 거래자가 사용할 수 있는 완전한 거래 시스템입니다. 권장 시간 프레임은 M5입니다. 시스템은 추세 방향으로 정확한 화살표 신호를 제공합니다. 또한 상단 및 하단 신호와 Gann 시장 수준을 제공합니다.  이 시스템은 사용하기가 매우 쉽습니다. 원하는 시장 지역의 화살표만 따라가면 됩니다. 엑시트는 가격이 적정 수준에 도달하거나 시장의 고점 또는 저점 신호가 나타날 때 수행됩니다.  표시기는 PUSH 알림을 포함한 모든 유형의 경고를 제공합니다. 인디케이터 구매 후 연락주세요. 내 개인 거래 권장 사항과 훌륭한 보너스 지표를 무료로 공유합니다! 나는 당신에게 행복하고 유익한 거래를 기원합니다!
TPSpro RFI Levels
Roman Podpora
5 (13)
A key element in trading is zones or levels from which decisions to buy or sell a trading instrument are made. Despite attempts by major players to conceal their presence in the market, they inevitably leave traces. Our task was to learn how to identify these traces and interpret them correctly. Reversal First Impulse levels (RFI)   -  Version MT5                INSTRUCTIONS                 RUS                 ENG                                       R ecommended to use with an indicator   -  
Advanced Currency Strength28 Indicator
Bernhard Schweigert
4.9 (662)
현재 26% 할인 초보자 또는 전문가 트레이더를 위한 최고의 솔루션! 이 지표는 우리가 독점 기능과 새로운 공식을 통합했기 때문에 독특하고 고품질이며 저렴한 거래 도구입니다. 단 하나의 차트로 28 Forex 쌍의 통화 강도를 읽을 수 있습니다! 새로운 추세 또는 스캘핑 기회의 정확한 트리거 포인트를 정확히 찾아낼 수 있기 때문에 거래가 어떻게 개선될지 상상해 보십시오. 사용 설명서: 여기를 클릭  https://www.mql5.com/en/blogs/post/697384 그것이 첫 번째, 원본입니다! 쓸모없는 지망생 클론을 사지 마십시오. 더 스페셜  강력한 통화 모멘텀을 보여주는 하위 창의 화살표 GAP가 거래를 안내합니다! 기본 또는 호가 통화가 과매도/과매도 영역(외부 시장 피보나치 수준)에 있을 때 개별 차트의 기본 창에 경고 표시가 나타납니다. 통화 강도가 외부 범위에서 떨어질 때 풀백/반전 경고. 교차 패턴의 특별 경고 추세를 빠르게 볼 수 있는
현재 20% 할인 ! 초보자 또는 전문가 트레이더를 위한 최고의 솔루션! 이 대시보드 소프트웨어는 28개의 통화 쌍에서 작동합니다. 2가지 주요 지표(Advanced Currency Strength 28 및 Advanced Currency Impulse)를 기반으로 합니다. 전체 Forex 시장에 대한 훌륭한 개요를 제공합니다. 고급 통화 강도 값, 통화 이동 속도 및 모든(9) 시간대의 28 Forex 쌍에 대한 신호를 보여줍니다. 추세 및/또는 스캘핑 기회를 정확히 파악하기 위해 차트의 단일 지표를 사용하여 전체 시장을 볼 수 있을 때 거래가 어떻게 개선될지 상상해 보십시오! 잠재적인 거래를 식별하고 확인하면서 강력한 통화와 약한 통화를 더욱 쉽게 식별할 수 있도록 이 지표에 기능을 내장했습니다. 이 표시기는 통화의 강세 또는 약세가 증가 또는 감소하는지 여부와 모든 시간대에서 수행되는 방식을 그래픽으로 보여줍니다. 추가된 새로운 기능은 현재 시장 조건 변화에 적
Entry Points Pro
Yury Orlov
4.7 (224)
다시 색을 칠하지 않고 거래에 진입할 수 있는 정확한 신호를 제공하는 MT4용 지표입니다. 외환, 암호화폐, 금속, 주식, 지수 등 모든 금융 자산에 적용할 수 있습니다. 매우 정확한 추정값을 제공하고 매수와 매도의 가장 좋은 시점을 알려줍니다. 하나의 시그널로 수익을 내는 지표의 예와 함께 비디오 (6:22)시청하십시오! 대부분의 거래자는 Entry Points Pro 지표의 도움으로 첫 거래 주 동안 트레이딩 결과를 개선합니다. 저희의   Telegram Group 을 구독하세요! Entry Points Pro 지표의 좋은점. 재도색이 없는 진입 신호 신호가 나타나고 확인되면(시그널 캔들이 완성된 경우) 신호는 더 이상 사라지지 않습니다. 여타 보조지표의 경우 신호를 표시한 다음 제거되기 때문에 큰 재정적 손실로 이어집니다. 오류 없는 거래 게시 알고리즘을 통해 트레이드(진입 또는 청산)를 할 이상적인 순간을 찾을 수 있으며, 이를 통해 이를 사용하는 모든 거래자의
Advanced Supply Demand
Bernhard Schweigert
4.92 (310)
현재 33% 할인! 초보자나 전문 트레이더를 위한 최고의 솔루션! 이 보조지표는 우리가 다수의 독창적 기능과 새로운 공식을 통합한 독특하고 고품질이며 저렴한 거래 도구입니다. 이 업데이트를 통해 이중 시간대를 표시할 수 있습니다. 더 높은 TF를 표시할 수 있을 뿐만 아니라 차트 TF와 더 높은 TF 모두를 표시할 수 있습니다: 중첩 영역 표시. 모든 Supply Demand 트레이더들이 좋아할 것입니다. :) 중요한 정보 공개 Advanced Supply Demand의 잠재력을 극대화하려면 다음을 방문하십시오. https://www.mql5.com/ko/blogs/post/720245   진입 또는 목표의 명확한 트리거 포인트를 정확히 찾아냄으로 해서 거래가 어떻게 개선될지 상상해 보십시오. 새로운 알고리즘을 기반으로 매수자와 매도자 간의 잠재적인 불균형을 훨씬 더 쉽게 분간할 수 있습니다. 왜냐하면 가장 강한 공급영역과 가장 강한 수요 영역과 과거에 어떻게 진행 되었는지를(이
XQ Indicator MetaTrader 4
Marzena Maria Szmit
3 (2)
Step into the realm of Forex trading with confidence and precision using XQ, a cutting-edge Forex indicator designed to elevate your trading game to unprecedented heights. Whether you're a seasoned trader or just stepping into the world of currency exchange,   XQ Forex Indicator   empowers you with the insights and signals needed to make informed trading decisions. The signal conditions are a combination of three indicators, and XQ Forex Indicator only display  medium and long-term trends . The
TrendMaestro
Stefano Frisetti
5 (2)
note: this indicator is for METATRADER4, if you want the version for METATRADER5 this is the link: TRENDMAESTRO recognizes a new TREND in the bud, he never makes mistakes. The certainty of identifying a new TREND is priceless. DESCRIPTION TRENDMAESTRO identifies a new TREND in the bud, this indicator examines the volatility, volumes and momentum to identify the moment in which there is an explosion of one or more of these data and therefore the moment in which prices have strong probability of f
기적적인 외환 지표 소개: 정확한 트레이딩의 힘을 발휘하세요 모든 시간대에서 뛰어난 결과를 제공하는 최고의 외환 지표를 찾는데 지친 적이 있나요? 더 이상 찾을 필요가 없습니다! 기적적인 외환 지표가 도래하여 귀하의 트레이딩 경험을 혁신하고 수익을 새로운 고도로 끌어올립니다. 최첨단 기술과 수년간의 정성스런 개발을 토대로 기적적인 외환 지표는 외환 시장에서의 힘과 정확성의 정점으로 떠오릅니다. 이 탁월한 도구는 모든 수준의 트레이더의 요구를 충족시키고 지속적인 수익을 추구하는 데에서 비길 데 없는 우위를 제공하기 위해 설계되었습니다. 기적적인 외환 지표의 가장 큰 장점은 그 뛰어난 적응성에 있습니다. 당신이 데이 트레이더, 스윙 트레이더이든 장기 포지션을 선호하든, 이 지표는 모든 시간대에서 뛰어난 결과를 제공하기 위해 최적화되었습니다. 그러나 그 정확성과 시장의 복잡한 움직임을 포착하는 능력이 참으로 빛을 발하는 것은 1시간 기간대에서 사용할 때입니다. 기적적인 외환 지표의 정확성
FX Power MT4 NG
Daniel Stein
5 (8)
모닝 브리핑 여기 mql5 와 텔레그램에서 FX Power MT4 NG 는 오랫동안 인기 있는 통화 강도 측정기인 FX Power의 차세대 버전입니다. 이 차세대 강도 측정기는 무엇을 제공합니까? 기존 FX Power에서 좋아했던 모든 것 PLUS GOLD/XAU 강도 분석 더욱 정밀한 계산 결과 개별 구성 가능한 분석 기간 더 나은 성능을 위한 사용자 정의 가능한 계산 한도 특별 멀티더 많은 것을보고 싶은 사람들을위한 특별한 다중 인스턴스 설정 모든 차트에서 좋아하는 색상을위한 끝없는 그래픽 설정 수많은 알림 옵션, 중요한 것을 다시는 놓치지 않도록 Windows 11 및 macOS 스타일의 둥근 모서리가 있는 새로운 디자인 마법처럼 움직이는 인디케이터 패널 FX 파워 키 특징 모든 주요 통화의 완전한 강세 이력 모든 시간대에 걸친 통화 강세 이력 모든 브로커 및 차트에서 고유 계산 결과 100% 신뢰할 수있는 실시간100 % 신뢰할 수있는 실시간 계산-> 다시 칠하지 않음
EasyTrade Indicator
Gabor Bocsak
5 (5)
다중 통화 및 다중 시간대 매수 및 매도 알림. 자동 추적 중지 및 위험 보상 이익 실현! 지표는 시장을 스캔하고 분석하므로 귀하가 할 일이 없습니다! 하나의 차트에서 모든 통화를 거래하세요!   구매 후 댓글 남겨주시면 연락드리겠습니다. 무역도우미 EA를 보내드리겠습니다. 표시기는 여러 오실레이터와 부착된 필터를 사용하여 최상의 확인 진입점을 찾으므로 걱정할 필요가 없습니다! 이는 귀하에게 경고하고 귀하가 시청하기로 선택한 모든 기간과 통화에 대한 버튼을 그립니다. 버튼을 누르면 차트로 이동하여 거래를 시작할 수 있습니다! 이 표시기는 또한 모든 기본 및 시장 감시 통화에 대한 강도 패널을 그립니다(설정에서 조정 가능). 그러면 모든 통화 쌍과 선택한 더 높은 기간의 통화가 표시됩니다. 표시기 창에는 추세 필터가 포함된 특수 MACD 히스토그램과 차트 통화에 대한 다중 기간 추세 패널이 있습니다! 모든 통화와 시간대에 대한 거래 알림을 제공하며 버튼을 누르면
Quantum Breakout Indicator PRO
Bogdan Ion Puscasu
4.96 (26)
소개       Quantum Breakout PRO   , 브레이크아웃 존 거래 방식을 변화시키는 획기적인 MQL5 지표! 13년 이상의 거래 경험을 가진 숙련된 트레이더 팀이 개발한   Quantum Breakout PRO는   혁신적이고 역동적인 브레이크아웃 영역 전략으로 거래 여정을 새로운 차원으로 끌어올리도록 설계되었습니다. Quantum Breakout Indicator는 5개의 이익 목표 영역이 있는 브레이크아웃 영역의 신호 화살표와 브레이크아웃 상자를 기반으로 한 손절 제안을 제공합니다. 초보자 거래자와 전문 거래자 모두에게 적합합니다. Quantum EA 채널:       여기를 클릭하세요 MT5 버전 :   여기를 클릭하세요 중요한! 구매 후 설치 매뉴얼을 받으려면 개인 메시지를 보내주십시오. 추천: 기간: M15 통화쌍: GBPJPY, EURJPY, USDJPY,NZDUSD, XAUUSD 계정 유형: 스프레드가 매우 낮은 ECN, Ra
Currency Strength Wizard
Oleg Rodin
4.91 (44)
통화 강도 마법사는 성공적인 거래를 위한 올인원 솔루션을 제공하는 매우 강력한 지표입니다. 표시기는 여러 시간 프레임의 모든 통화 데이터를 사용하여 이 또는 해당 외환 쌍의 힘을 계산합니다. 이 데이터는 특정 통화의 힘을 확인하는 데 사용할 수 있는 사용하기 쉬운 통화 지수 및 통화 전력선의 형태로 표시됩니다. 필요한 것은 거래하려는 차트에 표시기를 부착하는 것뿐입니다. 표시기는 거래하는 통화의 실제 강세를 보여줍니다. 지표는 또한 추세와 거래할 때 유리하게 사용할 수 있는 구매 및 판매 거래량 압력의 극한값을 보여줍니다. 지표는 또한 피보나치에 기반한 가능한 대상을 보여줍니다. 표시기는 PUSH 알림을 포함한 모든 유형의 알림을 제공합니다. 구매 후 연락주세요. 나는 당신과 거래 팁을 공유하고 당신에게 무료로 훌륭한 보너스 지표를 줄 것입니다! 나는 당신에게 행복하고 유익한 거래를 기원합니다!
PRO Renko System
Oleg Rodin
5 (24)
PRO Renko System 은 RENKO 차트 거래를 위해 특별히 고안된 매우 정확한 거래 시스템입니다. 이것은 다양한 거래 상품에 적용될 수있는 보편적 인 시스템입니다. 체계는 효과적으로 당신에게 정확한 반전 신호에 접근을 주는 소위 시장 소음을 중화합니다. 이 표시기는 사용하기가 매우 쉽고 신호 생성을 담당하는 매개 변수가 하나만 있습니다. 당신은 쉽게 당신의 선택의 어떤 무역 계기에 공구를 적응시킬 수 있고 renko 막대기의 크기. 나는 항상 당신이 내 소프트웨어로 수익성있게 거래 할 수 있도록 추가 지원을 제공 할 준비가되어 있습니다! 나는 당신에게 행복하고 수익성있는 거래를 기원합니다! 구매 후 저에게 연락하십시오! 내 렌코 차트 생성기를 보내드립니다. 또한 내 개인 권장 사항 및 시스템의 다른 모듈을 무료로 공유 할 것입니다!
TrendDecoder Premium
Christophe, Pa Trouillas
5 (3)
범위 및 다음 가능한 움직임 식별   |  추세의 초기 신호와 강도를 확인하세요   |  반전 전 명확한 출구 확보   |  가격이 테스트 할 피보 레벨 파악 비추적, 비지연 지표 - 수동 및 자동 거래에 이상적 - 모든 자산 및 모든 시간 단위에 적합 기간 한정 혜택 >>   50% 할인 구매 후 이 채널로 문의 하여 권장 설정을 확인하세요. MT5   버전:   여기를 클릭하세요 BladeSCALPER   및   PowerZONES   로 전체 방법을 확인하세요. 어떤 서비스인가요? 트렌드디코더는 추세 모니터링을 간단하고 쉽게 하기 위한 여러 혁신 기술의 집약체입니다. 투영 추세선(투영 추세선) - 다가오는 추세의 속도 기준 실시간 추세선과 투영 추세선 비교 - 시장이 이전과 같은 방향으로 움직이고 있는지, 아니면 둔화되고 있는지? 실시간 추세선 교차 - 추세가 궤도를 이탈하고 있습니다. 그레이박스 - 시장이 더 이상 추세가 아니며 새로운 전환기에 들어섰습
맞춤형 MT4 지표로 성공적인 외환 거래에 대한 비밀을 발견하십시오! 외환 시장에서 성공을 달성하고 위험을 최소화하면서 일관되게 이익을 얻는 방법을 궁금해 한 적이 있습니까? 여기에 당신이 찾고 있던 답이 있습니다! 거래에 대한 귀하의 접근 방식을 혁신 할 독점적 MT4 지표를 소개 할 수 있습니다. 독특한 다양성 우리의 지표는 Renko 및 Rangebar Candle Formations를 선호하는 사용자를 위해 특별히 설계되었습니다. 우리는 이러한 차트 유형이 많은 숙련 된 거래자들이 선호한다는 것을 이해하기 때문에 우리의 지표가 그들과 완벽하게 통합되어 비교할 수없는 시장 분석을 제공합니다. 명확한 추세 신호 복잡한 분석을 잊어 버리십시오! 우리의 지표는 생생한 색상과 명확한 점 구조를 사용하여 시장 동향을 명확하게 나타냅니다. 빨간색과 파란색 점은 가격 이동 방향에 대해 의심의 여지가 없어 거래에서 빠른 의사 결정을 할 수 있습니다. HH/HL HL/LL
TakePropips Donchian Trend Pro
Eric John Pajarillaga Aldana
4.82 (17)
TakePropips Donchian Trend Pro   (MT4)는 Donchian 채널을 사용하여 추세의 방향을 자동으로 감지하고 진입 및 퇴장 거래 신호를 제공하는 강력하고 효과적인 도구입니다! 이 다기능 지표에는 추세 스캐너, 거래 신호, 통계 패널, 스크리너, 거래 세션 및 경고 내역 대시보드가 포함됩니다. 거래 신호를 제공하고 차트 분석 시간을 절약하도록 설계되었습니다! 다음 블로그 게시물에서 사용자 설명서 및 설치 가이드를 다운로드할 수 있습니다.   https://www.mql5.com/en/blogs/post/751368 오늘 50% 할인을 받으세요! 가격이 $98에서 $49로 인하되었습니다! 전략 테스터에서 이 지표를 테스트할 수 있습니다(비주얼 모드 활성화). 실시간 차트에서 테스트하고 싶다면 저에게 메시지를 보내 7일 평가판을 받을 수도 있습니다. 자세한 내용은 설명 아래에 비디오 자습서도 제공됩니다. 질문이 있거나 도움이 필요하면 저에게 연락하십시오.
Scalper Inside PRO
Alexey Minkov
4.75 (55)
SALE NOW! Limited Time Offer! An exclusive indicator that utilizes an innovative algorithm to swiftly and accurately determine the market trend. The indicator automatically calculates opening, closing, and profit levels, providing detailed trading statistics. With these features, you can choose the most appropriate trading instrument for the current market conditions. Additionally, you can easily integrate your own arrow indicators into Scalper Inside Pro to quickly evaluate their statistics and
FX Volume
Daniel Stein
4.6 (35)
모닝 브리핑을 통해 세부 정보와 스크린샷으로 매일 시장 업데이트를 받으세요 여기 mql5 및 텔레그램에서 FX 거래량은 브로커의 관점에서 시장 심리에 대한 실제 통찰력을 제공하는 최초이자 유일한 거래량 지표입니다. 브로커와 같은 기관 시장 참여자가 외환 시장에서 어떤 포지션을 취하고 있는지에 대한 훌륭한 통찰력을 COT 보고서보다 훨씬 빠르게 제공합니다. 차트에서 이 정보를 직접 확인하는 것은 트레이딩의 진정한 판도를 바꾸고 획기적인 솔루션입니다. 다음과 같은 고유한 시장 데이터 인사이트의 이점 비율 는 통화의 매수/매도 포지션 비율을 백분율로 표시 비율 변화 는 선택한 기간 내 매수 비율과 비율 변화를 표시 총 거래량 는 해당 통화의 총 거래량(롱 및 숏)을 로트 단위로 보여줍니다 Volumes Long 는 해당 통화의 모든 롱 포지션의 거래량을 보여줍니다 Volumes Short 는 해당 통화의 모든 숏 포지션의 거래량을 보여줍니다 Net Long 는 순 롱 포지션의 거래량
Cycle Sniper
Elmira Memish
4.41 (34)
NEW YEAR SALE PRICE FOR LIMITED TIME!!! Please contact us after your purchase and we will send you the complimentary indicators to complete the system Cycle Sniper is not a holy grail but when you use it in a system which is explained in the videos, you will feel the difference. If you are not willing to focus on the charts designed with Cycle Sniper and other free tools we provide, we recommend not buying this indicator. We recommend watching the videos about the indiactor and system before pu
Shepherd Harmonic Pattern
Abdullah Alrai
4.68 (59)
이 지표는 수동 및 자동 방법으로 차트에 그려진 고조파 패턴을 감지합니다. 사용자 매뉴얼은 다음 링크에서 확인할 수 있습니다. 리뷰를 작성하고 문의하면 무료 버전으로 MT4에서 제품을 시도할 수 있습니다. Gartley 및 Nenstar 패턴을 감지하는 데 사용할 수 있습니다. https://www.mql5.com/en/market/product/30181 전체 MT4 버전을 구입하려면 다음에서 구입할 수 있습니다. https://www.mql5.com/en/market/product/15212 참고 사항 지표에는 제어 패널이 있으며 모든 (차트 및 시간대) 설정을 저장합니다. 차트에서 더 많은 공간을 확보하려면 최소화할 수 있으며, 다른 분석 도구로 작업하는 것이 선호되는 경우 모든 지표 데이터를 숨기려면 닫기 버튼을 누를 수 있습니다. 이 지표를 사용하고 설정을 변경하면 이동 평균 또는 볼린저 밴드와 같은 지표를 추가하면 자동으로 템플릿을 저장하고 필요할 때 언제든지 로드할 수
우선적으로 이 거래 시스템은 다시 그리지 않고, 다시 그리지 않으며, 지연되지 않는 것을 강조할 가치가 있습니다. 이는 전문적인 거래에 이상적입니다. "스마트 서포트 앤 레지스턴스 트레이딩 시스템"은 새로운 및 경험 많은 트레이더를 위해 개발된 고급 지표입니다. 이 시스템은 외환 시장에서 정밀도와 신뢰감을 제공합니다. 이 포괄적인 시스템은 일일 거래 전략, 스윙 거래 전략, 지원 및 저항 전략, 캔들스틱 패턴 전략, VWAP 전략, 다중 시간대 추세 전략 등을 포함한 7개 이상의 전략, 10개의 지표 및 다양한 거래 방식을 결합합니다. 이 시스템은 화살표 신호, 진입 및 출구 지점, 거래 경보, 높은 시간대 추세 분석, 실시간 거래 모니터링 및 트렌드 및 볼륨 캔들 색상 제공합니다. 자동 지원 및 저항 감지로 다양한 시장 상황에서 신중한 결정을 돕는 다면적 인 지표입니다. 스마트 서포트 앤 레지스턴스 트레이딩 시스템은 프리미엄 및 강력한 지표 및 도구 모음을 통합한 견고한
RelicusRoad Pro
Relicus LLC
4.78 (139)
이제 $ 147 (몇 가지 업데이트 후 $ 499 증가) - 무제한 계정 (PCS 또는 MACS) RelicusRoad 사용 설명서 + 교육 비디오 + 비공개 Discord 그룹 액세스 + VIP 상태 시장을 보는 새로운 방법 RelicusRoad는 외환, 선물, 암호화폐, 주식 및 지수에 대한 세계에서 가장 강력한 거래 지표로서 거래자에게 수익성을 유지하는 데 필요한 모든 정보와 도구를 제공합니다. 우리는 초보자부터 고급까지 모든 거래자가 성공할 수 있도록 기술적 분석 및 거래 계획을 제공합니다. 미래 시장을 예측할 수 있는 충분한 정보를 제공하는 핵심 거래 지표입니다. 우리는 차트에서 말이 안 되는 여러 지표 대신 완전한 솔루션을 믿습니다. 타의 추종을 불허하는 매우 정확한 신호, 화살표 + 가격 조치 정보를 표시하는 올인원 표시기입니다. 강력한 AI를 기반으로 하는 RelicusRoad는 누락된 정보와 도구를 제공하여 교육하고 성공적인 트레이더인 트레이딩 전문
M1 Arrow
Oleg Rodin
5 (13)
시장의 두 가지 기본 원칙에 기반한 일중 전략. 알고리즘은 추가 필터를 사용하여 거래량 및 가격 파동 분석을 기반으로 합니다. 지표의 지능형 알고리즘은 두 가지 시장 요인이 하나로 결합될 때만 신호를 제공합니다. 지표는 더 높은 시간 프레임의 데이터를 사용하여 M1 차트에서 특정 범위의 파도를 계산합니다. 그리고 파동을 확인하기 위해 지표는 볼륨 분석을 사용합니다. 이 표시기는 준비된 거래 시스템입니다. 트레이더가 필요로 하는 모든 것은 신호를 따르는 것입니다. 또한 지표는 자신의 거래 시스템의 기초가 될 수 있습니다. 거래는 분 차트에서만 수행됩니다. 지표가 MTF 원리를 사용한다는 사실에도 불구하고 지표 알고리즘은 가능한 한 안정적입니다. 구매 후 반드시 저에게 편지를 보내주세요! 내 거래 설정 및 권장 사항을 공유하겠습니다!
ICT, SMC, SMART MONEY CONCEPTS, SMART MONEY, Smart Money Concept, Support and Resistance, Trend Analysis, Price Action, Market Structure, Order Blocks, BOS/CHoCH,   Breaker Blocks ,  Momentum Shift,   Supply&Demand Zone/Order Blocks , Strong Imbalance, HH/LL/HL/LH,    Fair Value Gap, FVG,  Premium  &   Discount   Zones, Fibonacci Retracement, OTE, Buy Side Liquidity, Sell Side Liquidity, BSL/SSL Taken, Equal Highs & Lows, MTF Dashboard, Multiple Time Frame, BigBar, HTF OB, HTF Market Structure, 
제우스 지표 소개: 귀하의 궁극적인 이윤 돌파 거래 도구. 이 지표는 폭발 전략과 심층 분석 필요성을 제거하여 거래를 단순화합니다. 귀하의 설정된 시간 프레임을 기반으로 자동으로 존을 그리고, 스탑 로스 (SL), 테이크 프로핏 (TP) 및 트레일링 스탑 수준을 제안합니다. 제우스 지표는 가격이 매수 또는 매도 진입점에 다가갈 때 즉각 알림을 제공하고 시그널 화살표를 표시합니다. 또한 네 가지 다른 테이크 프로핏 레벨과 다양한 트레일링 스탑 옵션을 권장합니다. 이 도구는 초보자와 숙련된 트레이더 모두에게 적합합니다. 채널 지원: [ 여기를 클릭 ](채널 지원 링크) 상점: 여기를 클릭하세요. MT5 버전: [ 여기를 클릭 ](MT5 버전 링크) 권장 사항: 시간 프레임: M5 또는 M15 통화 쌍: 모든 통화 쌍과 호환 가능 계정 유형: 모든 계정 유형과 호환 가능 권장 스탑 로스: 제우스 지표에서 제공하는 SL 제안 사용 권장 테이크 프로핏 레벨: 제우스 지표에서 제안하는 TP
제작자의 제품 더 보기
나는 당신이 읽을 것을 권합니다       제품의 블로그   (설명서)를 처음부터 끝까지       EA가 제공하는 것은 처음부터 분명합니다. 이 EA(Expert Advisor)의 주요 전략은 3개의 이동 평균(MA)이 연속적으로 정렬되고 서로 일정한 거리에 있을 때 거래를 하는 것입니다(예를 들어 일부 기관 거래자가 사용하는 잘 알려지지 않은 전략에 사용할 수 있음) , D1 시간 프레임의 MA 10, 20 및 30 포함). EA는 H1 및 더 큰 시간 프레임에서 가장 잘 작동합니다. 삼중 MA 전략(어떤 MA가 사용되든 상관없음)은 장기 전략으로 간주되어야 합니다. 나쁜 달이 연속으로 있을 수 있습니다. 따라서 이 EA는 단기간에 빈번한 거래와 지속적인 이익을 찾는 거래자를 위한 것이 아닙니다. 기본 설정은 EURUSD H1에 최적화되어 있습니다(2015.01.01 - 2022.12.29, 224 거래, 이는 주당 평균 0,52 거래를 의미함).   여기에서   신호 모니터링
I recommend you to read the   product's blog  (manual) from start to end so that it is clear from the beginning what the indicactor offers. This multi time frame and multi symbol indicator identifies double or triple top/bottom formations or a following neckline breakout (confirmed top/bottom). It offers filters for RSI overbought/oversold, candle patterns (pin bar, engulfing, tweezer, morning/evening star, three line strike) and divergences (MACD, OsMA, Awesome (AO), RSI, CCI, Stochastic) whic
The indicator identifies when a divergence occurs between price and an indicator or oscillator. It identifies both regular and hidden divergences. Combined with your own rules and techniques, this indicator will allow you to create (or enhance) your own powerful system. Features Can detect divergences for the following oscillators/indicators:   MACD, OsMA, Stochastics, RSI, CCI, RVI, Awesome, ADX, ATR, OBV, Composite index, MFI and Momentum. Only one oscillator/indicator can be selected. Draws
FREE
I recommend you to read the   product's blog  (manual) from start to end so that it is clear from the beginning what the indicactor offers. This multi time frame and multi symbol divergence dashboard indicator sends an alert when one or two different divergences have been identified. It can be used with all time frames from M1 to MN. Maximum 9 time frames can be shown in the dashboard at the same time. It is possible to enable moving average, RSI or Bollinger bands trend filter to filter out on
이 공급 및 수요 영역 표시기는 차트에 영역을 그리고 가격이 영역에 도달하거나 영역을 깨면 경고를 보냅니다. 구역 대신 일반 이중 상단/하단에 대해 경고하는 데 사용할 수도 있습니다. RSI, ADX, 볼륨 및 발산 필터를 사용하여 가장 강력한 설정만 필터링할 수 있습니다. 고유한 규칙 및 기술과 결합하여 이 표시기를 사용하면 자신만의 강력한 시스템을 생성(또는 강화)할 수 있습니다. 이 지표는 이미 공급 수요에 대해 잘 알고 있고 거래를 마감하거나 개설하기로 결정할 때 이를 어떻게 사용할 수 있는지에 대해 이미 잘 알고 있는 경험 많은 거래자를 위한 것입니다. 특징 다음 분기가 지원됩니다.       MACD, OsMA, RSI, CCI, Stochastics 및 Awesome. 구역에는 3가지 색상이 있습니다(입력으로 조정 가능). 테스트되지 않은 영역의 경우 어두운 색상, 테스트된 영역의 경우 중간 색상, 깨진 영역의 경우 밝은 색상. 구역 외경의 가격과 구역 테스트 금액이
Trend dashboard MT5
Jan Flodin
5 (2)
I recommend you to read the   product's blog  (manual) from start to end so that it is clear from the beginning what the indicactor offers. This multi time frame and multi symbol trend indicator sends an alert when a strong trend or trend reversal has been identified. It can do so by selecting to build up the dashboard using Moving average (single or double (both MA:s aligned and price above/below both)), RSI, Bollinger bands, ADX, Composite index (Constance M. Brown), Awesome (Bill Williams), 
This multi time frame and multi symbol indicator scans for pin bars. Combined with your own rules and techniques, this indicator will allow you to create (or enhance) your own powerful system. Features Can monitor all symbols visible in your Market Watch window at the same time. Apply the indicator to just one chart and instantly monitor the entire market. Can monitors every time frame, from M1 to MN, and sends you a real-time alert when a pin bar is identified. All Metatrader native alert types
이 다중 시간 프레임 및 다중 기호 표시기는 다음 5개의 십자가를 식별할 수 있습니다. 빠른 이동 평균이 느린 이동 평균 라인을 교차할 때. 가격이 단일 이동 평균에 도달했을 때(위/아래로 마감 또는 방금 반등). 삼중 이동 평균 형성이 나타날 때(연속 정렬의 모든 3 MA:s) MACD 메인 라인이 신호 라인을 교차할 때. 신호선이 MACD 영(0)선을 교차할 때. 고유한 규칙 및 기술과 결합하여 이 표시기를 사용하면 강력한 시스템을 생성(또는 강화)할 수 있습니다. 특징 Market Watch 창에 표시되는 선택된 기호를 동시에 모니터링할 수 있습니다. 하나의 차트에만 지표를 적용하고 전체 시장을 즉시 모니터링하십시오. M1에서 MN까지 모든 시간 프레임을 모니터링할 수 있으며 크로스오버가 식별되면 실시간 경고를 보냅니다. 모든 경고 유형이 지원됩니다. RSI를 추가 추세 필터로 사용할 수 있습니다. 표시기는 대화형 패널을 포함합니다. 항목을 클릭하면 해당 기호와 기간이 포함된
I recommend you to read the   product's blog  (manual) from start to end so that it is clear from the beginning what the indicactor offers. This multi time frame and multi symbol supply and demand zone dashboard indicator sends alerts when the price has reached a supply/demand zone. It is also possible to use it to be alerted about regular double tops/bottoms instead of zones. It can be used with all time frames from M1 to MN. It is possible to use RSI, divergence (MACD, OsMA, RSI or Awesome) a
Please if possible consider the  paid version  which I will continue to develop (there will be no future updates for this free version). This Expert Advisor identifies when a divergence occurs between price and an oscillator/indicator. It identifies both regular/classical (trend reversal) and hidden (trend continuation) divergences. It has RSI, bollinger, stochastics, moving average and ADX filter options which makes it possible to filter out only the strongest setups. The default settings ar
FREE
강세 및 약세 3선 스트라이크 형성을 찾는 것 외에도 이 다중 기호 및 다중 시간 프레임 표시기는 다음 촛대 패턴을 스캔할 수도 있습니다(패턴 설명은 스크린샷 참조). 백병 3명(역전>연속 패턴) 검은 까마귀 3마리(역전>연속 패턴) 지표 설정의 엄격한 옵션이 활성화된 경우 대형은 더 높은 시간 프레임에 자주 나타나지 않습니다. 그러나 그렇게 할 때 그것은 매우 높은 가능성의 설정입니다. Thomas Bulkowski(국제적으로 알려진 촛대 패턴의 저자이자 선도적인 전문가)에 따르면 Three line strike는 모든 촛대 패턴의 전체 성능 순위가 가장 높습니다. 고유한 규칙 및 기술과 결합하여 이 표시기를 사용하면 강력한 시스템을 생성(또는 강화)할 수 있습니다. 특징 Market Watch 창에 표시되는 모든 기호를 동시에 모니터링할 수 있습니다. 하나의 차트에만 지표를 적용하고 전체 시장을 즉시 모니터링하십시오. M1에서 MN까지 모든 시간 프레임을 모니터링할 수 있으며 패
This indicator can send alerts when a Heiken Ashi Smoothed color change occurs. Combined with your own rules and techniques, this indicator will allow you to create (or enhance) your own powerful system. Features Can send all types of alerts. Option to delay the alert one or more bars in order to confirm the color (trend) change. Input parameters Candle shift for alert: Default is 1. Setting it to 0 will alert you on color change on the current candle. This should be regarded as a pending (uncon
FREE
Averaging down EA
Jan Flodin
5 (1)
This cost averaging Expert advisor (EA) places additional trades in the same direction as the original (manually opened) order when the price goes against you. It can be used as a grid system or as pure martingale system (exponential increasing of lot size) or smoothed martingale (for instance linear increasing of the lot size). Due to the risk involved, this EA is more suitable for intermediate to advanced traders who are well aware of how to handle risk management and trading an already profit
The indicator identifies when a divergence occurs between price and an indicator or oscillator. It identifies bullish and bearish hidden or regular (classical) divergences. Combined with your own rules and techniques, this indicator will allow you to create (or enhance) your own powerful system. Features Can detect divergences for the following indicators/oscillators: MACD, OsMA (Moving average of Oscillator), Stochastics, RSI, CCI, RVI, Awesome (AO), ADX, ATR, OBV, MFI, Momentum and   Composi
FREE
This indicator can send alerts when a Heiken Ashi Smoothed color change occurs. Combined with your own rules and techniques, this indicator will allow you to create (or enhance) your own powerful system. Features Can send all types of alerts. Option to delay the alert one bar in order to confirm the color (trend) change. Input parameters Wait for candle close: 'true' or 'false'. Setting it to 'true' will delay the alert to the opening of the bar following the bar where the color change occurred.
FREE
EA가 제공하는 것이 무엇인지 처음부터 명확하게 알 수 있도록 해당   제품의 블로그   (매뉴얼)를 처음부터 끝까지 읽어 보시기를 권합니다. 이 전문가 조언자는 가격과 오실레이터/지표 사이에 차이가 발생하는 시기를 식별합니다. 이는 일반/고전적(추세 반전) 및 숨겨진(추세 지속) 다이버전스를 모두 식별합니다. 공급/수요 영역, RSI, 볼린저, 확률론, 이동 평균(일반 MA 및 Hull MA), ADX 및 가장 강력한 설정만 필터링할 수 있는 볼륨 필터 옵션이 있습니다. 기본 설정은 EURUSD H1에 최적화되어 있습니다(아래 스크린샷 참조). EA는 하나의 차트에서 여러 기호를 거래할 수 있습니다. 이 옵션은 4가지 방법으로 사용할 수 있습니다. 종합시세 창에 보이는 모든 기호 입력 매개변수에 제공된 기호 대화 상자에서 선택한 사전 설정 파일의 기호 사전 정의된 폴더에 있는 사전 설정 파일의 기호(입력 매개변수로 제공) 옵션 3과 4의 경우 각 사전 설정 파일에서 일부 설정만
이 다중 시간 프레임 및 다중 기호 표시기는 이중 상단/하단, 머리 및 어깨, 페넌트/삼각형 및 플래그 패턴을 식별합니다. 또한 네크라인/삼각형/깃대 이탈이 발생한 경우에만 경고를 설정하는 것도 가능합니다(넥라인 이탈 = 상단/하단 및 헤드&숄더에 대한 확인된 신호).       지표는 단일 차트 모드에서도 사용할 수 있습니다. 이 옵션에 대한 자세한 내용은 제품의       블로그   . 고유한 규칙 및 기술과 결합하여 이 표시기를 사용하면 자신만의 강력한 시스템을 생성(또는 강화)할 수 있습니다. 특징 Market Watch 창에 표시되는 모든 기호를 동시에 모니터링할 수 있습니다. 하나의 차트에만 지표를 적용하고 전체 시장을 즉시 모니터링하십시오. M1에서 MN까지 모든 시간 프레임을 모니터링할 수 있으며 패턴이 식별되거나 중단될 때 실시간 경고를 보냅니다. 모든 Metatrader 기본 경고 유형이 지원됩니다. RSI를 추세 필터로 사용하여 잠재적 반전을 적절히 식별할 수
I recommend you to read the   product's blog  (manual) from start to end so that it is clear from the beginning what the indicactor offers. This multi time frame and multi symbol indicator identifies double or triple top/bottom formations or a following neckline breakout (confirmed top/bottom). It offers RSI, pin bar, engulfing, tweezer, morning/evening star filters as well divergence filter options which makes it possible to filter out only the strongest setups. The indicator can also be used
This indicator recognizes a special type of Inside Bar formation which is formed by a big Master candle followed by 4 smaller candles (please see the strategy explanation below). Features Plots buy/sell stop lines on the chart as well as well as take profit and stop loss levels. The TP/SL levels are based on the Average True Range (ATR) indicator. Object colors are changeable. Sends you a real-time alert when a Master candle formation is identified - sound / popup / email / push notification. On
Divergence dashboard
Jan Flodin
5 (10)
I recommend you to read the   product's blog  (manual) from start to end so that it is clear from the beginning what the indicactor offers. This multi time frame and multi symbol divergence dashboard indicator sends an alert when one or two different divergences have been identified. It can be used with all time frames from M1 to MN. It is possible to enable moving average or RSI trend filter to filter out only the strongest setups. Combined with your own rules and techniques, this indicator wi
Features This is an indicator that recognizes a special type of Inside Bar formation which is formed by a Master candle followed by 4 smaller candles (please see the strategy explanation below). Plots buy/sell stop lines on the chart as well as well as take profit and stop loss levels. The TP/SL levels are based on the Average True Range (ATR) indicator. Object colors are changeable. Sends you a real-time alert when a Master candle formation is identified - sound / pop-up / email / push notifica
I recommend you to read the  product's blog  (manual) from start to end so that it is clear from the beginning what the indicator offers. This multi time frame and multi symbol supply and demand zone dashboard indicator sends alerts when the price has reached a supply/demand zone. It is also possible to use it to be alerted about regular double tops/bottoms instead of zones. It can be used with all time frames from M1 to MN. Maximum 9 time frames can be shown in the dashboard at the same time. 
지표는 가격과 오실레이터/지표 사이에 다이버전스가 발생하는 시점을 식별합니다. 그것은 규칙적인 발산과 숨겨진 발산을 모두 식별합니다. 가장 강력한 설정만 필터링할 수 있는 RSI 필터 옵션이 있습니다. 지표는 또한 Engulfing 대형, Donchian 채널 돌파 또는 가격이 이동 평균을 넘을 때까지 기다릴 수 있는 옵션을 제공합니다   (스크린샷 #3 참조)       거래 기회를 알리기 전에 다이버전스를 확인합니다. 고유한 규칙 및 기술과 결합하여 이 표시기를 사용하면 자신만의 강력한 시스템을 생성(또는 강화)할 수 있습니다. 특징 의 끝에서       제품의 블로그       지표에서 거래 신호를 검색하기 위해 iCustom() 함수를 사용하는 예제 EA(전문가 고문)의 소스 코드를 다운로드할 수 있습니다. EA가 완벽하게 작동하더라도 주요 목적은 코드를 사용하여 자신이 개발한 EA에 붙여넣는 것입니다.   내 제한된 시간을 감안할 때       하지만 프로그래밍 지원은
I recommend you to read the   product's blog  (manual) from start to end so that it is clear from the beginning what the indicactor offers. This multi time frame and multi symbol indicator can identify the following 5 crosses: when a fast moving average crosses a slow moving average line. when price has reached a single moving average (closed above/below or just bounced). when a triple moving average formation has appeared (all 3 MA:s in consecutive alignment). when the MACD main line crosses t
가능하면 구매를 고려하십시오       계속해서 개발할   MT5 버전   입니다(이 MT4 버전에 대한 향후 업데이트는 없을 예정입니다). 나는 또한 당신이 읽을 것을 권장합니다       제품의 블로그   (매뉴얼)를 처음부터 끝까지 검토하여 EA가 제공하는 것을 처음부터 명확하게 합니다. 이 EA(Expert Advisor)의 주요 전략은 3개의 이동 평균(MA)이 연속적으로 정렬되고 서로 일정한 거리에 있을 때 거래를 하는 것입니다(예를 들어 일부 기관 거래자가 사용하는 잘 알려지지 않은 전략에 사용할 수 있음) , D1 시간 프레임의 MA 10, 20 및 30 포함). EA는 H1 및 더 큰 시간 프레임에서 가장 잘 작동합니다. 삼중 MA 전략(어떤 MA가 사용되든 상관없음)은 장기 전략으로 간주되어야 합니다. 나쁜 달이 연속으로 있을 수 있습니다. 따라서 이 EA는 단기간에 빈번한 거래와 지속적인 이익을 찾는 거래자를 위한 것이 아닙니다. 기본 설정은 EURUSD H1에
I recommend you to read the   product's blog  (manual) from start to end so that it is clear from the beginning what the indicactor offers. This indicator for Metatrader 4 identifies when a divergence occurs between price and an oscillator/indicator. It identifies both bullish and bearish divergences. It has a RSI filter option which makes it possible to filter out only the strongest setups. The indicator also offers options to wait for an Engulfing formation, Donchian channel breakout or for p
이 다중 시간 프레임 및 다중 기호 표시기는 핀 막대, 아침/저녁 별, 인글핑, 핀셋, 쓰리 라인 스트라이크, 내부 막대 및 페넌트 및 삼각형을 스캔합니다.   지표는 단일 차트 모드에서도 사용할 수 있습니다. 이 옵션에 대한 자세한 내용은 제품의       블로그   .       고유한 규칙 및 기술과 결합하여 이 표시기를 사용하면 자신만의 강력한 시스템을 생성(또는 강화)할 수 있습니다. 특징 Market Watch 창에 표시되는 모든 기호를 동시에 모니터링할 수 있습니다. 하나의 차트에만 지표를 적용하고 전체 시장을 즉시 모니터링하십시오. M1에서 MN까지 모든 시간대를 모니터링하고 패턴이 식별되면 실시간 경고(팝업, 푸시 또는 메일)를 보냅니다. RSI 및 볼린저 밴드를 핀 바, 아침/저녁 별   , 인글프잉 및 핀셋 형성   에 대한 필터로 사용하여 잠재적 반전을 적절하게 식별할 수 있습니다. 이동 평균을 주요 추세 필터로 사용하고 ADX를 변동성 필터로 사용할 수 있습
This multi time frame and multi symbol indicator scans for Pin bars, Morning/Evening stars, Engulfings, Tweezers, Three line strikes, Inside bars and Pennants and Triangles. The indicator can also be used in single chart mode. Please read more about this option in the product's blog . Combined with your own rules and techniques, this indicator will allow you to create (or enhance) your own powerful system. Features Can monitor all symbols visible in your Market Watch window at the same time. Ap
This multi time frame and multi symbol indicator identifies when the stochastics signal line (D) crosses the stochastics main line (K) as well as options  to scan for main line and signal line level crossovers.  As a bonus it can also scan for Bollinger bands and RSI overbought/oversold crosses. Combined with your own rules and techniques, this indicator will allow you to create (or enhance) your own powerful system. Features Can monitor all symbols visible in your Market Watch window at the sam
This multi indicator/oscillator (hereafter indicator), multi time frame and multi symbol indicator identifies when a divergence occurs between price and one, two or three indicators. It identifies both regular/classical (trend reversal) and hidden (trend continuation) divergences. It has RSI and MA trend filter options which makes it possible to filter out only the strongest setups. Combined with your own rules and techniques, this indicator will allow you to create (or enhance) your own powerfu
필터:
yamez
202
yamez 2023.01.29 04:08 
 

I've had this indicator for some time. Great for confirming reversals on lower TF, with higher TF confluences. Don't just take the signals as is. Saves me a lot of screen time.

Suvashish Halder
12329
Suvashish Halder 2021.10.15 20:53 
 

A++ Rated Scanner

viamal777
378
viamal777 2020.09.30 22:04 
 

This is the only scanner that actually works. And this is the developer that considers your requests to make it even better.

suresh2425
236
suresh2425 2020.06.15 04:26 
 

Product is ok but. No filter (divergence) for double top and bottom.

mengswee
40
mengswee 2020.06.06 14:11 
 

Excellent Product, Excellent Service!

Aravind Kolanupaka
8820
Aravind Kolanupaka 2020.05.09 18:06 
 

Good

리뷰 답변
버전 2.5 2023.11.27
*** Please always make a backup of the existing indicator (the .ex4 file) before you make an update ***

Change log:
- added a moving average (MA) trend filter which can be enabled for top/bottoms, head & shoulders and flags
버전 2.4 2023.10.13
*** Please always make a backup of the existing indicator (the .ex4 file) before you make an update ***

Change log:
- added an option to write the signals as global variables instead of to a file (to be used by an EA)
- bug fix
버전 2.3 2023.06.02
*** Please always make a backup of the existing indicator (the .ex4 file) before you make an update ***

This is not a mandatory update if you don't want to use the RSI filter with another time frame.

Change log:
- added an option to select the time frame for the RSI filter
버전 2.2 2022.01.14
*** Please always make a backup of the existing indicator (the .ex4 file) before you make an update ***

This is not a mandatory update if your broker is not using the "-" (minus) character in the symbol names.
버전 2.1 2022.01.11
*** Please always make a backup of the existing indicator (the .ex4 file) before you make an update ***

- added support for "-" (minus) characters in symbol names (Oanda core price account etc.)
버전 2.0 2021.12.15
*** Please always make a backup of the existing indicator (the .ex4 file) before you make an update ***

- added the possibility to work with flag (pole) breakouts
- added a possibility to use the indicator in single chart mode (checking only one symbol and time frame). It will then draw the patterns on the chart where the indicator is running. This option is in some ways limited though. More information in the prroduct's blog.
- corrected a bug regarding the drawing of some of the pattern lines in the strategy tester
- added drawing of breakout arrows
버전 1.9 2021.10.15
*** Please always make a backup of the existing indicator (the .ex4 file) before you make an update ***

- added the possibility to use the ATR indicator (period 14) instead of points for calculating the offset. For this reason I have removed the option to use separate point values since ATR will basically do the same work.
- added the possibility to set a custom panel title
버전 1.8 2020.09.30
*** Please always make a backup copy of the existing indicator (the .ex4 file) before you make the update ***

This is not a mandatory update if you are not experiencing problems at the moment.

- minor bug fix
버전 1.7 2020.09.02
*** Please always make a backup copy of the existing indicator (the .ex4 file) before you make the update ***

- added a possibility to work with pennant and triangles break-outs
버전 1.6 2020.06.04
- fixed an issue with lines sometimes not beeing drawn correctly for top/bottom break-outs
버전 1.5 2020.03.05
- added a possibility to set signal time offset in hours. This is the time which appears as first information in the panel, prior to the symbol name.
버전 1.4 2020.01.24
*** Please always make a backup of the existing indicator (the .ex4 file) before you make the update ***
- added scanning for flag patterns (beta version)
버전 1.3 2020.01.21
*** Please always make a backup of the existing EA (the .ex4 file) before you make the update ***
Non mandatory update. Changes:
- the alert text for the email alert is now in the body of the email alerts instead of in the subject
버전 1.2 2020.01.13
- added the possibility to insert a custom text to the pop-up (on-screen) alert
- added the signal price and time (right shoulder) to the end of the alert text for Head and Shoulder alerts
버전 1.1 2019.12.25
- added a possibility to set that the extremum prior to the left shoulder must be higher/lower than the left neckline point. Please see screenshot #3 for explanation.
- added a possibility to disable repeated alerts in case the right shoulder gets extended (repainted).