RSI Panel Pro MTF

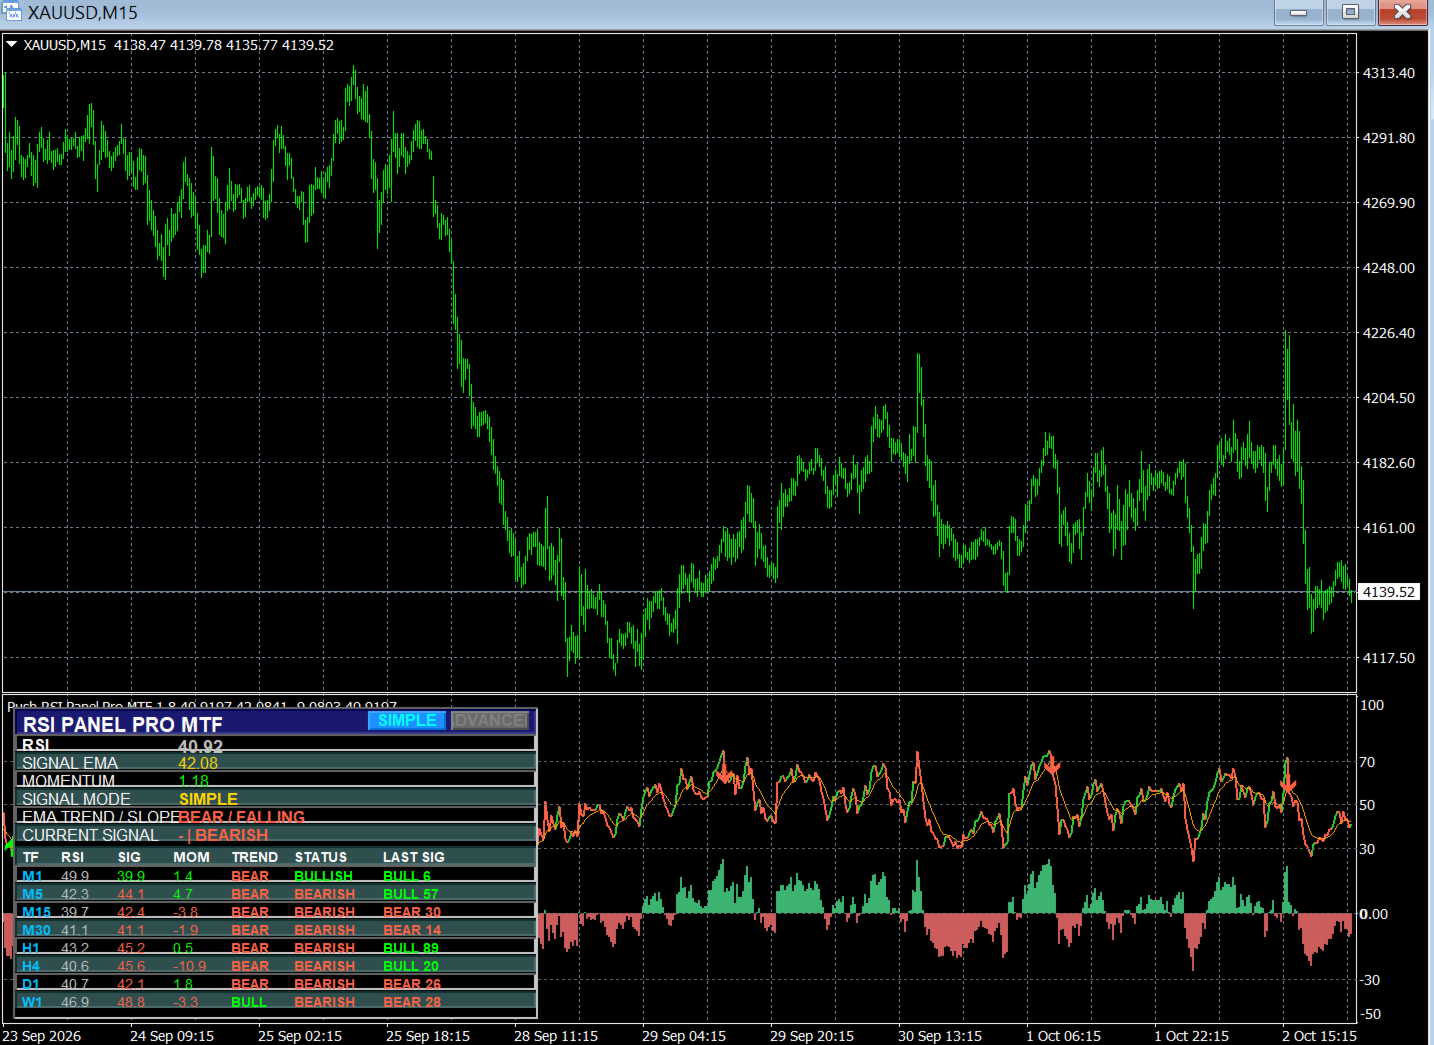
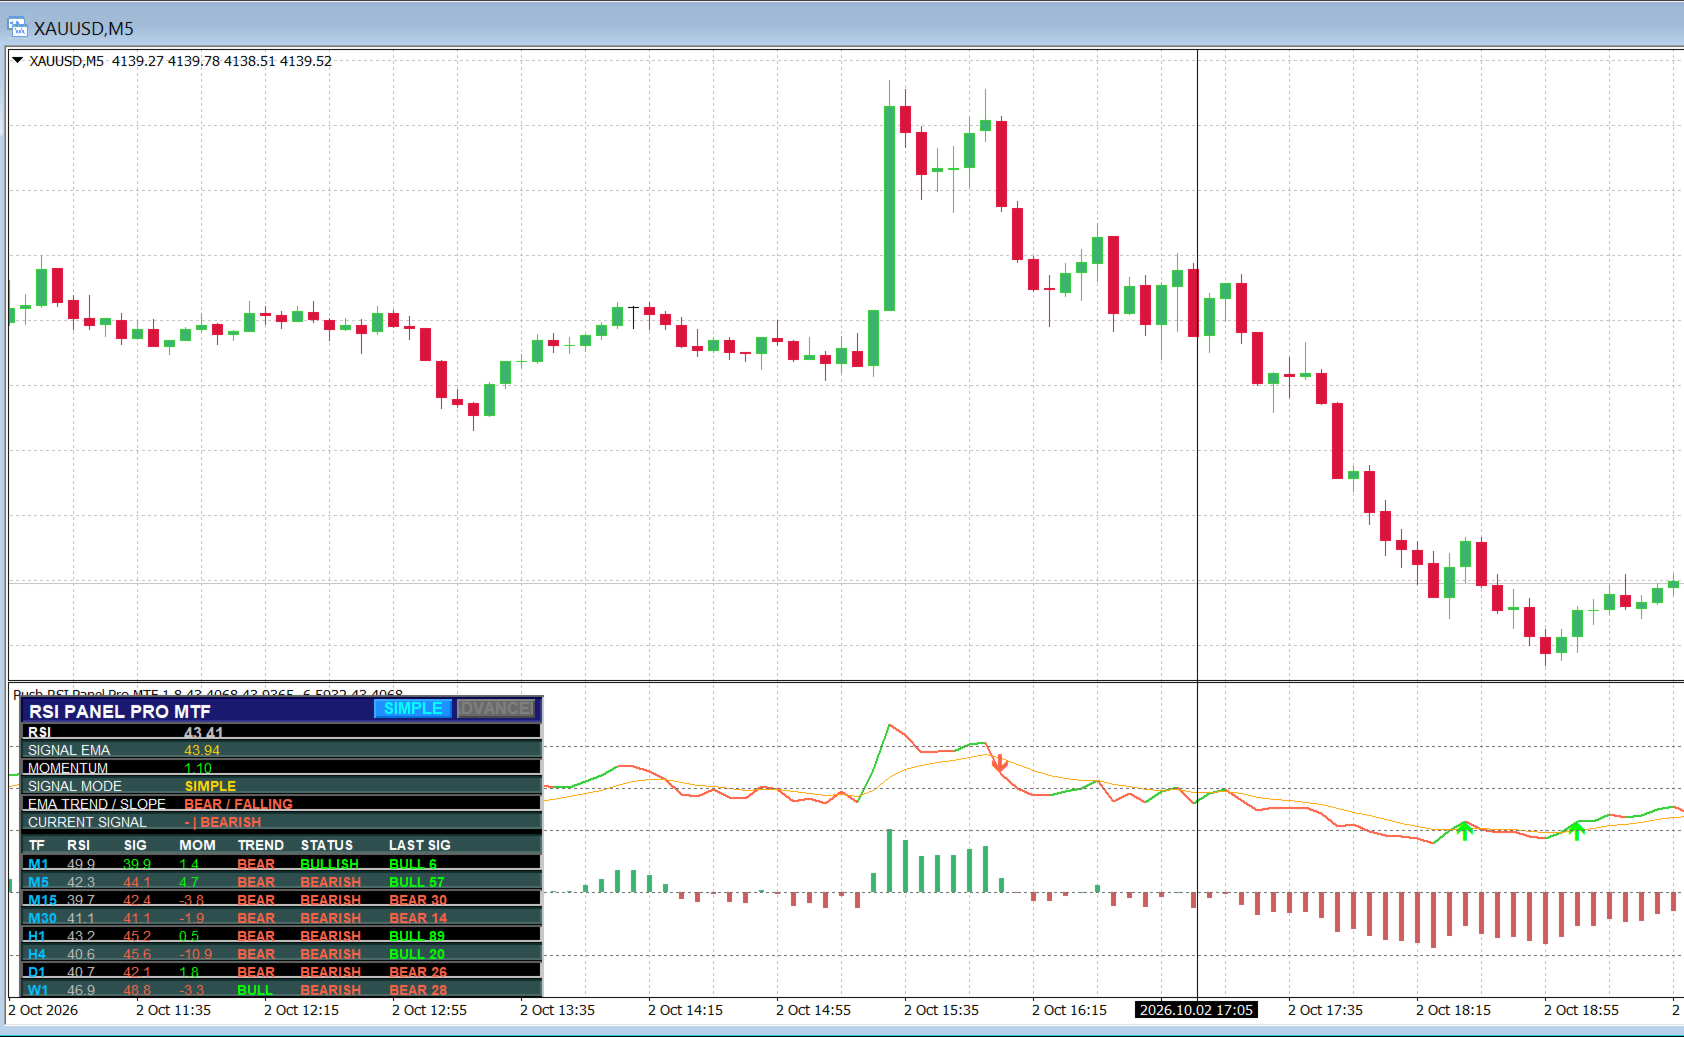
RSI Panel Pro is a multi-timeframe RSI indicator for MetaTrader 5 that combines the traditional RSI, RSI EMA Signal, Momentum, an EMA trend filter, and an MTF summary panel. Its goal is to provide a quick overview of momentum, RSI levels, multi-timeframe trends, and the latest signals without the need to constantly switch between timeframes.
This indicator is best suited as a tool for signal confirmation and market context filtering; a single RSI signal should not be used as the sole basis for entering a trade.
RSI Panel Pro is most effective when used as a multi-timeframe confirmation dashboard, rather than a "follow-the-arrow" entry system.
Two Signal Modes
SIMPLE mode
SIMPLE is the default mode. It is suitable for catching RSI pullbacks or reversals early.
When to use Simple:
Short-term trading (M1–M15).
Scalping or catching pullbacks within a range.
When you want earlier signals.
When you already have a trend filter in place, such as an EMA on the price chart, market structure analysis, or support/resistance levels.
Risks of Simple:
Generates more signals than Advanced mode.
Prone to false signals in choppy, sideways markets.
Risk of entering against the major trend if higher timeframes (H1/H4/D1) are not checked.
ADVANCED mode
ADVANCED incorporates all conditions from Simple mode and adds an extra filter.
When to use Advanced:
Trend trading.
Swing trading (M15–H4).
When you want fewer signals but higher-quality confirmation.
Trading Gold, indices, crypto, or highly volatile pairs.
When you want to avoid entering trades against the 200 EMA.
The SIMPLE and ADVANCED buttons in the panel header allow you to switch modes directly on the chart. When a button glows blue, that mode is currently active. Suggested Combinations:
RSI Panel Pro performs better when combined with:
Support/Resistance: Only take Bull signals near support and Bear signals near resistance.
EMA 50/200 on the price chart: To identify trend structure.
ATR: To set stop-loss and take-profit levels based on volatility.
Market Structure: HH/HL for uptrends, LH/LL for downtrends.
Volume or session filters: To avoid entering trades during periods of low liquidity.
Price Action: Engulfing patterns, rejection candles, breakout-retest setups.
###: Risk Management
The indicator does not calculate stop-loss, position size, or drawdown. You still need independent capital management rules:
Risk per trade: Approximately 0.5–1% of the account balance.
Do not increase lot size simply because multiple timeframes are in agreement.
Do not re-enter immediately after a loss if the market structure has not changed.
Always determine the stop-loss level before entering a trade.
Do not move the stop-loss further away just to "wait for the RSI to turn back."
Avoid opening trades during high-impact news events, periods of widened spreads, or low-liquidity sessions.
Evaluate performance based on a series of at least 50–100 trades, rather than just a few winning or losing trades.