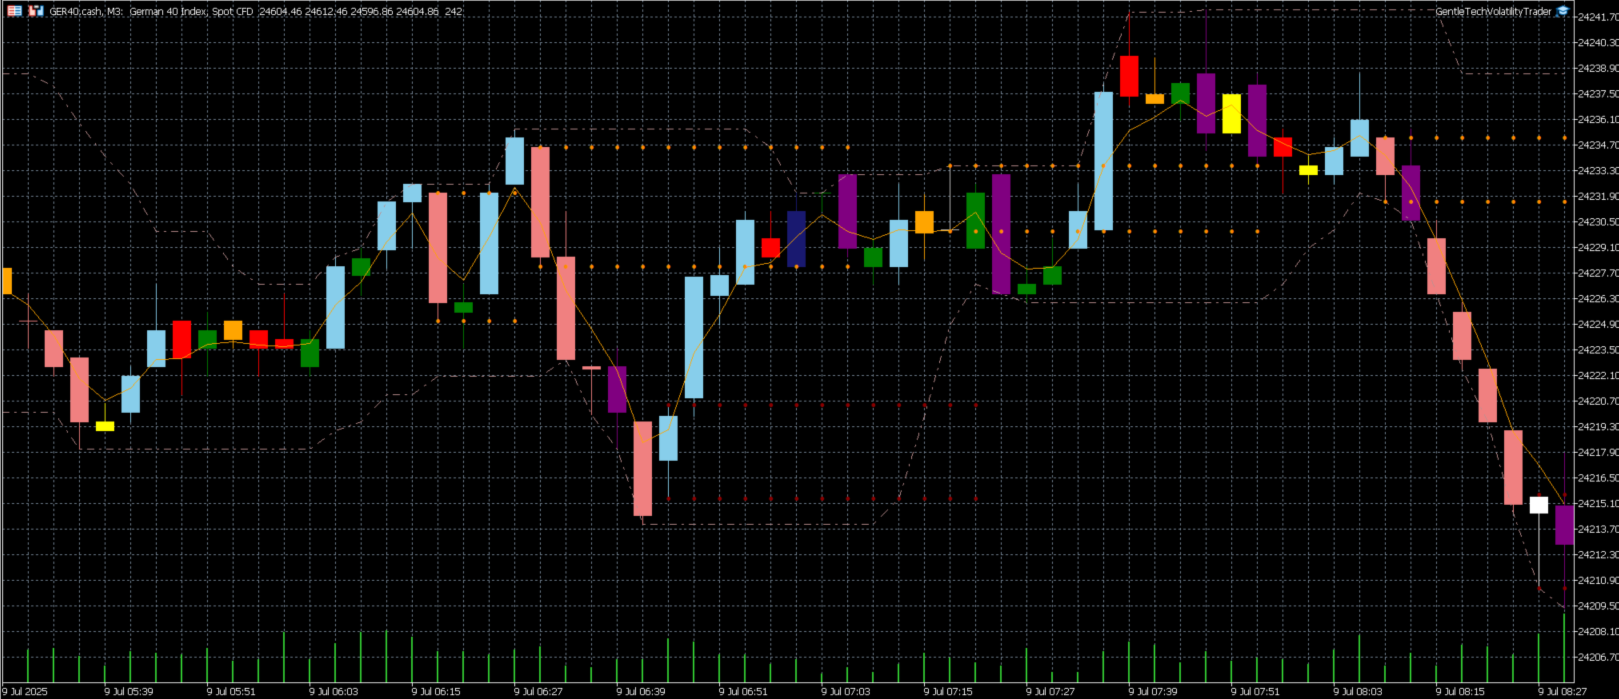
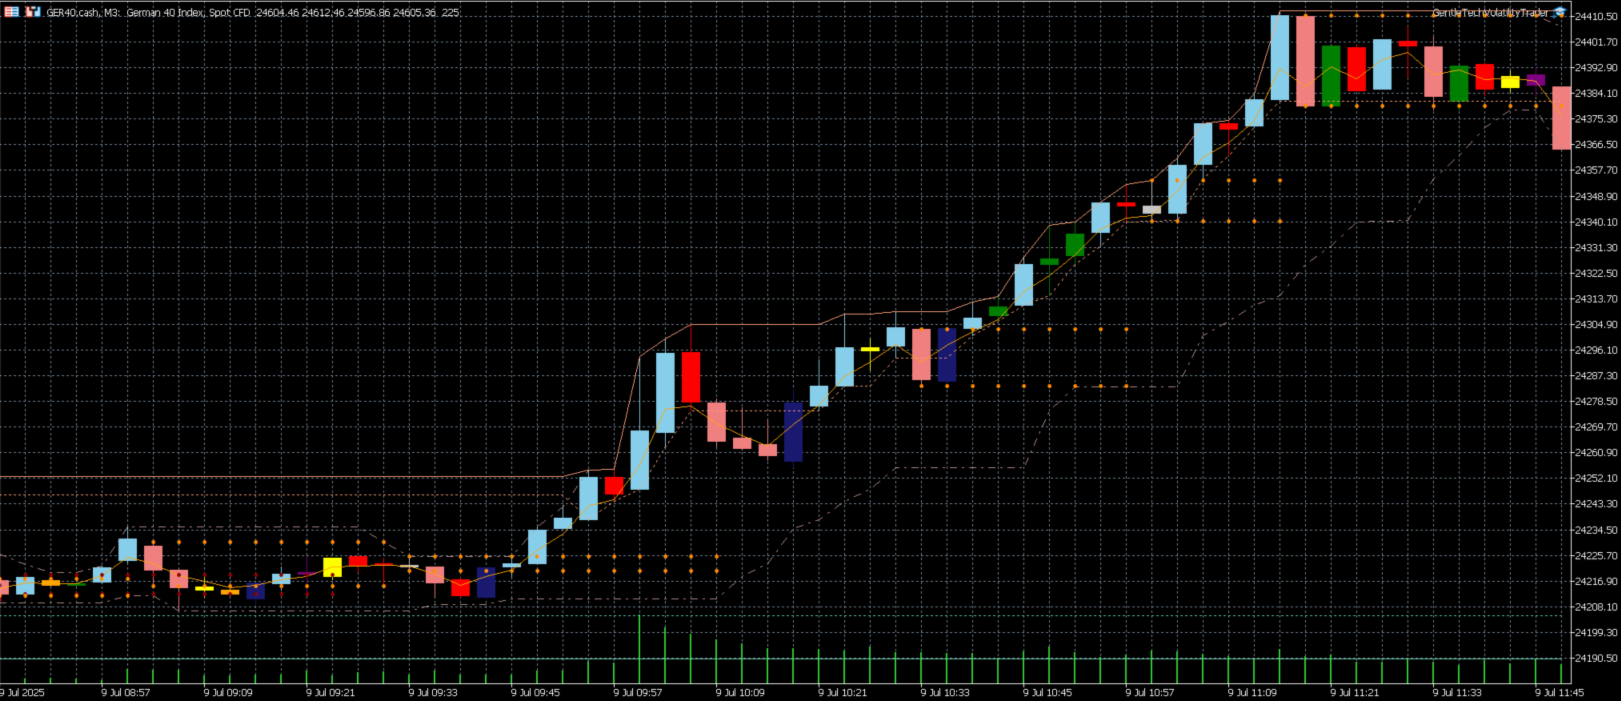
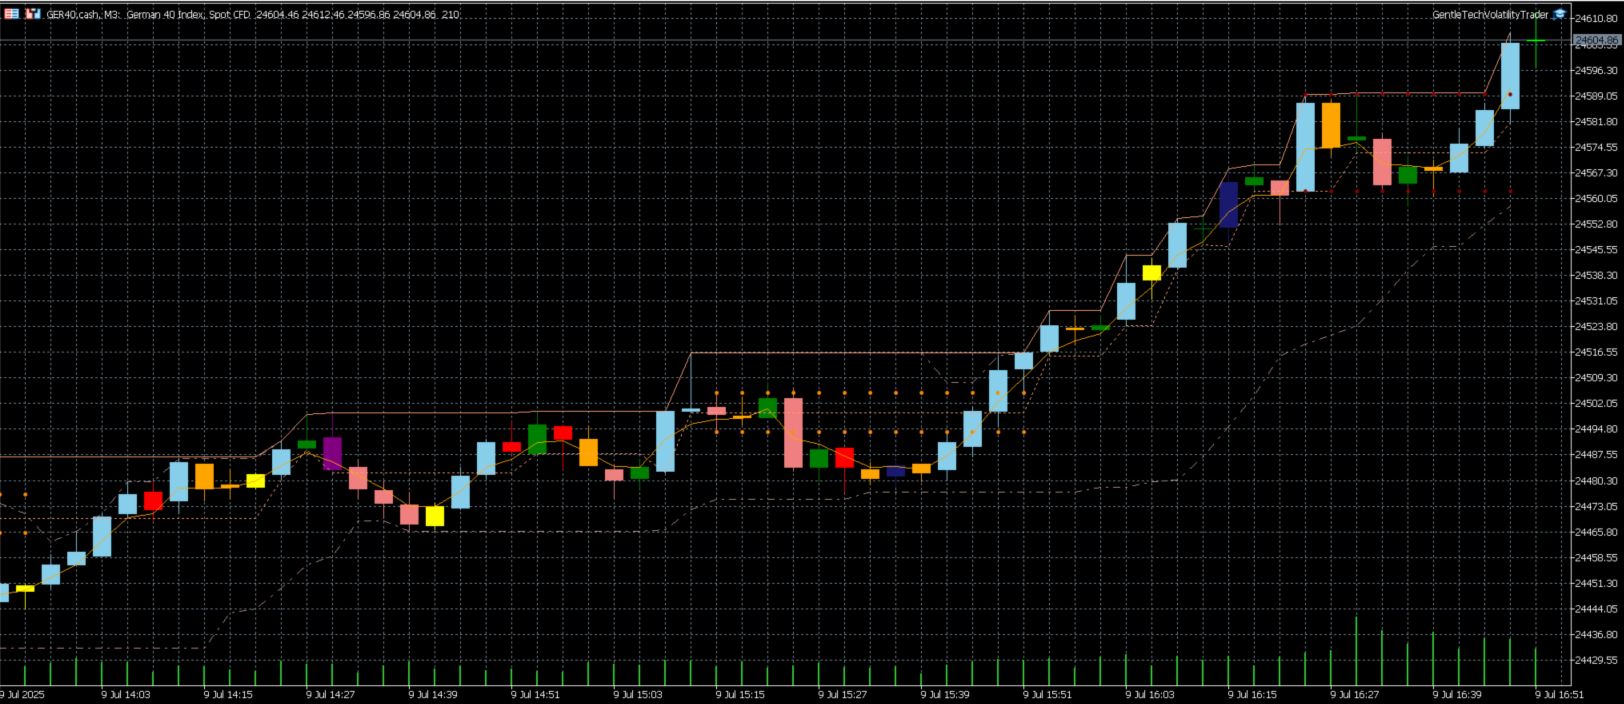
Key Candlepatterns

Key Candlepatterns

Platform: MetaTrader 5
Type: Custom Indicator
Display: Chart Window (Candlestick Overlay)

Functions:

  • Detects and color-codes specific candlestick patterns based on candle shape, relative position, and ATR filters.

  • Candles receive distinct colors depending on type (e.g. inside bar, outside bar, engulfing, hammer, shooting star, etc.).

  • Visual patterns can help traders identify where buyers or sellers are likely active.

  • Turning points (e.g., hammer followed by confirmation) are highlighted with arrows.

  • Includes support/resistance zones, ATR, EMA, and high/low ranges.

  • Outputs multiple buffers:

    • Candlestick color classification

    • ATR and true range

    • Local highs/lows (support and resistance)

    • Turning point markers

    • Trigger strength signals

Input Parameters:

  • TurningPointLookback (default: 14)
    Number of candles used to check for repeat confirmation of key candles (double signals).

  • AtrPeriod (default: 5)
    Period for average true range used to validate volatility.

How It Works:

  • Candles are classified by structure (e.g., inside bar, engulfing, hammer).

  • Each type is assigned a specific color for visual recognition.

  • A sequence of key candles can form recognizable patterns that signal buyer or seller pressure.

  • The system tracks recent turning points and shows arrows when a reversal is likely.

  • Helps traders identify localized support/resistance and behavioral shifts in price action.


추천 제품
Phantom Edge SMC
Nattapon Chuekamhod
Phantom Edge SMC — The Ultimate Smart Money Indicator for MT5 Tired of manually drawing structures while trading SMC or ICT concepts? Let Phantom Edge SMC do the heavy lifting for you. Key Features Internal & Swing Structure: Automatically detects BOS and CHoCH across two structural levels. Order Blocks (OB): Identifies Internal and Swing OBs with automated mitigation tracking. Equal Highs / Lows: Highlights EQH / EQL to pinpoint Liquidity pools. Fair Value Gaps (FVG): Displays FVGs with
A Média Móvel é um indicador que faz parte da Análise Técnica. Com ela, é possível identificar o equilíbrio dos preços no mercado, observando tendências de alta, neutra ou baixa. Este indicador customizado traz opções extras pera definir o método de cálculo podendo-se esclolher entre SMA,EMA,SSMA,LWMA,JJMA,JurX,ParMA,T3,Vidya,AMA,HULL MA. Também conta com varias opções para escolher o método de cálculo para o preço base a ser usado no cáculo da média.
Weis Wave Scouter
Jean Carlos Martins Roso
Weis Wave Scouter는 MetaTrader 5용으로 개발된 혁신적인 지표로, Wyckoff 방법론과 VSA(Volume Spread Analysis)의 검증된 원칙을 결합했습니다. 높은 정확성과 깊이 있는 분석을 원하는 트레이더를 위해 설계되었으며, 누적 거래량 파동 분석을 통해 시장을 전술적으로 읽고 추세 반전 및 지속의 핵심 포인트를 식별하는 데 도움을 줍니다. 이 지표는 선명한 시각적 인터페이스를 제공하며, Classic, NightVision, OceanBreeze 등 다양한 테마의 사용자 지정 가능한 색상 히스토그램을 통해 상승 및 하락 파동을 시각화합니다. 주요 기능에는 거래량 급증 감지, 낮은 활동 영역(DeadZone) 식별, 거래량 기반 파동 반전 경고 설정이 포함되어 있습니다. 또한 노력 대비 결과 분석, 원인과 결과 분석, 수요와 공급 분석 등 Wyckoff 및 VSA 이론의 핵심 요소를 지원합니다. Brick Size, Volume Scale Fact
RBreaker
Zhong Long Wu
RBreaker Gold Indicators는 금 선물을 위한 단기 데이 트레이딩 전략으로, 추세 추종과 데이 내 반전의 두 가지 거래 방식을 결합합니다. 추세 장에서 수익을 포착할 수 있을 뿐만 아니라, 시장이 반전될 때 적시에 이익을 확정하고 추세에 맞춰 반대 포지션을 잡을 수 있습니다. 이 전략은 미국 잡지 Futures Truth에서 15년 연속으로 가장 수익성 높은 트레이딩 전략 상위 10위 안에 선정되었습니다. 긴 라이프사이클을 자랑하며, 현재까지 국내외에서 널리 사용되고 연구되고 있습니다. 본 지표는 2026년 금 선물의 움직임을 반영하여 14일 ATR 지표를 기반으로 돌파 계수 A, 관찰 계수 B, 반전 계수 R을 보다 합리적인 값으로 정의했습니다. 매우 훌륭한 지표이며, 안정적인 연간 수익성을 달성했습니다. 강력히 추천합니다~ 위 지표는 변동성이 높은 상품에 적합하며, 매개변수는 금 선물, 주가 지수 선물 등에 적합합니다. 다른 상품이 필요한 경우 돌파 계수 A
Daily Volume Profile - See Where Smart Money Trades Stop guessing support and resistance. Start seeing where REAL volume is. The Daily Volume Profile indicator reveals the hidden structure of the market by showing exactly where trading activity concentrates at each price level. While most traders use lagging indicators, you'll see where institutional money positions itself - BEFORE the move happens. What You Get: → POC (Point of Control) - The most powerful S/R level of each day, shown as a cle
The Super Arrow Indicator provides non-repainting buy and sell signals with exceptional accuracy. Key Features No repainting – confirmed signals remain fixed Clear visual arrows: green for buy, red for sell Real-time alerts via pop-up, sound, and optional email Clean chart view with no unnecessary clutter Works on all markets: Forex, gold, oil, indices, crypto Adjustable Parameters TimeFrame Default:   "current time frame" Function:   Sets the time frame for indicator calculation Options:   Can
Hello I Want to introduce The Forex Buy Sell Arrow Premium MT5 i recently release this premium indicator! its 1000% Non Repaint Indicator, It Work Perfectly Well,, i tested it day by day, Just mind blowing Result,  Including Powerful trend Algorithm! How It Work? well, it work market trend formula, when trend Bullish Or when trend Bearish,  Recommend Timeframe M30, H1 it work all timeframe, and all currency pair, 100% non repaint, How to take signal From Forex Buy Sell Arrow Premium Ind
Blahtech Market Profile MT5
Blahtech Limited
5 (10)
Was: $249  Now: $99   Market Profile defines a number of day types that can help the trader to determine market behaviour. A key feature is the Value Area, representing the range of price action where 70% of trading took place. Understanding the Value Area can give traders valuable insight into market direction and establish the higher odds trade. It is an excellent addition to any system you may be using. Inspired by Jim Dalton’s book “Mind Over Markets”, this indicator is designed to suit the
Trade smarter, not harder: Empower your trading with Harmonacci Patterns This is arguably the most complete harmonic price formation auto-recognition indicator you can find for the MetaTrader Platform. It detects 19 different patterns, takes fibonacci projections as seriously as you do, displays the Potential Reversal Zone (PRZ) and finds suitable stop-loss and take-profit levels. [ Installation Guide | Update Guide | Troubleshooting | FAQ | All Products ] It detects 19 different harmonic pri
Premium level Pro
Dmitriy Kashevich
Premium level is a unique indicator with more than 80% accuracy of correct predictions! This indicator has been tested for more than two months by the best Trading Specialists! The author's indicator you will not find anywhere else! From the screenshots you can see for yourself the accuracy of this tool! 1 is great for trading binary options with an expiration time of 1 candle. 2 works on all currency pairs, stocks, commodities, cryptocurrencies Instructions: As soon as the red arrow app
SkyScraperMT5
Teressa Herlene Thomson
Overview SkyScraper is a sophisticated automated trading system built exclusively for MetaTrader 5. This versatile EA adapts to your trading style on any timeframe (optimized for 3-5 minute charts) and works seamlessly across forex pairs, cryptocurrencies, and metals including gold. Why SkyScraper? Smart Automation That Protects Your Capital Intelligent trade execution with multi-layer risk controls Dynamic position sizing that automatically adjusts to your broker's requirements Adaptive stop l
Order Book, known also as Market Book, market depth, Level 2, - is a dynamically updated table with current volumes of orders to buy and to sell specific financial instument at price levels near Bid and Ask. MetaTrader 5 provides the means for receiving market book from your broker, but in real time only, without access to its history. The indicator OrderBook Cumulative Indicator accumulates market book data online and visualizes them on the chart. In addition, the indicator can show the market
Prizmal Logic
Vladimir Lekhovitser
5 (1)
실시간 거래 신호 거래 활동의 공개 실시간 모니터링: https://www.mql5.com/ko/signals/2353471 공식 정보 판매자 프로필 공식 채널 사용자 매뉴얼 설정 안내 및 사용 지침: 사용자 매뉴얼 열기 이 전문가 어드바이저는 규칙 기반 거래 전략에 기반하여 설계되었습니다. 이 전략은 시장에 지속적으로 노출되기보다는 특정 시장 조건을 식별하는 데 초점을 둡니다. 시스템은 가격 움직임, 변동성 특성 및 시간 요소를 분석합니다. 이 요소들은 현재 시장 환경이 거래 참여에 적합한지 판단하는 데 사용됩니다. 여러 사전 정의된 기준이 동시에 충족될 때만 거래가 실행됩니다. 조건이 충족되지 않으면 전문가 어드바이저는 비활성 상태를 유지합니다. 그 결과 거래 활동은 일정하지 않습니다. 거래가 전혀 발생하지 않는 기간이 있을 수 있습니다. 이는 포지션이 전혀 없는 하루 전체를 포함할 수 있습니다. 반대로 적절한 시장 국면에서는 비교적 짧은 시간에 여러 거
SMC Venom Model BPR 지표는 Smart Money(SMC) 개념 내에서 일하는 트레이더를 위한 전문 도구입니다. 가격 차트에서 두 가지 주요 패턴을 자동으로 식별합니다. FVG (공정 가치 갭)는 3개의 캔들의 조합으로, 첫 번째와 세 번째 캔들 사이에 갭이 있습니다. 이는 볼륨 지원이 없는 레벨 사이에 구역을 형성하여 종종 가격 수정으로 이어집니다. BPR (균형 가격 범위)은 두 개의 FVG 패턴의 조합으로, "브리지"를 형성합니다. 이는 가격이 낮은 볼륨 활동으로 움직일 때 브레이크아웃과 레벨로의 복귀 구역으로, 캔들 사이에 갭을 생성합니다. 이러한 패턴은 거래자가 차트에서 거래량과 가격 역학을 분석하여 주요 지지/저항 수준, 돌파 구역 및 진입 지점을 식별하는 데 도움이 되며, 여기서 대형 시장 참여자와 일반 참여자 간의 상호 작용이 발생합니다. 이 지표는 사각형과 화살표 형태로 패턴을 시각화하며 유연한 경고 설정도 지원합니다. 주요 특징: 패턴 표시 모드
"Impulses and Corrections 5" is created to help traders navigate the market situation. The indicator shows multi-time frame upward and downward "Impulses" of price movements. These impulses are the basis for determining the "Base" , which is composed of zones of corrections of price movements, as well as "Potential" zones for possible scenarios of price movement. Up and down impulses are determined based on a modified formula of Bill Williams' "Fractals" indicator. The last impulse is always "U
Cycles Forecast
Pooriya Alirezaee
This indicator is based on a mathematical formula and an ANN combined, designed to make a model(using previous prices) of the most recent market condition (any chart*) in order to use the model as a forecasting tool. *This indicator can operate on any chart/timeframe, but it's suggested you use multiple timeframes for each trade because this method relies solely on the time factor, you can not use this indicator to predict price volatility, but if it's fit correctly it will show you when the nex
Axiom Point
Tatiana Savkevych
Axiom Point — Precision Structural Breakout Indicator Axiom Point is a high-performance analytical indicator designed to identify high-probability reversal zones using price-action behaviour and adaptive balance filtering. The indicator applies a multi-layer analytical model to detect moments when price transitions beyond its normal equilibrium area, indicating a potential shift in market momentum. Unlike conventional trend-following tools, Axiom Point focuses on so-called points of no return —
Monthly Levels Pro
N'da Lemissa Kouame
ENGLISH – Monthly Levels Pro v1.0 The Ultimate Monthly Market Levels Indicator Master key market zones at a glance. Monthly Levels Pro helps you analyze long-term trends and spot essential support and resistance levels by automatically displaying the High, Low, Open, and Close of a monthly candle. Why Choose Monthly Levels Pro? Instant Analysis – See monthly levels immediately without checking candles manually. Smarter Trading – Spot reversal or breakout zones at a glance. Clear Visuals –
Your Trend Friend
Luigi Nunes Labigalini
5 (1)
The trend is your friend! Look at the color of the indicator and trade on that direction. It does not  repaint. After each candle is closed, that's the color of the trend. You can focus on shorter faster trends or major trends, just test what's most suitable for the symbol and timeframe you trade. Simply change the "Length" parameter and the indicator will automatically adapt. You can also change the color, thickness and style of the lines. Download and give it a try! There are big movements w
ZigZag SMC Premium MT5
Kallebe Lins De Oliveira Santos
If you are looking for precision in identifying strategic tops and bottoms, the ZigZag SMC/SMT Indicator for MT5 is the tool that will contribute to your technical analysis. Developed based on the advanced concepts of Smart Money Concepts (SMC) and Smart Money Trap (SMT), it offers an insight into market behavior, helping you make decisions. What will you find in this indicator? Automatic identification of strategic tops and bottoms Based on institutional strategies Ideal for analyzing liqu
##   ONLY GOLD ##   Тiльки Золото ## **Mercaria Professional Trading Zones - Complete Guide** ## **Mercaria Professional Trading Zones - Повний посібник** ### **How Mercaria Zones Work / Як працюють зони Mercaria** **English:** Mercaria Zones is an advanced trading indicator that identifies high-probability support and resistance areas using ZigZag extremes combined with mathematical zone calculations. The indicator works on multiple timeframes simultaneously, providing a comprehensive view
Wave Trend MT5
Diego Arribas Lopez
MT4 Version Wave Trend MT5 Wave Trend is an oscillator, which helps identifing in a extremely accurate manner market reversals. The Oscillator being obove the overbought level and a cross down of the fast into the slow MA usually indicates a good SELL signal. If the oscillators is below the oversold level and the fast MA crosses over the slower MA usually highlights a good BUY signal. The Wave Trend indicator can be also used when divergences appear against the price, indicating the current move
Maximum Trend Arrows OT MT5
Mulweli Valdaz Makulana
STRICTLY FOR BOOM INDEX ONLY!!!!! Here I bring the Maximum Trend Arrows OT1.0 MT5 indicator. This indicator is made up of a combination of different trend indicators for entries and exits, for entries an orange arrow will paint on the chart below the current market and a red flag for closing of trades and it produces buy arrows only. When the orange arrow appears, it will appear along with it's sound to notify you. The 1H timeframe is recommended, don't use it anywhere else than on the 1H timefr
Description CAP Channel & Hull Moving Average Crossing Strategy is a powerful and smart trading indicator designed to identify high-probability market reversals and trend-based entry points . This indicator combines the strength of the CAP Channel and the Hull Moving Average (HMA) to detect price overextension and confirmation-based reversals . When price moves outside the CAP Channel and then returns inside with Hull MA confirmation, the indicator generates accurate BUY and SELL signals . Core
Terra Infinity
Ivan Simonika
Terra Infinity is a flat indicator. This improved version of the CalcFlat indicator has three additional lines that significantly increase its effectiveness. Unlike its predecessor with two static levels, Terra Infinity adds three dynamic lines above the main histogram, which are interpreted as follows: base signal line, minimum signal line, maximum signal line. These lines are formed using the additional parameter Avg, which is the average value of the histogram. Averaging produces a line cl
CosmiCLab FIBO
Kirils Subins
CosmiCLab SMC FIBO CosmiCLab SMC FIBO is a professional trading indicator designed for traders who use Smart Money Concepts (SMC), market structure analysis and Fibonacci retracement levels. The indicator automatically detects market swings and builds Fibonacci levels based on the latest impulse movement. It also identifies market structure changes such as BOS (Break of Structure) and CHOCH (Change of Character), helping traders understand the current market direction. CosmiCLab SMC FIBO also pr
Heiken Ashi Supertrend Combine
Tri Yasin Satrio Adji Pranoto
Headline: Stop Guessing, Start Winning. Unleash the Power of the Heiken Ashi Supertrend Indicator. Body: Are you tired of market noise, confusing charts, and missed opportunities? The Heiken Ashi Supertrend Indicator is the ultimate tool designed to bring clarity and confidence to your trading, once and for all. We've combined two of the most powerful concepts in technical analysis into one seamless, easy-to-use indicator: Crystal-Clear Trends with Heiken Ashi: Say goodbye to choppy price action
지표에 대하여 이 지표는 금융 상품의 종가에 대한 몬테카를로 시뮬레이션을 기반으로 합니다. 몬테카를로는 통계적 기법으로, 이전에 관찰된 결과에 기반한 랜덤 숫자를 사용하여 다양한 결과가 나올 확률을 모델링하는 데 사용됩니다. 어떻게 작동하나요? 이 지표는 과거 데이터를 바탕으로 시간에 따른 랜덤 가격 변화를 모델링하여 특정 종목에 대한 여러 가격 시나리오를 생성합니다. 각 시뮬레이션은 종가 변동을 반영하기 위해 랜덤 변수를 사용하여, 주어진 기간 동안 미래 시장 움직임을 효과적으로 모방합니다. 몬테카를로 시뮬레이션의 장점 - 몬테카를로 시뮬레이션은 다양한 미래 시나리오에 대한 테스트를 통해 여러 거래 전략의 리스크를 분석하는 데 도움을 줍니다. - 희귀한 극단적 사건(꼬리 위험)을 포함하여 다양한 시장 상황에서 전략의 성과를 확인할 수 있습니다. - 단일 예측에 의존하지 않고, 몬테카를로는 관련 확률과 함께 잠재적 결과의 범위를 제공합니다. 이는 수익 또는 손실 가능성을 이해하는
AltoX Spirol Indicator
Lesley Mthandazo Khulumo
AltoX Capital Spirol Indicator brings professional‐grade, pattern‐based signals to your MT5 charts in a single, easy-to-use tool. Advantages & Key Benefits •   Clear, Actionable Signals Automatically plots buy/sell arrows when your custom Spirol pattern completes on a closed bar—no guessing whether a signal is valid. •   Built-In Trend Filter •   Automatic Reference Levels Draws Retracement lines  for quick visual pullback targets. •   Real-Time Alerts Popup alerts in MT5 plus mobile push noti
Price Magnet — Price Density and Attraction Levels Indicator Price Magnet is a professional analytical tool designed to identify key support and resistance levels based on statistical Price Density. The indicator analyzes a specified historical period and detects price levels where the market spent the most time. These zones act as “magnets,” attracting price action or forming a structural base for potential reversals. Unlike traditional Volume Profile tools, Price Magnet focuses on price-time d
이 제품의 구매자들이 또한 구매함
ARICoins
Temirlan Kdyrkhan
ARICoin is a powerful trading companion designed to generate high-probability entry signals with dynamic TP/SL/DP levels based on volatility. Built-in performance tracking shows win/loss stats, PP1/PP2 hits, and success rates all updated live. Key Features: Buy/Sell signals with adaptive volatility bands Real-time TP/SL/DP levels based on ATR Built-in MA Filter with optional ATR/StdDev volatility Performance stats panel (Success, Profit/Loss, PP1/PP2) Alerts via popup, sound, push, or email Cust
CGE Trading Suite
Carl Gustav Johan Ekstrom
5 (1)
CGE Trading Suite delivers the analytical edge typically reserved for professional trading desks. The platform integrates a full suite of analytical tools into one seamless workflow: dynamic grid mapping, liquidity behavior analysis, ECM, trend lines, MIDAS, trade cycles, and directional channel projections. Together, these provide a unified view of market structure and momentum. Directional clarity is further enhanced by the capital flow index, which measures currency basket strength to identif
AriX
Temirlan Kdyrkhan
1 (4)
AriX Indicator for MT5 A powerful trend-following and signal-evaluation tool AriX is a custom MT5 indicator that combines Moving Averages and ATR-based risk/reward logic to generate clear buy/sell signals. It visualizes dynamic SL/TP levels, evaluates past trade outcomes, and displays win/loss statistics in a clean on-chart panel. Key features include: Buy/Sell signals based on MA crossovers ATR-based SL/TP1/TP2/TP3 levels with visual lines and labels Signal outcome tracking with real-time stat
Meravith MT5
Ivan Stefanov
마켓 메이커를 위한 도구. Meravith는 다음과 같은 기능을 제공합니다: 모든 타임프레임을 분석하고 현재 유효한 추세를 표시합니다. 강세와 약세 거래량이 동일한 유동성 구간(거래량 균형 구간)을 강조 표시합니다. 서로 다른 타임프레임의 모든 유동성 레벨을 차트에 직접 표시합니다. 텍스트 기반 시장 분석을 생성하여 참고용으로 제공합니다. 현재 추세를 기반으로 목표가, 지지선 및 손절가를 계산합니다. 거래의 위험 대비 보상 비율(Risk/Reward)을 계산합니다. 계좌 잔고에 따라 포지션 크기를 산출하고 잠재 수익을 추정합니다. 시장에 중대한 변화가 발생할 경우 경고도 제공합니다. 지표의 주요 라인: 강세/약세 거래량 소진 라인 — 목표가로 사용됩니다. 시장 추세를 나타내는 라인. 시장이 강세인지 약세인지에 따라 색상이 변경되며 추세 지지선 역할을 합니다. 색상은 주로 시장 심리를 보여줍니다. 거래량 균형선(Eq). Eq(Volume Equilibrium) 라인은 시스템의 핵심입니
OmniSync Projection
Antonio-alin Teculescu
5 (1)
Chronos Fractal Engine is an innovative price projection indicator for MetaTrader 5, designed to transform your technical analysis by intelligently identifying and projecting historical price patterns. Built upon an advanced correlation algorithm and the fractal principles of the market, this powerful tool visualizes potential future price movements, giving you a unique edge in your trading decisions. What is Chronos Fractal Engine? At its core, the Chronos Fractal Engine employs a sophisticat
ARIPoint
Temirlan Kdyrkhan
ARIPoint is a powerful trading companion designed to generate high-probability entry signals with dynamic TP/SL/DP levels based on volatility. Built-in performance tracking shows win/loss stats, PP1/PP2 hits, and success rates all updated live. Key Features: Buy/Sell signals with adaptive volatility bands Real-time TP/SL/DP levels based on ATR Built-in MA Filter with optional ATR/StdDev volatility Performance stats panel (Success, Profit/Loss, PP1/PP2) Alerts via popup, sound, push, or email Cu
" Dynamic Scalper System MT5 " 지표는 추세 파동 내에서 스캘핑 방식으로 거래하도록 설계되었습니다. 주요 통화쌍 및 금에서 테스트되었으며, 다른 거래 상품과의 호환성이 가능합니다. 추가적인 가격 변동 지원을 통해 추세에 따라 단기 포지션 진입 신호를 제공합니다. 지표의 원리 큰 화살표는 추세 방향을 결정합니다. 작은 화살표 형태의 스캘핑 신호를 생성하는 알고리즘은 추세 파동 내에서 작동합니다. 빨간색 화살표는 상승 방향을, 파란색 화살표는 하락 방향을 나타냅니다. 민감한 가격 변동선은 추세 방향으로 그려지며, 작은 화살표의 신호와 함께 작용합니다. 신호는 다음과 같이 작동합니다. 적절한 시점에 선이 나타나면 진입 신호가 형성되고, 선이 있는 동안 미결제 포지션을 유지하며, 완료되면 거래를 종료합니다. 권장되는 작업 시간대는 M1~H4입니다. 화살표는 현재 캔들에 형성되며, 다음 캔들이 이미 시작되었더라도 이전 캔들의 화살표는 다시 그려지지 않습니다. 입
SunSignal ML — AI Gold Signals with Multi-Timeframe Confluence SunSignal ML is an advanced AI-powered signal indicator purpose-built for XAUUSD gold trading. It combines a proprietary adaptive trend algorithm with six machine learning models trained on confirmed price pivots to produce high-confidence entry signals with multi-timeframe validation. The indicator runs efficiently on M1, M5 and M15 timeframes and is designed for traders who want precision entries guided by data rather than guesswor
ARIScalping
Temirlan Kdyrkhan
ARIScalp is a powerful trading companion designed to generate high-probability entry signals with dynamic TP/SL/DP levels based on volatility. Built-in performance tracking shows win/loss stats, PP1/PP2 hits, and success rates all updated live. Key Features: Buy/Sell signals with adaptive volatility bands Real-time TP/SL/DP levels based on ATR Built-in MA Filter with optional ATR/StdDev volatility Performance stats panel (Success, Profit/Loss, PP1/PP2) Alerts via popup, sound, push, or email Cus
Transaction Speed MT5
Ivan Stefanov
5 (3)
이 지표는 시장에서 관심이 나타나는 영역 을 강조 표시한 후, 주문이 누적되는 영역 을 보여줍니다. 이는 **대규모 오더북(호가창)**처럼 작동합니다. 이것은 거대한 자금 을 위한 인디케이터입니다. 성능은 탁월하며, 시장에서 어떤 관심이 있든 반드시 포착할 수 있습니다 . (이것은 완전히 새로 작성되고 자동화된 버전 입니다 – 이제 수동 분석은 필요하지 않습니다.) **거래 속도(Transaction Speed)**는 새로운 개념의 인디케이터로, 시장에 대규모 주문이 언제, 어디에 쌓이는지를 보여주며 , 그 이점을 분석합니다. 매우 초기 단계에서 트렌드 전환 을 감지할 수 있습니다. FX 시장에서 흔히 사용하는 "거래량(volume)"은 오해입니다. 실제로는 시간당 가격 변화량 이므로, 올바른 용어는 거래 속도 입니다. 우리가 어떻게 사고하고, 행동하며, 분석하느냐 가 가장 중요합니다. 분석 패러다임의 전환 은 필수적입니다. 이 인디케이터는 외환 시장에서의 볼륨 개념을 논리적으로
TrendMaestro5
Stefano Frisetti
note: this indicator is for METATRADER4, if you want the version for METATRADER5 this is the link:  https://www.mql5.com/it/market/product/108106 TRENDMAESTRO ver 2.5 TRENDMAESTRO recognizes a new TREND from the start, he never makes mistakes. The certainty of identifying a new TREND is priceless. DESCRIPTION TRENDMAESTRO identifies a new TREND in the bud, this indicator examines the volatility, volumes and momentum to identify the moment in which there is an explosion of one or more of these da
Weis Wave with Alert MT5
Trade The Volume Waves Single Member P.C.
4.94 (17)
Rental/Lifetime Package Options and Privileges  Rent Monthly Six Months   Yearly/Lifetime Weis Wave with Speed with Alert+Speed Index x x x Manual  x x x Quick Set up Video x x x Blog x x x Lifetime Updates x x x Setup and Training Material x x Discord Access Channel "The SI traders"          x Rectangle Break Alert Tool      x How to trade with it:    http://www.tradethevolumewaves.com   ** If you purchase please contact me to setup your  : Training Room and  complete manual access.  Wei
Rtc ML Ai Predictor
Muhammad Faisal Sagala
Rtc ML Ai | Predictor CORE MACHINE LEARNING ENGINE Adaptive ML Market Predictor – Multi-Bar Trend & Candle Forecast What This Indicator Does This indicator is a  real-time market prediction engine  designed to analyze price behavior and estimate  future market tendencies . Unlike conventional indicators, this system  does not rely on static parameters or historical curve-fitting , but adapts its internal state dynamically during live market operation. Instead of using static rules, the indic
Max Ribbon Mt5
Stefano Frisetti
WARNING: This indicator is distributed EXCLUSIVELY on MQL5.com MT4 version:   https://www.mql5.com/it/market/product/160363 MT5 version:   https://www.mql5.com/it/market/product/160410 ============================================================================================= MAX RIBBON ver 1.00 The indicator that shows you the TREND clearly and unambiguously! ============================================================================================= DESCRIPTION MAX RIBBON is an advanced tre
Big Player Range
Thalles Nascimento De Carvalho
5 (3)
BigPlayerRange – MT5 최고의 지표 BigPlayerRange 는 MetaTrader 5에서 미니 인덱스와 미니 달러를 위한 최고의 지표 로 평가받고 있습니다. 이 도구는 주요 기관 투자자들의 전략적 영역을 강조하여 높은 정확도의 기관 기술 분석을 제공합니다. BigPlayerRange 사용법: 이 지표는 매수 구간(녹색선)과 매도 구간(빨간선)을 표시합니다. 가격이 이 구간 밖에서 마감되면 추세 움직임이 예상됩니다. 녹색선 위에서 마감: 강한 매수세와 상승 추세 가능성. 빨간선 아래에서 마감: 매도 압력과 하락 가능성. 범위 내에서 마감: 횡보 시장, 돌파 신호 대기. 주요 혜택: 기관 투자자 영역 매핑: 주요 투자자들의 활동 구간을 식별합니다. 자동 목표 지점 산출: 거래 종료에 적합한 목표 지점을 제공합니다. 풀백 분석: 리스크 관리를 위한 가격 반등 가능성 평가. 활용 방법: BigPlayerRange와 함께 Imba
IVISTscalp5
Vadym Zhukovskyi
5 (6)
iVISTscalp5 — 시간 기반 시장 예측 시스템 iVISTscalp5는 일반적인 지표가 아닙니다. MetaTrader 5용 시간 기반 예측 시스템으로, 시장이 언제 움직일 가능성이 높은지를 보여줍니다. ⸻ 기능  • 정확한 타이밍  • BUY / SELL 신호  • 평균 수익 잠재력  • 주간 예측  • 120개 이상의 자산 ⸻ 핵심 개념 시장은 가격뿐만 아니라 시간에 의해 움직인다 ⸻ iVISTscalp5 — 시간에서의 우위 당신에게 소개하는 iVISTscalp5 지표는 독특하면서도 거래 작업에서 효과적입니다. 이 지표는 시간 데이터를 기반으로 하며 금융 시장의 많은 경험과 깊은 분석의 결과입니다. iVISTscalp5 지표는 수동 거래에 뛰어난 도구입니다. 편리성, 간단함 및 시각화 - 모든 복잡성은 숨겨져 있습니다. 우리는 iVISTscalp5 지표의 설정과 사용을 최대한 단순화했습니다. 이 지표는 MT5 터미널에서 가지고 있는 모든 금융 상품에 적합
+++++++++++++++++++++++++++++++++++++++++++++++++++++++++++++++++++++++++++++++++++++++++++++++++ +++ Link to EURUSD Only Free Version -->  https://www.mql5.com/en/market/product/156904?source=Unknown +++++++++++++++++++++++++++++++++++++++++++++++++++++++++++++++++++++++++++++++++++++++++++++++++ Hallo Trader, This is a traditional GANN & FIBONACCI strategy based on detection of an impulsive move in the opposite direction. This is called a Breakout. At the moment of Breakout, the indicator draw
Frontier Pivots
Nestor Jose Mendez Boza
FRONTIER PIVOTS - Geometric Levels Indicator This indicator plots support and resistance levels/ranges on the chart using mathematical calculations. It helps traders identify potential price reaction zones based on geometric patterns. Main Features: Automatically calculates and displays key price levels Plots both support and resistance lines Uses daily price data for level calculation Clean visual presentation with different colors for different level types No repainting - levels remain static
Jita Indicator Pro
Jimmy Mwaba
1 (1)
Jita Indicator Pro MT5 | All Timeframes Professional Trend Agreement System – Premium Edition ($500) What Is Jita Indicator Pro? Jita Indicator Pro is a structured trend-confirmation system designed for serious traders who value precision, alignment, and controlled signal behavior. It combines: Advanced band-based trend direction logic ATR-driven structural trigger engine Dual-confirmation agreement system Locked history update design This indicator prints signals only when multiple conditions
Hunter Spike
Jaime Humberto Gomez Arias
Hunter Spike This indicator consists of two regression channels calibrated with the current movement of the synthetic index algorithm, for any Deriv or Weltrade broker. Each channel has a signal, a target that alerts us when the price touches them, indicating buys on booms or gains and sells on crashes or pains. -configuration for booms or gains: Channel zone 1 (30) Channel zone 2 (0) -configuration for crashes or pains: Channel zone 1 (100) Channel zone 2 (70) Zones freely configurable by
VTrende Pro
Andrii Diachenko
5 (1)
VTrende Pro - MTF indicator for trend trading with a display panel for MT5 *** Videos can be translated into any language using subtitles (video language - Russian) Although the signals of the VTrende Pro indicator can be used as signals of a full-fledged trading system, it is recommended to use them in conjunction with the Bill Williams TS. VTrende Pro is an extended version of the VTrende indicator. Difference between Pro version and VTrende: - Time zones - Signal V - signal 1-2 waves -    S
Recommended TimeFrame >= H1. 100% Non Repainted at any moment.  Use it carefully, only with Trend Direction. Trading Usage: 2 Variants: as Range System or as BreakOut System (Both Only With Trend Direction)::: (Always use StopLoss for minimise Risk); [1] as Range System: (Recommended) in UP TREND:  - BUY in Blue Line , then if price goes down by 50 points (on H1) open Second BUY.   Close in any Profit you wish: TrailingStop(45 points) or Close when Price touches upper Gold Line. in DOWN TREND
FXLAND Smart Reversal Indicator (MT5) FXLAND Smart Reversal Indicator is a professional technical analysis tool designed to help traders identify potential price reversal zones and key market turning points with clarity and precision. The best reversal indicator and price return by choosing only one ceiling or floor in each time frame A masterpiece of combining mathematics and Gann, fractal matrix, Fibonacci, movement angle and time. Completely intelligent Key Features Detects potenti
Pantera Indicator
Temirlan Kdyrkhan
5 (1)
A tool for on-chart strategy backtesting and performance analysis. A utility for developing, debugging, and testing custom trading ideas and indicator functions. An indicator designed to quickly test trading concepts and visualize the effectiveness of different input parameters. An all-in-one sandbox for testing everything from simple crossovers to complex, multi-condition trading systems.
AlgoEAs Trend Dashboard V1 Indicator for MT5 Introduction: This is a Dashboard Indicator based on 7 built in Multi Timeframe indicators. This strategy gives Buy/Sell Ideas based on 9 trend states. Easy to view gas guage to view current trend. Has as optional Alerts to enable with 9 messages. Run on M15 chart, with M15, H1, and H4 indicator time frames. Great tool! Features: Non-Repainting Dashboard For Desktop MT5 Only, Works On Any Mt5 Pair Great for Intraday and Swing Trading Easy view gas
WanaScalper
Isaac Wanasolo
1 (1)
A scalping indicator based on mathematical patterns, which on average gives signals with relatively small SL, and also occasionally helps to catch big moves in the markets (more information in the video) This indicator has three main types of notifications: The first type warns of a possible/upcoming signal on the next bar The second type indicates the presence of a ready signal to enter the market/open a position The third type is for SL and TP levels - you will be notified every time price re
Historical Similarity Matcher Indicator (HI.SI.MA) Try it free today — demo version now available!   https://www.mql5.com/en/market/product/167114 Overview The Historical Similarity Matcher is a technical analysis indicator for MetaTrader 5. It scans historical price data to find segments that show statistical similarity to a user-selected reference period on the chart.
XCalper TFO
Aecio de Feo Flora Neto
This oscillator was developed exclusively by xCalper in 2015 based on moving averages calculations to indicate and try predicting oversold and overbought levels. The fast line (white, by default) oscillates basically between values -0.5 (oversold) and +0.5 (overbought). Whenever this line crosses upward value -0.5, it means an oversold price level. When it crosses downward value +0.5, it means an overbought price level. When fast line crosses value 0.0 and returns, it is a strong pull-back indic
Pan PrizMA CD Phase
Aleksey Panfilov
The Expert Advisor and the video are attached in the Discussion tab . The robot applies only one order and strictly follows the signals to evaluate the indicator efficiency. Pan PrizMA CD Phase is an option based on the Pan PrizMA indicator. Details (in Russian). Averaging by a quadric-quartic polynomial increases the smoothness of lines, adds momentum and rhythm. Extrapolation by the sinusoid function near a constant allows adjusting the delay or lead of signals. The value of the phase - wave s
Классификатор силы тренда. Показания на истории не меняет. Изменяется классификация только незакрытого бара. По идее подобен полной системе ASCTrend, сигнальный модуль которой, точнее его аппроксимация в несколько "урезанном" виде, есть в свободном доступе, а также в терминале как сигнальный индикатор SilverTrend . Точной копией системы ASCTrend не является. Работает на всех инструментах и всех временных диапазонах. Индикатор использует несколько некоррелируемых между собой алгоритмов для класси
제작자의 제품 더 보기
Support and Ressistance
Raphael Lorenz Baumgartner
Last Day Support & Resistance Platform: MetaTrader 5 Type: Custom Indicator Display: Chart Window (Overlay) Functions: Calculates Support and Resistance zones based on high/low patterns of the previous day. Uses a sliding sampling window ( SampleWindowSize ) to detect recent price ranges. Detects potential support if current price range is significantly below previous highs. Detects potential resistance if price range is significantly above previous lows. Updates four output buffers: LDResistanc
FREE
Volume and MarketProfile Pro
Raphael Lorenz Baumgartner
볼륨 및 마켓프로필 프로 설명: MarketProfile 인디케이터는 다양한 가격 수준에서의 거래량에 대한 정확하고 상세한 분석을 제공합니다. 각 거래일의 거래량 프로파일을 계산하여 표시함으로써, 시장 구조와 거래량 분포를 이해하여 정보에 입각한 거래 결정을 내릴 수 있도록 도와줍니다. 주요 특징: 일일 거래량 분석: 인디케이터는 각 거래일의 거래량 프로파일을 계산하여 표시하므로, 다양한 가격 수준에서의 거래량 분포를 쉽게 파악할 수 있습니다. 포인트 오브 컨트롤 (POC): POC는 당일 가장 많은 거래량이 발생한 가격 수준을 나타내는 수평선으로 표시되어, 중요한 지지 및 저항 수준을 파악하는 데 도움을 줍니다. 밸류 에어리어 하이 (VAH) 및 밸류 에어리어 로우 (VAL): 이 선들은 70%의 거래량이 발생하는 밸류 에어리어의 상한선과 하한선을 표시합니다. 이러한 정보는 시장 활동과 잠재적인 가격 반전 지점을 이해하는 데 중요합니다. 세션별 색상: 인디케이터는 아시아, 유럽,
Volume Weighted Average Price VWAP
Raphael Lorenz Baumgartner
Indicator: VWAP Volume Weighted Average Price Platform: MetaTrader 5 Type: Custom Indicator Display: Chart Window (Overlay) Functions: Calculates the Volume Weighted Average Price (VWAP) per trading day. Continuous VWAP calculation using the average of Open and Close prices and tick volume. Automatic reset of the VWAP calculation at the start of each new day. Limits data usage via the BufferSize parameter (number of candles stored in a circular buffer). Calculates the trend (slope) of the VWAP o
Periodic Volume Profile
Raphael Lorenz Baumgartner
Periodic Volume Profile Platform: MetaTrader 5 Type: Custom Indicator Display: Chart Window (Overlay) Functions: Calculates Point of Control (POC) , Value Area High (VAH) , and Value Area Low (VAL) continuously over a rolling buffer of candles. Uses tick volume and close price to update volume distribution in real-time. Keeps a fixed-length circular buffer ( CleanUpAfter ) to remove old price-volume data. Automatically adjusts the volume profile range if price moves outside the current bounds. V
필터:
리뷰 없음
리뷰 답변