Suporte e Resistencia

⚠️ Aviso de Risco Negociar no mercado financeiro envolve riscos significativos. Esta ferramenta é um auxílio à tomada de decisão e não garante lucros. Opere com responsabilidade e sempre com gerenciamento de risco adequado.

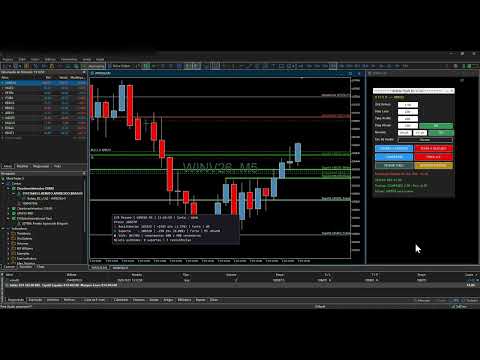
Caracteristicas deste Super Indicador de Topos e Fundos :

- Analisa as últimas barras (configurável) e detecta topos e fundos;

- Agrupa pivôs próximos em um único nível, usando uma tolerância baseada no range médio das barras.;

- Níveis abaixo do preço atual viram suportes e níveis acima viram resistências. Se um suporte é rompido, ele passa a ser resistência na próxima barra;

- A força de cada nível vem do volume (tick volume) das barras que tocaram a zona.

O volume de cada barra é dividido em comprador e vendedor conforme onde ela fechou entre a mínima e a máxima. No suporte conta o volume comprador, na resistência o vendedor. O total é comparado ao volume médio por barra e normalizado entre as linhas exibidas.

Cores por força :

- Suportes (compradores): verde escuro (forte), verde-limão (médio) e verde claro (fraco);

- Resistências (vendedores): vermelho escuro (forte), laranja-avermelhado (médio) e rosa claro (fraco);

- Forte é força ≥ 66%, média ≥ 33%, e fraca abaixo disso. A espessura da linha também aumenta com a força;

- O rótulo à direita mostra o preço, a classe de força, o percentual do lado dominante e o número de toques.

O indicador recalcula a cada nova barra. Em forex o volume usado é o de ticks, então a força é uma aproximação.

Além do gráfico atual (por exemplo M5), o indicador analisa o H1 e o H4 (configuravel) com a mesma lógica de rejeições e mostra só os níveis fortes deles.

As linhas dos timeframes maiores aparecem tracejadas e mais grossas.

O rótulo leva o prefixo do timeframe, como [H1] , e fica abaixo da linha, para não se misturar com os rótulos do gráfico atual, que ficam acima.

Quando um nível do gráfico atual cai dentro da zona de um nível forte do H1 ou do H4, ele é marcado como confluência:

a força dele recebe um bônus (+50% por timeframe, configurável), então tende a subir de faixa de cor, a linha fica um ponto mais grossa, o rótulo mostra, por exemplo, confluência H1+H4.

Timeframes iguais ou menores que o do gráfico são ignorados, e o indicador registra um aviso. No H4, por exemplo, nem o H1 nem o H4 entram.

Se os dados de outro timeframe ainda não estiverem carregados, o indicador tenta de novo a cada 5 segundos até conseguir, e depois volta a recalcular só em nova barra.

O painel pode ser movido com o mouse. Ele também já abre no canto inferior esquerdo.
추천 제품
MultiSymbolsWpr Indice x IBOV
Israel Goncalves Moraes De Souza
O Indicador identifica relação do Índice com a soma dos principais ativos, funciona para qualquer mercado do mund o, possui um oscilador WPR com a soma dos principais ativos escolhidos, indicando a antecipação do movimento em relação ao Índice. Características WPR com a soma dos papéis escolhidos - branco WPR do papel atual - vermelho Canal de Tendência O indicador pode indicar movimento de entradas, sendo: cruzamento das linhas cruzamento da linha Multi Symbols no -50 cruzamento entre os canai
FREE
Marca Dagua
Erison Francisco De Sales
3 (1)
Adiciona marca d'água com nome do ativo em negociação. Pode ser ajustado definindo tamanho da fonte e coloração do texto. Testado com vários ativos do mercado B3 e Forex  Adione ao gráfico e configure de acordo com a necessidade. Caso tenha problemas sinta-se a-vontade para nos avisar e providenciaremos a correção logo que possível. ______________________________
FREE
Pivot Point Fibo RSJ
JETINVEST
4.41 (22)
피봇 포인트 Fibo RSJ는 피보나치 비율을 사용하여 당일의 지지선과 저항선을 추적하는 지표입니다. 이 멋진 지표는 피보나치 비율을 사용하여 피벗 포인트를 통해 최대 7단계의 지지와 저항을 생성합니다. 가격이 작업의 가능한 진입/종료 지점을 인식할 수 있는 이 지원 및 저항의 각 수준을 어떻게 존중하는지 환상적입니다. 특징 최대 7단계 지원 및 7단계 저항 레벨의 색상을 개별적으로 설정 입력 피벗 유형 피벗 피보 RSJ1 = 피보 비율 1 계산 피벗 피보 RSJ2 = 피보 비율 2 계산 피벗 Fibo RSJ3 = Fibo 비율 3 계산 피벗 피보 클래식 = 클래식 피벗 계산 최소 피벗 수준 피벗 3 레벨 피벗 4 레벨 피벗 5 레벨 6단계 피벗 피벗 7 레벨 여전히 질문이 있는 경우 다이렉트 메시지로 저에게 연락하십시오: https://www.mql5.com/ko/users/robsjunqueira/
FREE
Weis Wave Double Side
Eduardo Da Costa Custodio Santos
The Weis Wave Bouble Side Indicator for MT5 is part of the toolkit (Wyckoff Academy Wave Market) The Weis Wave Bouble side Indicator for MT5 was created based on the already established Weis Wave created by David Weis. The Weis Wave Double Side indicator reads the market in waves as it was done by R. Wyckoff in 1900. It helps in the identification of effort x result, cause and effect, and Supply and demand Its differential is that it can be used below the zero axis, further improving plus operat
Heiken_Ashi_Bars - MT5용 고급 추세 시각화 도구 개요 Heiken_Ashi_Bars 는 시장의 노이즈를 필터링하고 진정한 기본 추세를 강조하도록 설계된 강력하고 시각적으로 직관적인 사용자 지정 지표입니다. 기존의 캔들스틱 차트는 불규칙하여 거짓 신호와 섣불린 청산을 유발할 수 있습니다. 이 지표는 가격 데이터를 평균화하여 가격 움직임을 부드럽게 만들어 추세 지속, 반전 및 수익성 있는 진입 구간을 훨씬 쉽게 파악할 수 있도록 해줍니다. 주요 기능 및 장점 강력한 노이즈 감소: 사소한 가격 급등 및 횡보 노이즈를 필터링합니다. 명확한 시각적 신호: 색상으로 구분된 막대를 통해 강세 및 약세 모멘텀을 한눈에 파악할 수 있습니다. 리페인트 없음 (No Repaint): 막대가 마감되면 신호가 고정됩니다. 과거 막대를 다시 계산하지 않습니다. 고도로 최적화됨: 터미널 지연이 없도록 깔끔하게 코딩되었습니다. 다양한 활용: 모든 금융 상품(외환, 지수, 금속, 암호화폐)에서
White Weis Volume Ticks
Ricardo Almeida Branco
5 (4)
White Weis Volume This indicator shows the sum of the volume in each wave, bulish or bearish, as idealized by David Weis , but it brings an important addition , which is the marking of the bar with the highest volume of the wave (White Bar)! In coding the indicator, it was sought to optimize the code to require minimal processing during use and not to overload mt5. The indicator can be used for pre-trading analysis and study, where the trader analyzes possible points of support and resistance
High Low Open Close
Alexandre Borela
4.98 (45)
이 프로젝트를 좋아한다면 5 스타 리뷰를 남겨주세요. 이 지표는 열리고, 높은, 낮은 및 마감 가격을 지정합니다. 기간과 그것은 특정한 시간대를 위해 조정될 수 있습니다. 이들은 많은 기관 및 전문가에 의해 보는 중요한 수준입니다 상인은 당신이 더 많은 것일 수있는 장소를 알고 도움이 될 수 있습니다 이름 * 사용 가능한 기간: 이전 날. 이전 주. 지난 달. 이전 분기. 이전 연도. 또는: 현재 날. 현재 주. 현재 달. 현재 분기. 현재 년.
FREE
WAPV Weis Wave Chart Forex
Eduardo Da Costa Custodio Santos
The Weis Wave Chart Forex for MT5 is a Price and Volume indicator. The Price and Volume reading was widely disseminated through Richard Demille Wyckoff based on the three laws created by him: Supply and Demand, Cause and Effect and Effort vs. Result. In 1900 R.Wyckoff already used the wave chart in his analyses. Many years later, around 1990, David Weis Automated R. Wyckoff's wave chart and today we bring you the evolution of David Weis' wave chart. It shows the amount of Volume and the amount o
Gekko ADX Plus
Rodrigo Galeote
This is Gekko's Cutomized Cutomized Average Directional Index (ADX), a customized version of the famous ADX indicator. Use the regular ADX and take advantage two entry signals calculations and different ways of being alerted whenever there is potential entry or exit point. Inputs Period: Period for the ADX calculation; PlotSignalType: How will the indicator calculate entry (swing) signals: 1- ShowSwingsOnTrendLevel : Show Signals for Trend Confirmation Swings; 2- ShowSwingsOnTrendLevelDirection
Advanced Market Cypher B
Felipe Monteiro Rodrigues
제품이 마음에 드셨다면 댓글과 평가를 잊지 마세요! Advanced Market Cipher B Advanced Market Cipher B 는 MetaTrader 5 용 고급 지표로, 하나의 도구에서 모멘텀, 시장 자금 흐름, 추세 및 다이버전스 를 종합적으로 확인할 수 있도록 개발되었습니다. 이 지표는 TradingView에서 vumanchu가 공개한 “VuManChu Cipher B + Divergences”의 개념과 시각적 구조를 기반 으로 하며, 주요 개념을 MetaTrader 5 환경에 맞게 적용하고 추가 기능, 시각적 개선 및 자체 기능을 포함하고 있습니다. Advanced Market Cipher B 의 목적은 다양한 기술적 정보를 하나의 창에 통합하여 트레이더가 모멘텀, 강도, 흐름, 추세 및 다이버전스 사이의 관계를 보다 명확하게 확인하고 시장 행동의 잠재적인 변화를 보다 쉽게 파악할 수 있도록 하는 것입니다. 주요 구성 요소 • WaveTrend — 모멘텀 분석,
FREE
LT Agression Indicator
Thiago Duarte
5 (3)
This is a buyer and seller aggression indicator that analyzes the shape of each candle and project this data in a histogram form. There are 4 histograms in one. On the front we have two: Upper - Buyer force. Lower - Seller force. At the background we also have two histogram, both with same color. They measure the combined strenght of buyers and sellers. This histograms can be turned off in Input Parameters. It is also possible to have the real or tick volume to help on this force measurement. IN
FREE
Midas VWAP
Paulo Henrique Faquineli Garcia
4 (2)
Volume Weighted Average Price (VWAP) is a trading benchmark commonly used by Big Players that gives the average price a Symbol has traded throughout the day. It is based on both Volume and price. This indicator contains Daily VWAP and MIDAS' VWAP, which means you are able to anchor the beggining of MIDAS' calculations and, therefore you will be able to use this methodology to study price versus volume moves after anchor point. You will be able to anchor up to 3 HIGH MIDAS VWAP's and 3 LOW. Wish
FREE
Reversal Oscillator — Advanced Momentum Shift Detector Reversal Oscillator is a free indicator designed to highlight price zones that are statistically outside their normal movement patterns, helping traders anticipate potential turning points before they occur. Unlike traditional oscillators that react mainly to overbought/oversold conditions, this indicator applies third derivative analysis (the "acceleration of the acceleration" of price) calculated using two independent methods within a n
FREE
LT Donchian Channel
Thiago Duarte
4.86 (7)
Donchian Channel is an indicator created by Richard Donchian. It is formed by taking the highest high and the lowest low of the last specified period in candles. The area between high and low is the channel for the chosen period. Its configuration is simple. It is possible to have the average between the upper and lower lines, plus you have alerts when price hits one side. If you have any questions or find any bugs, please contact me. Enjoy!
FREE
Simple Dispertion Zones
Bruno Kamino Yamamoto
Simple Dispersion Zones is a powerful yet easy-to-use indicator that identifies key trading zones by analyzing price dispersion over the last N candles. It automatically detects areas of price consolidation and highlights them on the chart using a transparent red triangle, providing a clear visual representation of recent market structure. This tool is perfect for: Drawing trend channels Identifying sideways market zones Supporting breakout and mean-reversion strategies With its clean and non-in
MSX Hybrid Heiken Scalper
Som Prakash Gehlot
5 (1)
MSX Hybrid Heiken Scalper Overview MSX Hybrid Heiken Scalper is a MetaTrader 5 indicator based on a modified Heiken Ashi methodology with closed-bar smoothing. The indicator is designed to display trend direction through color-coded candles while reducing sensitivity to short-term market fluctuations. All calculations are performed using completed candles, allowing historical values to remain fixed after bar close. Features • Modified Heiken Ashi calculation • Closed-bar processing • Color-code
FREE
Professional Support and Resistance Indicator This indicator was developed as a market context study and analysis tool , designed to help identify potentially relevant areas on the chart through the combination of price action, volume, and higher-timeframe market structure . The indicator displays two layers of horizontal dashed lines , positioned at areas considered relevant for analysis. This allows traders to observe different support and resistance zones and evaluate their relationship with
Reversal Magnet Lines
Gleidson Duca De Aguiar
Launch price: 30 USD - price will increase after the first purchases, so early buyers lock in this rate. Reversal Magnet Lines plots the closing price of each of the last N trading days (configurable from 15 to 180 days) as horizontal lines directly on the chart. These prior-day close levels frequently act as short-term support and resistance, where price either reverses or breaks through with momentum. Based on an analysis of 52 trading days on JPN225, price interacted with these levels in mo
Caicai L&S Yield Histogram Important Notice: This indicator is an integral tool of the automated EA Caicai Long and Short Pair Trading . This indicator visually displays the percentage deviation (Yield %) of a pair's current spread relative to its own historical mean. It is an excellent tool for quickly visualizing the gross financial potential of a market distortion in Long & Short operations. Main Features: Percentage Visualization: Understand the size of the distortion in palpable percentage
A Média Móvel é um indicador que faz parte da Análise Técnica. Com ela, é possível identificar o equilíbrio dos preços no mercado, observando tendências de alta, neutra ou baixa. Este indicador customizado traz opções extras pera definir o método de cálculo podendo-se esclolher entre SMA,EMA,SSMA,LWMA,JJMA,JurX,ParMA,T3,Vidya,AMA,HULL MA. Também conta com varias opções para escolher o método de cálculo para o preço base a ser usado no cáculo da média.
Painel Indicador MACD
Renato Aparecido Braguini
️ Aviso de Risco Negociar no mercado financeiro envolve riscos significativos. Esta ferramenta é um auxílio à tomada de decisão e não garante  lucros. Opere com responsabilidade e sempre com gerenciamento de risco adequado. O painel do indicador MACD utiliza como base uma das três possíveis configurações a seguir :  1. Cruzamento das Linhas (MACD x Linha de Sinal); -  Sinal de Compra (Alta): Ocorre quando a Linha MACD cruza de baixo para cima a Linha de Sinal.  -  Sinal de Venda (Baixa): Ocorr
FREE
VWAP Anchor Tool
Jackson Mukurani Wanguthi
Anchored VWAP is a lightweight, interactive volume-weighted average price indicator designed for traders who need precision without clutter. Unlike standard VWAP that resets every session, this tool lets you drop up to five custom anchors directly on any candle. Each anchor calculates VWAP from that exact point forward, complete with standard deviation bands to highlight where price may find support or resistance relative to volume. Key Features: • Up to 5 simultaneous anchors — compare multi
FREE
Weis Wave Double Side Alert
Eduardo Da Costa Custodio Santos
The Weis Wave Bouble Side Indicator for MT5 is part of the toolkit (Wyckoff Academy Wave Market) The Weis Wave Bouble side Indicator for MT5 was created based on the already established Weis Wave created by David Weis. The Weis Wave Double Side indicator reads the market in waves as R. Wyckoff did in 1900. It helps in the identification of effort x result, cause and effect, and Supply and demand Its differential is that it can be used below the zero axis and has a breakout alert showing Who is s
Volume Suite
Zbynek Liska
FoxWave Volume Suite combines three essential volume-based tools into a single indicator: a horizontal Volume Profile with Point of Control and Value Area, a real-time volume spike detector with instant alerts, and a buy/sell pressure delta gauge. No need to run three separate indicators — everything you need to read volume is in one clean Fox Wave panel. What it does Volume Profile (POC / VAH / VAL) Builds a horizontal histogram showing how much volume traded at each price level over your cho
Price Magnet — Price Density and Attraction Levels Indicator Price Magnet is a professional analytical tool designed to identify key support and resistance levels based on statistical Price Density. The indicator analyzes a specified historical period and detects price levels where the market spent the most time. These zones act as “magnets,” attracting price action or forming a structural base for potential reversals. Unlike traditional Volume Profile tools, Price Magnet focuses on price-time d
VWAP and MVWAP
Flavio Javier Jarabeck
4 (9)
Volume Weighted Average Price (VWAP) is a trading benchmark commonly used by Big Players that gives the average price a Symbol has traded throughout the day. It is based on both Volume and price. Additionally we put in this indicator the MVWAP (Moving Volume Weighted Average Price). For those who do not know the usage and the importance od this indicator I recommend a great article about this subject at Investopedia ( https://www.investopedia.com/articles/trading/11/trading-with-vwap-mvwap.asp )
FREE
IMR is a multi-layered quantitative reversal finder designed for discretionary price-action traders who refuse to trade blind. It does not generate entry signals, nor does it draw buy/sell arrows. Instead, it answers the three questions that matter most before you ever place a limit order: What is the market's statistical DNA right now? (Hurst Exponent) Is the current move backed by genuine strength, or is it exhausted? (ADX) Has price moved too far, too fast, with too much conviction — suggest
FREE
Donchian Breakout And Rsi
Mattia Impicciatore
4.5 (2)
개요 이 지표는 클래식 돈치안 채널(Donchian Channel) 의 향상된 버전으로, 실전 트레이딩을 위한 다양한 기능이 추가되었습니다. 표준 세 개의 선(상단, 하단, 중앙선) 외에도 브레이크아웃 을 감지하여 차트에 화살표로 시각적으로 표시하며, 차트를 깔끔하게 보기 위해 현재 추세 방향의 반대 라인만 표시 합니다. 지표 기능: 시각적 신호 : 브레이크아웃 시 컬러 화살표 표시 자동 알림 : 팝업, 푸시 알림, 이메일 RSI 필터 : 시장의 상대 강도를 기반으로 신호 검증 사용자 맞춤 설정 : 색상, 선 두께, 화살표 코드, RSI 임계값 등 동작 원리 돈치안 채널은 다음을 계산합니다: 상단선 : 최근 N개의 종가 완료 캔들에서 가장 높은 고가 하단선 : 최근 N개의 종가 완료 캔들에서 가장 낮은 저가 중앙선 : 고가와 저가의 평균값 상방 브레이크아웃 은 종가가 상단선을 돌파할 때 발생하며, 하방 브레이크아웃 은 종가가 하단선 아래로 내려갈 때 발생합니다. 이 지표는: 세 개의
FREE
Expansoes M
Marcus Vinicius Da Silva Miranda
The M Extensions are variations of the Golden Ratio (Fibonacci Sequence). It is the World's first technique developed for Candle Projections. Advantages: Easy to plot. Candle anchoring; High and accurate precision as support and resistance; Excellent Risk x Return ratio; Works in any timeframe; Works in any asset / market.   The M Extensions are classified into: M0: Zero point (starting candle) RC: Initial candle control region M1: Extension region 1 M2: Extension region 2 M3: Extension regi
FREE
How it works –   Base-departure detection — algorithmically finds consolidation bases (overlapping range with compressed volatility) followed by displacement departures. Patterns: Drop-Base-Rally, Rally-Base-Drop, Rally-Base-Rally, Drop-Base-Drop — detected structurally, not by candle names. –   Strength score (0–100) — from departure velocity, time-at-base, freshness (each revisit decays the score), higher-timeframe confluence and origin volume. –   Lifecycle — Fresh, Tested (decaying), Broken
FREE
이 제품의 구매자들이 또한 구매함
SMART TREND TRADING SYSTEM — 특별 혜택 트레이딩 시스템, 자동매매 EA, 교육과 지원을 하나로. MT5용 Smart Trend Trading System을 99 USD에 구매하고, 시스템의 신호를 자동매매에 활용할 수 있는 Smart Universal Expert Advisor를 무료로 받으세요 . STTS는 추세 방향, 진입·청산 신호, 반전 구간, 주요 가격 수준을 차트에 모아 보여줍니다. 시스템을 참고해 수동으로 거래하거나, 포함된 EA를 연결하여 선택한 설정에 따라 자동으로 거래를 실행할 수 있습니다. 현재 가격인 99 USD는 앞으로 이루어지는 30건의 구매에 적용됩니다. 이후 가격은 149 USD로 인상됩니다. 전체 패키지 구성 구매 시 다음 항목이 포함됩니다. • MT5용 Smart Trend Trading System. • Smart Universal Expert Advisor — 무료. • 전체 STTS PDF 사용자 설명서. • STTS
Trend Sniper X
Sarvarbek Abduvoxobov
4.9 (39)
Trend Sniper X 는 트레이더가 추세 방향과 잠재적 반전 지점을 명확하고 정확하게 포착할 수 있도록 도와주는 MetaTrader 5용 멀티 타임프레임 추세 추종 지표입니다. MT4용: https://www.mql5.com/en/market/product/193245 가격 정보: 현재 가격은 프로모션 할인가이며, 향후 업데이트 및 새로운 기능이 출시됨에 따라 변동될 수 있습니다. 보너스 혜택: 본 지표 전용 무료 자동매매 Assistant EA를 받으시려면 구매 후 작성자에게 메시지를 보내주시기 바랍니다. Code2Profit 채널 멀티 타임프레임 분석으로 시장을 마스터하세요! Trend Sniper X로 승률을 극대화하는 방법: 핵심 규칙 및 세션 팁 기술 사양 플랫폼 MetaTrader 5 지표 유형 멀티 타임프레임 추세 지표 운용 타임프레임 모든 차트 타임프레임 지원, 독립적으로 선택 가능한 상위 타임프레임(M1–MN1) 주요 상품 외환, 금(XAUUSD) 및 기타 C
ARIPoint
Temirlan Kdyrkhan
1 (4)
ARIPoint is a powerful trading companion designed to generate high-probability entry signals with dynamic TP/SL/DP levels based on volatility. Built-in performance tracking shows win/loss stats, PP1/PP2 hits, and success rates all updated live. Key Features: Buy/Sell signals with adaptive volatility bands Real-time TP/SL/DP levels based on ATR Built-in MA Filter with optional ATR/StdDev volatility Performance stats panel (Success, Profit/Loss, PP1/PP2) Alerts via popup, sound, push, or email Cu
SuperScalp Pro
Van Minh Nguyen
4.66 (35)
SuperScalp Pro - Professional Multi-Layer Confluence Scalping System SuperScalp Pro는 클래식 Supertrend에 여러 지능형 확인 필터를 추가한 고급 스캘핑 지표입니다. 더 높은 확률의 Buy/Sell 거래 기회를 식별하는 데 도움을 주며, 잘못된 신호를 크게 줄이는 데 도움을 줍니다. 명확한 Buy 및 Sell 화살표가 차트에 직접 표시되며, ATR 기반 Stop Loss 및 Take Profit 수준이 실시간으로 자동 계산됩니다. 구매 후 설정 방법 및 권장 구성에 대한 안내가 필요하시면 저에게 문의해 주세요. SuperScalp Pro Auto Trader를 사용하여 신호를 쉽게 자동화할 수 있습니다: [Auto Trader] 권장 설정 파일 다운로드: [Set File] 전체 문서는 제품 블로그에서 확인할 수 있습니다: [User Guide] 업데이트를 확인하려면 공식 채널에 참여하세요: [Official C
Zoryk Gold
Reda El Koutbane
5 (15)
ZORYK — MetaTrader 5용 XAUUSD 전문 신호 및 트레이드 플래닝 시스템 이런 경험이 있을 것입니다. 골드를 분석하고 진입을 기다린 뒤 마침내 포지션을 열었지만 가격이 곧바로 반대 방향으로 움직입니다. 너무 일찍 청산하거나 Stop Loss를 옮기거나 몇 초 동안 망설입니다. 그 후 시장은 내가 없이도 처음 예상했던 목표까지 정확히 움직입니다. 문제는 항상 방향이 아니었습니다. 진짜 문제는 불확실성이었습니다. 정확한 진입 위치를 몰랐습니다. 어느 지점에서 원래의 트레이드 아이디어가 무효가 되는지 몰랐습니다. 가까운 수익을 확보해야 할지 더 큰 움직임을 기다려야 할지 판단하기 어려웠습니다. 현재 setup이 정말 강한지 아니면 단지 새로운 거래를 억지로 찾고 있는지도 확신하기 어려웠습니다. 골드는 매우 빠르게 움직입니다. 명확한 계획이 없다면 좋은 분석도 몇 초 만에 나쁜 결정으로 바뀔 수 있습니다. ZORYK는 이 문제를 해결하기 위해 개발되었습니다.
Neuro Poseidon MT5
Daria Rezueva
4.75 (52)
Neuro Poseidon is a new indicator by Daria Rezueva. It combines precise trading signals with adaptive TP/SL levels - creating best possible trades as a result! Message me and get  Neuro Poseidon Assistant  as a gift to automize your trading process! What makes it stand out? 1. Proven profitability on all assets and timeframes 2. Only confirmed BUY and SELL signals present on the chart 3. Adaptive TP & SL levels generated by the software for each trade 4. Easy to understand - suitable for al
M1 Sniper MT5
Oleg Rodin
5 (7)
M1 SNIPER 는 사용하기 쉬운 거래 지표 시스템입니다. M1 시간대에 맞춰 설계된 화살표 지표입니다. 이 지표는 M1 시간대 스캘핑을 위한 단독 시스템으로 사용할 수 있으며, 기존 거래 시스템의 일부로도 사용할 수 있습니다. 이 거래 시스템은 M1 시간대 거래용으로 특별히 설계되었지만, 다른 시간대에도 사용할 수 있습니다. 원래는 XAUUSD와 BTCUSD 거래를 위해 이 방법을 설계했지만, 다른 시장 거래에도 유용하다는 것을 알게 되었습니다. 이 지표의 신호는 추세 방향과 반대로 거래될 수 있습니다. 저는 지표의 신호를 활용하여 양방향으로 거래할 수 있도록 돕는 특별한 거래 기법을 알려드립니다. 이 방법은 특별한 동적 지지선과 저항선 가격 영역을 활용하는 것을 기반으로 합니다. 구매하시면 M1 SNIPER 화살표 지표를 바로 다운로드하실 수 있습니다. 또한, 아래 스크린샷에 표시된 Apollo Dynamic SR 지표는 M1 SNIPER 도구를 사용하는 모든 사용자에게 무료로
Gann Made Easy MT5
Oleg Rodin
5 (10)
Gann Made Easy 는 mr.의 이론을 사용하여 최고의 거래 원칙을 기반으로 하는 전문적이고 사용하기 쉬운 Forex 거래 시스템입니다. W.D. 간. 이 표시기는 Stop Loss 및 Take Profit Levels를 포함하여 정확한 BUY 및 SELL 신호를 제공합니다. PUSH 알림을 사용하여 이동 중에도 거래할 수 있습니다. 구매 후 거래 방법 안내 및 유용한 추가 지표를 무료로 받으시려면 저에게 연락주세요! 아마도 Gann 거래 방법에 대해 이미 여러 번 들었을 것입니다. 일반적으로 Gann의 이론은 초보자 거래자뿐만 아니라 이미 거래 경험이 있는 사람들에게도 매우 복잡한 것입니다. Gann의 거래 방식은 이론적으로 적용하기 쉽지 않기 때문입니다. 나는 그 지식을 연마하고 Forex 지표에 최고의 원칙을 적용하기 위해 몇 년을 보냈습니다. 표시기는 적용하기가 매우 쉽습니다. 차트에 첨부하고 간단한 거래 권장 사항을 따르기만 하면 됩니다. 지표는 지속적으로 시장 분석
SMC Intraday Formula
VividMind Digital Solutions
5 (25)
먼저 솔직하게 말하겠습니다. 어떤 인디케이터도 단독으로 당신을 수익성 있게 만들어주지 않습니다. 누군가 그렇게 말한다면, 그는 당신에게 꿈을 파는 것입니다. 완벽한 매수/매도 화살표를 보여주는 모든 인디케이터는 완벽하게 보이도록 만들 수 있습니다 — 단지 올바른 과거 구간을 확대하고 승리한 거래만 캡처하면 됩니다. 우리는 그렇게 하지 않습니다.  SMC Intraday Formula는 도구입니다. 시장 구조를 읽고, 가장 높은 확률의 가격 구간을 표시하며, 현재 스마트 머니의 흐름이 어떻게 보이는지 아주 단순한 언어로 보여줍니다. 최종 결정은 여전히 당신이 합니다. 실행도 당신이 합니다. 하지만 이제는 희망이 아니라 정확성으로 거래하게 됩니다. 우리는 이 인디케이터를 지난 약 3년 동안 골드(XAUUSD) 및 주요 외환 통화쌍의 데이 트레이딩 스캘핑에 사용해 왔습니다. M1, M5, M15, M30에서 우리의 핵심 도구입니다. 이 도구는 미래를 예측하려 하지 않습니다 — 지금 형성
GoldenX Entry MT5
VividMind Digital Solutions
5 (16)
GoldenX Entry는 MT5용 인디케이터로, 적응형 Smart Entry Trend 알고리즘, 신호 스코어링 시스템, 시장 레짐 감지 기능, 그리고 변동성 필터를 포함합니다. 각 신호에는 계산된 진입 레벨, 3개의 익절(TP1, TP2, TP3) 레벨, 그리고 손절(Stop-Loss) 레벨이 포함됩니다. 이 인디케이터는 다양한 시장 환경에 적응하도록 설계된 다중 분석 레이어 구조 위에 구축되어 있으며, 내장 최적화기와 통계 추적 시스템을 결합합니다. 또한 Risk-to-Reward(RR) 지표와 과거 거래 행동 기반의 정량 분석을 제공합니다. 시작은 간단합니다 — 선택한 타임프레임에서 최적화기를 실행한 뒤 차트에서 바로 인디케이터를 사용하면 됩니다. 핵심 기능 GoldenX Entry는 하나의 차트에서 신호 엔진, 트레이드 관리 기능, 그리고 과거 통계 추적을 통합합니다: - 내장 최적화기: 최적화기는 차트에서 원클릭으로 실행됩니다. 200개의 파라미터 조합을 두 단계 탐색
Entry Points Pro for MT5
Yury Orlov
4.52 (151)
전설이 돌아왔습니다: Entry Points Pro 10. MQL5 마켓 Top-3 자리를 3년간 지켜온 전설적인 지표의 재출시입니다. 수백 개의 호평 리뷰(두 버전 합산 589개), 매일 이 지표로 거래하는 수천 명의 트레이더, 31,000회 이상의 데모 다운로드   MT4+MT5 . 지난 5년간 여러분이 남긴 리뷰를 하나도 빠짐없이 읽었고, 약속 대신 그 답을 버전 10에 담았습니다. 1999년부터 시장에서 활동하며 정직함과 자신의 평판, 그리고 고객을 소중히 여기는 개발자가 만들었습니다. Entry Points Pro의 진입 시그널은 절대 리페인팅되지 않습니다. 그리고 이번에는 개발자의 말뿐이 아니라 검증 가능한 사실입니다: 확정 시그널은 캔들 종가에서만 표시되며, 자동화 테스트에서 리페인팅 0건 이 확인되었습니다(EURUSD, XAUUSD, BTCUSD에서 2,486,568회의 불변조건 검사 — 위반 0건). 검증 방법은 공개되어 있으니 전략 테스터에서 직접 재현해 보실 수
Unix Scalper
Issam Kassas
4 (4)
UNIX SCALPER — 특별 혜택 매매 기회를 찾고, 거래 계획을 확인하고, 실행 방법을 선택하세요. MT5용 UNIX Scalper를 99 USD에 구매하면 신호 자동매매에 사용할 수 있는 Smart Universal Expert Advisor를 무료로 받으실 수 있습니다. UNIX Scalper는 시장 분석, BUY/SELL/WAIT 판단, Entry, Stop Loss, TP1 및 TP2 가격 수준을 하나의 정돈된 패널에 제공합니다. 거래 계획에 따라 수동으로 매매하거나, 포함된 EA를 연결하여 선택한 설정에 따라 자동으로 실행할 수 있습니다. 현재 가격인 99 USD는 앞으로 30건의 구매에 적용됩니다. 이후 가격은 149 USD로 인상됩니다. 전체 패키지 구성 구매 시 다음 항목이 포함됩니다. • MT5용 UNIX Scalper. • Smart Universal Expert Advisor — 무료. • UNIX Scalper 전체 PDF 사용자 매뉴얼. • UNIX
새로운 왕의 등장 - 인디케이터 + 주문 관리 표시(TP1 + TP2 + TP3) + 선택형 텔레그램 시그널 전송 기능 포함 (무료) (완전한 트레이딩 및 시그널 시스템) 골드를 위한 최고의 EA: Gold Slayer 이 인디케이터는 고급 전략, 사용자 지정 가능한 주문 관리 시스템, 그리고 엔벨로프 확장을 결합한 평균 회귀(mean reversion) 시스템을 포함하고 있습니다. 또한 RSI와 같은 여러 지능형 확인 필터를 통해 높은 확률의 반전 진입 구간을 포착하여 BUY 및 SELL 시그널을 제공합니다. 단순히 거래 방법만 배우는 것이 아니라, 여러 포지션을 효과적으로 관리하고 이전에 수익 중인 오픈 포지션으로 손실 거래를 커버하는 방법까지 익힐 수 있습니다. M5 전용으로 설계 및 최적화되었으며, 유동성이 풍부해 시그널이 더 깔끔하고 신뢰도 높은 BTCUSD와 XAUUSD에서 뛰어난 성능을 발휘합니다. 이 인디케이터는 ATR 기반으로 자동 계산된 진입가, 손절가, 익절가와
Auto Optimized SpeedAngle 은 지속적인 워크포워드 최적화(Walk-Forward Optimization, WFO)를 통해 곡선 적합(curve-fitting)을 제거한 기관 수준의 모멘텀 벡터화 시스템입니다. 시장 체제가 바뀔 때 성능이 떨어지는 정적 입력에 의존하는 대신, 이 지표는 표본 외(Out-of-Sample, OOS) 검증을 사용하여 매개변수를 동적으로 재보정하며, 표시되는 신호가 과거의 우연이 아닌 진정한 통계적 우위를 나타내도록 보장합니다. 핵심 기관용 프레임워크 워크포워드 최적화 엔진: 핵심 알고리즘은 수천 가지의 룩백(lookback) 및 임계값 조합을 지속적으로 스캔하며, 데이터를 인샘플(in-sample)과 표본 외(out-of-sample) 세트로 엄격하게 분리합니다. 미지의 데이터 환경에서 수학적 우수성이 증명된 경우에만 새로운 매개변수 구성을 채택합니다. 정량적 목적 함수: 순수한 총이익을 쫓는 대신, 최적화 엔진은 기관 수준의 안정성
FiboSniper Pro
Van Minh Nguyen
5 (3)
FiboSniper Pro – Multi-Filter Fibonacci System with Auto SL/TP and Control Panel FiboSniper Pro는 동적 Fibonacci Envelopes와 여러 확인 필터를 결합하여 선별된 Buy 및 Sell 신호를 생성하는 기술적 지표입니다. Fibonacci 레벨은 Moving Average와 ATR을 기반으로 계산된 후 ADX, EMA, RSI, ATR, Volume, Time 및 Candle 구조를 통해 필터링됩니다. 이 지표는 ATR 기반의 자동 Stop Loss 및 Take Profit 레벨을 차트에 직접 표시하며, 빠른 설정 조정을 위한 인터랙티브 Control Panel을 제공합니다. 구매 후 권장 설정 파일과 자세한 사용 방법을 받으려면 저에게 문의해 주세요. Auto Trader X를 사용하여 FiboSniper Pro 신호를 자동화할 수 있습니다: [Auto Trader X] User Guide 및 Se
Welcome to ENTRY IN THE ZONE AND SMC MULTI TIMEFRAME /  Official Website: https://www.fableedge.net Entry In The Zone and SMC Multi Timeframe is a real-time market analysis tool based on Smart Money Concepts (SMC), designed to analyze market structure, price direction, and key trading zones. It supports both Single-Timeframe Analysis and Multi-Timeframe Analysis, providing a clearer view of the overall market structure across multiple timeframes, with real-time BUY / SELL signals that do not rep
Atomic Analyst MT5
Issam Kassas
4.47 (60)
ATOMIC ANALYST — 특별 혜택 시장 분석 도구, 자동매매 EA, 교육과 지원을 하나로. MT5용 Atomic Analyst를 99 USD에 구매하고, 지표의 신호를 자동매매에 활용할 수 있는 Smart Universal Expert Advisor를 무료로 받으세요 . Atomic Analyst는 가격 움직임 분석, 추세 방향, 진입·청산 신호, 손절 수준, 여러 익절 수준을 차트에 모아 보여줍니다. 분석을 참고해 수동으로 거래하거나, 포함된 EA를 연결하여 선택한 설정에 따라 자동으로 거래를 실행할 수 있습니다. 현재 가격인 99 USD는 앞으로 이루어지는 30건의 구매에 적용됩니다. 이후 가격은 149 USD로 인상됩니다. 전체 패키지 구성 구매 시 다음 항목이 포함됩니다. • MT5용 Atomic Analyst. • Smart Universal Expert Advisor — 무료. • 전체 Atomic Analyst PDF 사용자 설명서. • Atomic Ana
Tokyo mt5 Indicator
Vasiliy Strukov
5 (2)
Tokyo Indicator는 추세 방향, 잠재적 거래 신호 및 시장 상황을 명확하고 시각적으로 보여줍니다. 색상으로 구분된 계단식 추세선은 강세 구간(파란색)과 약세 구간(자홍색)을 명확히 구별해 줍니다. 추세가 전환될 때 나타나는 방향성 화살표는 잠재적인 매수 및 매도 기회를 강조하여 보여줍니다. 통합 대시보드는 현재 신호, 시장 성향(bias), 모멘텀, 변동성, 신호 품질 등의 정보를 한눈에 파악할 수 있도록 구성되어 있습니다. 이를 통해 트레이더는 별도의 패널을 오갈 필요 없이 가격 움직임(price action)과 지표의 데이터를 동시에 분석할 수 있습니다. 깔끔한 차트 화면과 간결한 시장 개요를 제공하는 Tokyo Indicator는 체계적인 추세 분석과 거래 결정을 지원합니다. 모든 시간대와 다양한 자산(특히 금)에서 활용할 수 있습니다. 추세 방향, 잠재적 거래 신호 및 시장 상황을 명확하고 시각적으로 보여줍니다. 색상으로 구분된 계단식 추세선은 강세 구간(파란색)
Adaptive Price Action Engine 지표를 구매하면 EA(자동매매 프로그램)가 무료 멀티 타임프레임 기반 자기 최적화 추세 & 캔들 패턴 분석 시스템 시장은 끊임없이 변화하며, 모든 Price Action 패턴이 모든 시장 환경에서 동일한 가치를 가지는 것은 아닙니다. Adaptive Price Action Engine 은 변화하는 시장 환경에 적응할 수 있도록 설계되었으며, 추세 구조, 멀티 타임프레임 분석, 캔들 패턴 및 통계적 최적화 를 하나의 분석 프레임워크로 결합합니다. 두 가지 적응형 모드 Dual Alpha Trend Mode 낮은 타임프레임과 높은 타임프레임에서 적합한 Alpha Trend 파라미터를 자동으로 탐색하여, 최근 시장 움직임에 맞춰 추세 분석을 조정합니다. Candlestick + Alpha Mode Alpha Trend를 통한 시장 국면 분석과 22개의 상승 및 하락 캔들 패턴 을 결합합니다. 모든 패턴을 동일하게 취급하는 대신, 다양
Market Structure Order Block Dashboard MT5는 시장 구조와 주요 가격 반응 구역을 차트에서 직접 읽고자 하는 트레이더를 위해 설계된 MT5 지표입니다. BOS, ChoCH, 오더 블록, Fair Value Gap (FVG), 유동성, Kill Zones, Volume Profile 그리고 빠른 분석을 위한 콤팩트한 대시보드를 결합합니다. 이 지표는 시장 구조, ICT 및 Smart Money 개념을 의사결정 프레임워크로 사용하는 트레이더를 대상으로 합니다. 추세 지속, 가능한 반전, 가격 불균형, 유동성 타겟 및 관심 구역을 보다 체계적으로 식별하는 데 도움을 줄 수 있습니다. 구매자를 위한 포함 리소스 구매 후 MQL5 개인 메시지로 요청하시면 완전한 PDF 사용 설명서와 파라미터 설정 팁을 제공해 드립니다. MQL5 개인 메시지를 통한 직접 기술 지원. 1.20 버전은 두 가지 주요 추가 기능을 제공합니다: Pending BOS / Pending
SMART PRICE ACTION CONCEPTS — 특별 혜택 구조를 확인하고, 구간을 파악하고, 거래 계획을 세우세요. MT5용 Smart Price Action Concepts를 49 USD에 구매하면 Smart Universal Expert Advisor를 무료로 받으실 수 있습니다. Smart Money Concepts(SMC), ICT 방식의 분석, 가격 행동 분석을 하나의 정돈된 차트에서 활용하세요. 시장 구조, 오더 블록, 유동성 참고 수준과 불균형을 파악하고, Smart Panel에서 표시할 요소를 선택할 수 있습니다. 현재 가격인 49 USD는 앞으로 30건의 구매에 적용됩니다. 이후 가격은 100 USD로 인상됩니다. 전체 패키지 구성 • MT5용 Smart Price Action Concepts. • Smart Universal Expert Advisor — 무료 보너스. • 전체 PDF 사용자 매뉴얼 및 공식 온라인 강좌. • 단계별 설치 및 설정 안내.
Power Candles MT5
Daniel Stein
4.58 (12)
Power Candles V3 - 자체 최적화 강도 지표 파워 캔들 V3는 적용된 모든 차트에서 통화 및 상품의 강세를 실행 가능한 거래 계획으로 전환합니다. 단순히 캔들에 색상을 입히는 대신, 백그라운드에서 실시간 자동 최적화를 수행하여 현재 보고 있는 종목에 대한 최적의 손절매, 익절 및 신호 임계값을 제공합니다. 한 번의 클릭으로 실시간 거래에 적용할 수 있으며, 진입점, 손절매 및 익절 선이 정확한 가격에 맞춰 차트에 표시되고, 방향과 함께 알림이 발령됩니다. 이 도구는 Stein Investments 에코시스템의 일부입니다. 18개 이상의 도구와 함께 당신의 1대1 AI 트레이딩 멘토 Max.  항상 대기 중, 모든 인디케이터를 깊이 있게 이해, 무언가를 차근차근 생각해보고 싶은 순간에 도움을 줍니다.  https://stein.investments 에서 만나보세요 매 종가 바마다 3,000회 이상의 트레이딩 시뮬레이션. 9가지 강도 상태. 2가지 전략을 병렬로 테스트.
FX Power MT5 NG
Daniel Stein
5 (33)
FX Power: 통화 강세 분석으로 더 스마트한 거래 결정을 개요 FX Power 는 어떤 시장 상황에서도 주요 통화와 금의 실제 강세를 이해하기 위한 필수 도구입니다. 강한 통화를 매수하고 약한 통화를 매도함으로써 FX Power 는 거래 결정을 단순화하고 높은 확률의 기회를 발견합니다. 트렌드를 따르거나 극단적인 델타 값을 사용해 반전을 예측하고자 한다면, 이 도구는 귀하의 거래 스타일에 완벽히 적응합니다. 단순히 거래하지 말고, FX Power 로 더 스마트하게 거래하세요. 1. FX Power가 거래자에게 매우 유용한 이유 통화와 금의 실시간 강세 분석 • FX Power 는 주요 통화와 금의 상대적 강세를 계산하고 표시하여 시장 역학에 대한 명확한 통찰력을 제공합니다. • 어떤 자산이 앞서고 있고 어떤 자산이 뒤처지는지 모니터링하여 보다 현명한 거래 결정을 내릴 수 있습니다. 포괄적인 멀티 타임프레임 뷰 • 단기, 중기 및 장기 타임프레임에서 통화와 금의 강세를
FX Trend MT5 NG
Daniel Stein
5 (6)
FX Trend NG: 차세대 멀티 마켓 트렌드 인텔리전스 개요 FX Trend NG 는 다중 시간 프레임 기반의 전문 트렌드 분석 및 시장 모니터링 도구입니다. 몇 초 만에 전체 시장 구조를 파악할 수 있도록 설계되었습니다. 여러 차트를 일일이 전환할 필요 없이, 어떤 종목이 추세에 있는지, 어디에서 모멘텀이 약화되고 있는지, 그리고 어떤 시간 프레임이 서로 정렬되어 있는지 즉시 확인할 수 있습니다. 출시 기념 특별 혜택 – FX Trend NG 를 $30 (6개월) 또는 $80 평생 라이선스 로 이용할 수 있습니다. 이미 Stein Investments 고객이신가요? -> 메시지를 보내 전용 고객 그룹에 참여하세요. 설정이나 사용 방법이 필요하신가요? -> Stein Investments 공식 페이지 를 방문하세요. 1. FX Trend NG가 특별한 이유 3단계 추세 로직 – 단순한 Buy / Sell이 아닙니다 • 대부분의 지표는 Buy 또는 Sell 두 가지 상태만 제
통화 강도 마법사는 성공적인 거래를 위한 올인원 솔루션을 제공하는 매우 강력한 지표입니다. 표시기는 여러 시간 프레임의 모든 통화 데이터를 사용하여 이 또는 해당 외환 쌍의 힘을 계산합니다. 이 데이터는 특정 통화의 힘을 확인하는 데 사용할 수 있는 사용하기 쉬운 통화 지수 및 통화 전력선의 형태로 표시됩니다. 필요한 것은 거래하려는 차트에 표시기를 부착하는 것뿐입니다. 표시기는 거래하는 통화의 실제 강세를 보여줍니다. 지표는 또한 추세와 거래할 때 유리하게 사용할 수 있는 구매 및 판매 거래량 압력의 극한값을 보여줍니다. 지표는 또한 피보나치에 기반한 가능한 대상을 보여줍니다. 표시기는 PUSH 알림을 포함한 모든 유형의 알림을 제공합니다. 구매 후 연락주세요. 나는 당신과 거래 팁을 공유하고 당신에게 무료로 훌륭한 보너스 지표를 줄 것입니다! 나는 당신에게 행복하고 유익한 거래를 기원합니다!
Volatility Master for MetaTrader is a real-time dashboard tool that scans up to  50 symbols  to identify high-volatility , trending markets instantly. With bullish/bearish signals, customizable alerts, and a user-friendly interface, it helps you avoid range-bound conditions and focus on high-probability trades. Clarity leads to confidence. Trade confidently and protect your capital effectively with this powerful dashboard. We don't offer free or bonus indicators in exchange of reviews from you.
M1 Quantum MT5
Hamed Dehgani
4.2 (10)
M1 Quantum을 이용한 실시간 트레이딩 신호 : 신호   ( Quantum Trade Assistant 에 의해 거래가 자동으로 실행되며, 이 제품에 무료 로 포함되어 있습니다.) 최신 소식: 버전 1.64가 출시되었습니다. 이제 모든 거래에는 해당 지지/저항 구간 뒤에 Stop Loss가 설정됩니다. 또한 이번 버전에서는 EA의 성능을 향상시키기 위해 Smart Close 기능이 개선되었습니다. 8월 9일부터 라이브 신호는 버전 1.64로 운영되고 있습니다. 가격 계획: 현재 가격: $169 (얼리 어답터 혜택) 다음 예정 가격: $189 예정 소매 가격: $299 개발자 안내: 구매 후 저에게 연락하시면 최신 권장 설정 파일(Set File) , 사용 팁, 그리고 다른 M1 Quantum 사용자들과 소통할 수 있는 VIP 지원 그룹 초대장을 받으실 수 있습니다. 자주 묻는 질문 - 설정 파일 - 설치 가이드 M1 Quantum 은 M1 전용 전문 트레이딩 시스템으로, 손
PZ Trend Trading MT5
PZ TRADING SLU
3.8 (5)
Capture every opportunity: your go-to indicator for profitable trend trading Trend Trading is an indicator designed to profit as much as possible from trends taking place in the market, by timing pullbacks and breakouts. It finds trading opportunities by analyzing what the price is doing during established trends. [ Installation Guide | Update Guide | Troubleshooting | FAQ | All Products ] Trade financial markets with confidence and efficiency Profit from established trends without getting whips
Scalper Vault 는 성공적인 스캘핑에 필요한 모든 것을 제공하는 전문 스캘핑 시스템입니다. 이 표시기는 외환 및 바이너리 옵션 거래자가 사용할 수 있는 완전한 거래 시스템입니다. 권장 시간 프레임은 M5입니다. 시스템은 추세 방향으로 정확한 화살표 신호를 제공합니다. 또한 상단 및 하단 신호와 Gann 시장 수준을 제공합니다.  이 시스템은 사용하기가 매우 쉽습니다. 원하는 시장 지역의 화살표만 따라가면 됩니다. 엑시트는 가격이 적정 수준에 도달하거나 시장의 고점 또는 저점 신호가 나타날 때 수행됩니다.  표시기는 PUSH 알림을 포함한 모든 유형의 경고를 제공합니다. 인디케이터 구매 후 연락주세요. 내 개인 거래 권장 사항과 훌륭한 보너스 지표를 무료로 공유합니다! 나는 당신에게 행복하고 유익한 거래를 기원합니다!
IQ FX Gann Levels a precision trading indicator based on W.D. Gann’s square root methods . It plots real-time, non-repainting support and resistance levels to help traders confidently spot intraday and scalping opportunities with high accuracy. William Delbert Gann (W.D. Gann) was an exceptional market analyst, whose trading technique was based on a complex blend of mathematics, geometry, astrology, and ancient mathematics which proved to be extremely accurate. We don't offer free or bonus indic
제작자의 제품 더 보기
Boleta de Controle Forex
Renato Aparecido Braguini
Painel de Controle – Boleta Inteligente para Forex Descrição Geral do Sistema: Apresentamos o   Painel de Controle – Boleta Inteligente para Forex , a ferramenta definitiva para traders que exigem agilidade, precisão e controle total sobre suas operações no mercado Forex. Com uma interface intuitiva e altamente funcional, este painel transforma sua plataforma MetaTrader em um centro de comando profissional, permitindo que você execute ordens, gerencie risco e monitore seus resultados em tempo re
FREE
Boleta Brasileira B3
Renato Aparecido Braguini
Boleta para operações Long & Short na bolsa Brasileira B3 para operações em ações, mini-indice e mini-dolar com lotes ajustaveis; Possui botões de COMPRA, VENDA e FECHAR TODAS AS OPERAÇÕES; Podem ser definidos Ganhos (TakeProfit) e perdas (StopLoss), além do controle do StopMóvel (configuravel); É possível determinar quantidade de operações por dia; Existe um painel informativo com lucro ou prejuízo diário. É possível determinar os horários de início e término das operações quando selecion
FREE
Boleta Agil B3
Renato Aparecido Braguini
Sobre a Boleta Ágil – Descrição Completa Apresentamos a   Boleta Ágil , um painel de negociação completo e altamente personalizável para   MetaTrader 5 . Desenvolvida para traders que exigem   velocidade, precisão e flexibilidade , esta ferramenta coloca o controle total das suas operações na palma da sua mão — diretamente no gráfico. Com uma interface moderna e intuitiva, você executa ordens, gerencia riscos e ajusta estratégias em tempo real, sem perder tempo com menus complicados. Botões
FREE
Indicador Flash 4 em 1
Renato Aparecido Braguini
MultiForça 4 em 1 (MACD + Bulls + Bears + Média 50). Descrição Geral O   MultiForça 4 em 1   é um indicador sintético de análise técnica que reúne em um único painel quatro ferramentas essenciais para identificação de tendência e momento do ativo: MACD (Moving Average Convergence Divergence)   – tendência e momentum. Bulls Power   – força dos compradores. Bears Power   – força dos vendedores. Média Exponencial de 50 períodos (EMA 50)   – direção da tendência de médio prazo. Cada um desses
FREE
Painel Indicador MACD
Renato Aparecido Braguini
️ Aviso de Risco Negociar no mercado financeiro envolve riscos significativos. Esta ferramenta é um auxílio à tomada de decisão e não garante  lucros. Opere com responsabilidade e sempre com gerenciamento de risco adequado. O painel do indicador MACD utiliza como base uma das três possíveis configurações a seguir :  1. Cruzamento das Linhas (MACD x Linha de Sinal); -  Sinal de Compra (Alta): Ocorre quando a Linha MACD cruza de baixo para cima a Linha de Sinal.  -  Sinal de Venda (Baixa): Ocorr
FREE
Indicador Flash MACD
Renato Aparecido Braguini
️ Aviso de Risco Negociar no mercado financeiro envolve riscos significativos. Esta ferramenta é um auxílio à tomada de decisão e não garante lucros. Opere com responsabilidade e sempre com gerenciamento de risco adequado. Atenção : Testado em timeframe de 2 minutos e no mini-indice da B3 do Brasil. Elimine falsos sinais do MACD com confirmação da força do candle em tempo real. Este indicador avançado gera sinais de COMPRA (seta azul) e VENDA (seta vermelha) apenas quando o MACD cruza a linha d
FREE
Flash counter
Renato Aparecido Braguini
Candle Timer - Indicador de Contagem Regressiva O   Candle Timer   é um indicador para MetaTrader 5 que exibe um contador regressivo mostrando o tempo restante até o fechamento do candle atual. O indicador é altamente personalizável e permite ajustar sua aparência e posicionamento na tela. Funcionalidades Principais Contagem regressiva em tempo real do candle atual Suporte a todos os timeframes (M1, M5, M15, M30, H1, H4, D1, W1, MN) Atualização automática a cada segundo Posicionamento d
FREE
Painel Inteligente B3
Renato Aparecido Braguini
Painel Inteligente B3 – Monitoramento e Troca Rápida de Ativos para MetaTrader 5 O Painel Inteligente B3 é um utilitário essencial para quem opera no mercado brasileiro (Ações, FIIs, BDRs, ETFs e Contratos Futuros). Ele foi projetado para otimizar o acompanhamento do mercado em tempo real e agilizar a navegação entre ativos diretamente na tela do seu MetaTrader 5. Com uma interface moderna e altamente personalizável, o painel elimina a necessidade de trocar manualmente o símbolo do gráfico ou ab
Suporte e Resistencia Agil
Renato Aparecido Braguini
️ Aviso de Risco Negociar no mercado financeiro envolve riscos significativos. Esta ferramenta é um auxílio à tomada de decisão e não garante lucros. Opere com responsabilidade e sempre com gerenciamento de risco adequado. Caracteristicas deste Super Indicador de Topos e Fundos : - Analisa as últimas barras (configurável) e detecta topos e fundos; - Agrupa pivôs próximos em um único nível, usando uma tolerância baseada no range médio das barras.; - Níveis abaixo do preço atual viram suportes e
FREE
필터:
리뷰 없음
리뷰 답변