Suporte e Resistencia

⚠️ Aviso de Risco Negociar no mercado financeiro envolve riscos significativos. Esta ferramenta é um auxílio à tomada de decisão e não garante lucros. Opere com responsabilidade e sempre com gerenciamento de risco adequado.

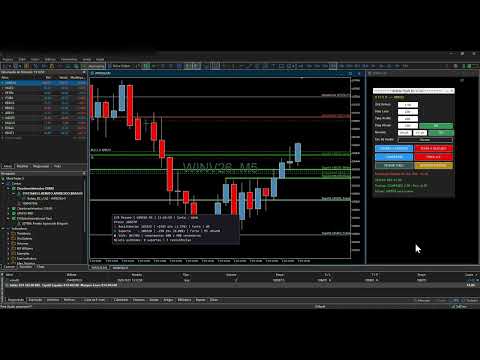
Caracteristicas deste Super Indicador de Topos e Fundos :

- Analisa as últimas barras (configurável) e detecta topos e fundos;

- Agrupa pivôs próximos em um único nível, usando uma tolerância baseada no range médio das barras.;

- Níveis abaixo do preço atual viram suportes e níveis acima viram resistências. Se um suporte é rompido, ele passa a ser resistência na próxima barra;

- A força de cada nível vem do volume (tick volume) das barras que tocaram a zona.

O volume de cada barra é dividido em comprador e vendedor conforme onde ela fechou entre a mínima e a máxima. No suporte conta o volume comprador, na resistência o vendedor. O total é comparado ao volume médio por barra e normalizado entre as linhas exibidas.

Cores por força :

- Suportes (compradores): verde escuro (forte), verde-limão (médio) e verde claro (fraco);

- Resistências (vendedores): vermelho escuro (forte), laranja-avermelhado (médio) e rosa claro (fraco);

- Forte é força ≥ 66%, média ≥ 33%, e fraca abaixo disso. A espessura da linha também aumenta com a força;

- O rótulo à direita mostra o preço, a classe de força, o percentual do lado dominante e o número de toques.

O indicador recalcula a cada nova barra. Em forex o volume usado é o de ticks, então a força é uma aproximação.

Além do gráfico atual (por exemplo M5), o indicador analisa o H1 e o H4 (configuravel) com a mesma lógica de rejeições e mostra só os níveis fortes deles.

As linhas dos timeframes maiores aparecem tracejadas e mais grossas.

O rótulo leva o prefixo do timeframe, como [H1] , e fica abaixo da linha, para não se misturar com os rótulos do gráfico atual, que ficam acima.

Quando um nível do gráfico atual cai dentro da zona de um nível forte do H1 ou do H4, ele é marcado como confluência:

a força dele recebe um bônus (+50% por timeframe, configurável), então tende a subir de faixa de cor, a linha fica um ponto mais grossa, o rótulo mostra, por exemplo, confluência H1+H4.

Timeframes iguais ou menores que o do gráfico são ignorados, e o indicador registra um aviso. No H4, por exemplo, nem o H1 nem o H4 entram.

Se os dados de outro timeframe ainda não estiverem carregados, o indicador tenta de novo a cada 5 segundos até conseguir, e depois volta a recalcular só em nova barra.

O painel pode ser movido com o mouse. Ele também já abre no canto inferior esquerdo.
おすすめのプロダクト
O Indicador identifica relação do Índice com a soma dos principais ativos, funciona para qualquer mercado do mund o, possui um oscilador WPR com a soma dos principais ativos escolhidos, indicando a antecipação do movimento em relação ao Índice. Características WPR com a soma dos papéis escolhidos - branco WPR do papel atual - vermelho Canal de Tendência O indicador pode indicar movimento de entradas, sendo: cruzamento das linhas cruzamento da linha Multi Symbols no -50 cruzamento entre os canai
FREE
Marca Dagua
Erison Francisco De Sales
3 (1)
Adiciona marca d'água com nome do ativo em negociação. Pode ser ajustado definindo tamanho da fonte e coloração do texto. Testado com vários ativos do mercado B3 e Forex  Adione ao gráfico e configure de acordo com a necessidade. Caso tenha problemas sinta-se a-vontade para nos avisar e providenciaremos a correção logo que possível. ______________________________
FREE
ピボットポイントフィボRSJは、フィボナッチレートを使用してその日のサポートラインとレジスタンスラインを追跡するインジケーターです。 この壮大な指標は、フィボナッチレートを使用してピボットポイントを通じて最大7レベルのサポートとレジスタンスを作成します。 価格がこのサポートとレジスタンスの各レベルを尊重する方法は素晴らしいです。そこでは、オペレーションの可能な入口/出口ポイントを認識することができます。 特徴 最大7レベルのサポートと7レベルの抵抗 レベルの色を個別に設定します 入力 ピボットタイプ ピボットフィボRSJ1 =フィボ比1の計算 ピボットフィボRSJ2 =フィボ比2の計算 ピボットフィボRSJ3 =フィボ比3の計算 ピボットフィボクラシック=クラシックピボット計算 最小ピボットレベル ピボット3レベル ピボット4レベル ピボット5レベル ピボット6レベル ピボット7レベル それでも質問がある場合は、ダイレクトメッセージで私に連絡してください: https://www.mql5.com/ja/users/robsjunqueira/
FREE
Weis Wave Double Side
Eduardo Da Costa Custodio Santos
The Weis Wave Bouble Side Indicator for MT5 is part of the toolkit (Wyckoff Academy Wave Market) The Weis Wave Bouble side Indicator for MT5 was created based on the already established Weis Wave created by David Weis. The Weis Wave Double Side indicator reads the market in waves as it was done by R. Wyckoff in 1900. It helps in the identification of effort x result, cause and effect, and Supply and demand Its differential is that it can be used below the zero axis, further improving plus operat
Heiken_Ashi_Bars - MT5用 高度なトレンド可視化ツール 概要 Heiken_Ashi_Bars は、市場のノイズを取り除き、真のトレンドを浮き彫りにするために設計された、強力で視覚的に直感的なカスタムインジケーターです。従来のローソク足チャートは不規則な動きが多く、ダマシのシグナルにつながることがよくあります。価格データを平均化することで、このインジケーターはプライスアクションを滑らかにし、トレンドの継続、反転、および利益の出るエントリーポイントを非常に簡単に見つけることができます。 主な機能と利点 究極のノイズリダクション: 小さな価格のスパイクや持ち合いのノイズをフィルタリングします。 明確な視覚的シグナル: 色分けされたバーにより、強気および弱気のモメンタムを一目で確認できます。 リペイントなし (No Repaint): バーが確定するとシグナルは固定され、過去のバーを再計算しません。 高度に最適化: ターミナルの遅延をゼロにするクリーンなコード。 多用途: すべての金融商品 (FX、インデックス、貴金属、仮想通貨) で完璧に機能します。 トレード方法 上昇
FREE
White Weis Volume This indicator shows the sum of the volume in each wave, bulish or bearish, as idealized by David Weis , but it brings an important addition , which is the marking of the bar with the highest volume of the wave (White Bar)! In coding the indicator, it was sought to optimize the code to require minimal processing during use and not to overload mt5. The indicator can be used for pre-trading analysis and study, where the trader analyzes possible points of support and resistance
High Low Open Close
Alexandre Borela
4.98 (45)
このプロジェクトが好きなら、5つ星レビューを残してください。 このインジケータは、指定されたためのオープン、ハイ、ロー、クローズ価格を描画します 特定のタイムゾーンの期間と調整が可能です。 これらは、多くの機関や専門家によって見られた重要なレベルです トレーダーは、彼らがより多くのかもしれない場所を知るために有用であり、 アクティブ。 利用可能な期間は次のとおりです。 前の日。 前週。 前の月。 前の四半期。 前年。 または: 現在の日。 現在の週。 現在の月。 現在の四半期。 現年。
FREE
WAPV Weis Wave Chart Forex
Eduardo Da Costa Custodio Santos
The Weis Wave Chart Forex for MT5 is a Price and Volume indicator. The Price and Volume reading was widely disseminated through Richard Demille Wyckoff based on the three laws created by him: Supply and Demand, Cause and Effect and Effort vs. Result. In 1900 R.Wyckoff already used the wave chart in his analyses. Many years later, around 1990, David Weis Automated R. Wyckoff's wave chart and today we bring you the evolution of David Weis' wave chart. It shows the amount of Volume and the amount o
This is Gekko's Cutomized Cutomized Average Directional Index (ADX), a customized version of the famous ADX indicator. Use the regular ADX and take advantage two entry signals calculations and different ways of being alerted whenever there is potential entry or exit point. Inputs Period: Period for the ADX calculation; PlotSignalType: How will the indicator calculate entry (swing) signals: 1- ShowSwingsOnTrendLevel : Show Signals for Trend Confirmation Swings; 2- ShowSwingsOnTrendLevelDirection
この製品を気に入っていただけましたら、コメントと評価をお忘れなく! Advanced Market Cipher B Advanced Market Cipher B は、 MetaTrader 5 向けに開発された高度なインジケーターで、 モメンタム、マーケットフロー、トレンド、ダイバージェンス を1つのツールで総合的に分析できるよう設計されています。 このインジケーターは、TradingViewでvumanchuによって公開された 「VuManChu Cipher B + Divergences」 のコンセプトと視覚構造をベース としており、主要なコンセプトをMetaTrader 5環境に適応するとともに、追加機能、視覚的な改善、独自機能を組み込んでいます。 Advanced Market Cipher B の目的は、さまざまなテクニカル情報を1つのウィンドウにまとめ、トレーダーが モメンタム、強さ、フロー、トレンド、ダイバージェンス の関係をより明確に確認できるようにすることで、マーケットの動きに起こり得る変化を把握しやすくすることです。 主なコンポーネント • WaveTren
FREE
This is a buyer and seller aggression indicator that analyzes the shape of each candle and project this data in a histogram form. There are 4 histograms in one. On the front we have two: Upper - Buyer force. Lower - Seller force. At the background we also have two histogram, both with same color. They measure the combined strenght of buyers and sellers. This histograms can be turned off in Input Parameters. It is also possible to have the real or tick volume to help on this force measurement. IN
FREE
Midas VWAP
Paulo Henrique Faquineli Garcia
4 (2)
Volume Weighted Average Price (VWAP) is a trading benchmark commonly used by Big Players that gives the average price a Symbol has traded throughout the day. It is based on both Volume and price. This indicator contains Daily VWAP and MIDAS' VWAP, which means you are able to anchor the beggining of MIDAS' calculations and, therefore you will be able to use this methodology to study price versus volume moves after anchor point. You will be able to anchor up to 3 HIGH MIDAS VWAP's and 3 LOW. Wish
FREE
Reversal Oscillator — Advanced Momentum Shift Detector Reversal Oscillator is a free indicator designed to highlight price zones that are statistically outside their normal movement patterns, helping traders anticipate potential turning points before they occur. Unlike traditional oscillators that react mainly to overbought/oversold conditions, this indicator applies third derivative analysis (the "acceleration of the acceleration" of price) calculated using two independent methods within a n
FREE
Donchian Channel is an indicator created by Richard Donchian. It is formed by taking the highest high and the lowest low of the last specified period in candles. The area between high and low is the channel for the chosen period. Its configuration is simple. It is possible to have the average between the upper and lower lines, plus you have alerts when price hits one side. If you have any questions or find any bugs, please contact me. Enjoy!
FREE
Simple Dispersion Zones(シンプル・ディスパージョン・ゾーンズ) は、トレーダーの日々のマーケット分析をサポートするために設計された、シンプルで使いやすく、かつ強力なインジケーターです。 直近の N 本のローソク足の高値と安値をもとに、重要なディスパージョン(分散)ゾーンを計算し、透明な赤い三角形でチャート上に表示します。これにより、重要なトレードエリアを素早く視覚的に把握できます。 トレンドチャネルの描画、レンジ相場の特定、ブレイクアウト戦略の計画など、あらゆる場面で価格の動きを明確かつ効果的に視覚化するのに役立ちます。 シンプルで直感的なインターフェース カスタマイズ可能なパラメーター すべての銘柄・時間足に対応 初心者から上級トレーダーまで幅広く対応 Simple Dispersion Zones を使って、チャート分析をより簡単かつ正確にしましょう。
MSX Hybrid Heiken Scalper Overview MSX Hybrid Heiken Scalper is a MetaTrader 5 indicator based on a modified Heiken Ashi methodology with closed-bar smoothing. The indicator is designed to display trend direction through color-coded candles while reducing sensitivity to short-term market fluctuations. All calculations are performed using completed candles, allowing historical values to remain fixed after bar close. Features • Modified Heiken Ashi calculation • Closed-bar processing • Color-code
FREE
Professional Support and Resistance Indicator This indicator was developed as a market context study and analysis tool , designed to help identify potentially relevant areas on the chart through the combination of price action, volume, and higher-timeframe market structure . The indicator displays two layers of horizontal dashed lines , positioned at areas considered relevant for analysis. This allows traders to observe different support and resistance zones and evaluate their relationship with
Launch price: 30 USD - price will increase after the first purchases, so early buyers lock in this rate. Reversal Magnet Lines plots the closing price of each of the last N trading days (configurable from 15 to 180 days) as horizontal lines directly on the chart. These prior-day close levels frequently act as short-term support and resistance, where price either reverses or breaks through with momentum. Based on an analysis of 52 trading days on JPN225, price interacted with these levels in mo
Caicai L&S Yield Histogram Important Notice: This indicator is an integral tool of the automated EA Caicai Long and Short Pair Trading . This indicator visually displays the percentage deviation (Yield %) of a pair's current spread relative to its own historical mean. It is an excellent tool for quickly visualizing the gross financial potential of a market distortion in Long & Short operations. Main Features: Percentage Visualization: Understand the size of the distortion in palpable percentage
A Média Móvel é um indicador que faz parte da Análise Técnica. Com ela, é possível identificar o equilíbrio dos preços no mercado, observando tendências de alta, neutra ou baixa. Este indicador customizado traz opções extras pera definir o método de cálculo podendo-se esclolher entre SMA,EMA,SSMA,LWMA,JJMA,JurX,ParMA,T3,Vidya,AMA,HULL MA. Também conta com varias opções para escolher o método de cálculo para o preço base a ser usado no cáculo da média.
️ Aviso de Risco Negociar no mercado financeiro envolve riscos significativos. Esta ferramenta é um auxílio à tomada de decisão e não garante  lucros. Opere com responsabilidade e sempre com gerenciamento de risco adequado. O painel do indicador MACD utiliza como base uma das três possíveis configurações a seguir :  1. Cruzamento das Linhas (MACD x Linha de Sinal); -  Sinal de Compra (Alta): Ocorre quando a Linha MACD cruza de baixo para cima a Linha de Sinal.  -  Sinal de Venda (Baixa): Ocorr
FREE
VWAP Anchor Tool
Jackson Mukurani Wanguthi
Anchored VWAP is a lightweight, interactive volume-weighted average price indicator designed for traders who need precision without clutter. Unlike standard VWAP that resets every session, this tool lets you drop up to five custom anchors directly on any candle. Each anchor calculates VWAP from that exact point forward, complete with standard deviation bands to highlight where price may find support or resistance relative to volume. Key Features: • Up to 5 simultaneous anchors — compare multi
FREE
Weis Wave Double Side Alert
Eduardo Da Costa Custodio Santos
The Weis Wave Bouble Side Indicator for MT5 is part of the toolkit (Wyckoff Academy Wave Market) The Weis Wave Bouble side Indicator for MT5 was created based on the already established Weis Wave created by David Weis. The Weis Wave Double Side indicator reads the market in waves as R. Wyckoff did in 1900. It helps in the identification of effort x result, cause and effect, and Supply and demand Its differential is that it can be used below the zero axis and has a breakout alert showing Who is s
FoxWave Volume Suite combines three essential volume-based tools into a single indicator: a horizontal Volume Profile with Point of Control and Value Area, a real-time volume spike detector with instant alerts, and a buy/sell pressure delta gauge. No need to run three separate indicators — everything you need to read volume is in one clean Fox Wave panel. What it does Volume Profile (POC / VAH / VAL) Builds a horizontal histogram showing how much volume traded at each price level over your cho
Price Magnet — Price Density and Attraction Levels Indicator Price Magnet is a professional analytical tool designed to identify key support and resistance levels based on statistical Price Density. The indicator analyzes a specified historical period and detects price levels where the market spent the most time. These zones act as “magnets,” attracting price action or forming a structural base for potential reversals. Unlike traditional Volume Profile tools, Price Magnet focuses on price-time d
VWAP and MVWAP
Flavio Javier Jarabeck
4 (9)
Volume Weighted Average Price (VWAP) is a trading benchmark commonly used by Big Players that gives the average price a Symbol has traded throughout the day. It is based on both Volume and price. Additionally we put in this indicator the MVWAP (Moving Volume Weighted Average Price). For those who do not know the usage and the importance od this indicator I recommend a great article about this subject at Investopedia ( https://www.investopedia.com/articles/trading/11/trading-with-vwap-mvwap.asp )
FREE
IMR is a multi-layered quantitative reversal finder designed for discretionary price-action traders who refuse to trade blind. It does not generate entry signals, nor does it draw buy/sell arrows. Instead, it answers the three questions that matter most before you ever place a limit order: What is the market's statistical DNA right now? (Hurst Exponent) Is the current move backed by genuine strength, or is it exhausted? (ADX) Has price moved too far, too fast, with too much conviction — suggest
FREE
概要 このインジケーターは、クラシックな ドンチャンチャネル を強化したバージョンで、実践的なトレード機能を追加しています。 標準の3本線(上限、下限、中央線)に加え、 ブレイクアウト を検出し、チャート上に矢印で視覚的に表示します。また、チャートを見やすくするために、 現在のトレンド方向と逆側のラインのみを表示 します。 インジケーターの機能: 視覚的シグナル :ブレイクアウト時にカラフルな矢印を表示 自動通知 :ポップアップ、プッシュ通知、Eメール RSIフィルター :市場の相対的な強弱に基づいてシグナルを検証 カスタマイズ可能 :色、ラインの太さ、矢印コード、RSI閾値など 動作原理 ドンチャンチャネルは次のように計算します: 上限線 :直近N本のクローズ済みローソク足の最高値 下限線 :直近N本のクローズ済みローソク足の最安値 中央線 :最高値と最安値の平均値 上方ブレイクアウト は終値が上限線を超えたときに発生し、 下方ブレイクアウト は終値が下限線を下回ったときに発生します。 インジケーターは以下を行います: 3本のドンチャンラインを描画 方向転換後の最初のブレイクアウト
FREE
Expansoes M
Marcus Vinicius Da Silva Miranda
The M Extensions are variations of the Golden Ratio (Fibonacci Sequence). It is the World's first technique developed for Candle Projections. Advantages: Easy to plot. Candle anchoring; High and accurate precision as support and resistance; Excellent Risk x Return ratio; Works in any timeframe; Works in any asset / market.   The M Extensions are classified into: M0: Zero point (starting candle) RC: Initial candle control region M1: Extension region 1 M2: Extension region 2 M3: Extension regi
FREE
How it works –   Base-departure detection — algorithmically finds consolidation bases (overlapping range with compressed volatility) followed by displacement departures. Patterns: Drop-Base-Rally, Rally-Base-Drop, Rally-Base-Rally, Drop-Base-Drop — detected structurally, not by candle names. –   Strength score (0–100) — from departure velocity, time-at-base, freshness (each revisit decays the score), higher-timeframe confluence and origin volume. –   Lifecycle — Fresh, Tested (decaying), Broken
FREE
このプロダクトを購入した人は以下も購入しています
SMART TREND TRADING SYSTEM — 特別オファー トレードシステム、自動化EA、学習コンテンツとサポートをひとつに。 MT5用のSmart Trend Trading Systemを99米ドルでご購入いただくと、シグナルの自動売買に使える Smart Universal Expert Advisorを無料でプレゼント します。 STTSは、トレンドの方向、エントリー・決済シグナル、反転ゾーン、重要な価格水準をチャート上にまとめて表示します。システムを参考に手動で取引することも、付属のEAを接続し、ご自身で選んだ設定に基づいて自動売買することもできます。 現在の99米ドルという価格は、これからの30件の購入に適用されます。その後、価格は149米ドルに上がります。 充実のパッケージ内容 ご購入には以下が含まれます。 • MT5用Smart Trend Trading System。 • Smart Universal Expert Advisor — 無料。 • STTSの完全版PDFユーザーマニュアル。 • STTS公式オンラインコース。 • インストールと
Trend Sniper X
Sarvarbek Abduvoxobov
4.9 (39)
Trend Sniper X は、トレードの方向性と潜在的な反転ポイントを明確かつ正確に特定するのに役立つ、MetaTrader 5 用のマルチタイムフレーム・トレンドフォロー指標です。 MT4用: https://www.mql5.com/en/market/product/193245 価格情報: 現在の価格はプロモーション価格であり、今後のアップデートや新機能のリリースに伴い変更される場合があります。 ボーナス特典: このインジケーター用の無料自動売買アシスタントEAを入手するには、購入後に an 著者(開発者)へメッセージをお送りください。 Code2Profit チャンネル マルチタイムフレーム分析で相場をマスターしよう! Trend Sniper X で勝率を最大化する方法:重要なルールとセッションのコツ 技術仕様 プラットフォーム MetaTrader 5 インジケータータイプ マルチタイムフレーム・トレンドインジケーター 操作タイムフレーム あらゆるチャートタイムフレームに対応。個別に選択可能な上位タイムフレーム (M1–MN1) を搭載 主要銘柄 FX、ゴールド (X
ARIPoint
Temirlan Kdyrkhan
1 (4)
ARIPoint is a powerful trading companion designed to generate high-probability entry signals with dynamic TP/SL/DP levels based on volatility. Built-in performance tracking shows win/loss stats, PP1/PP2 hits, and success rates all updated live. Key Features: Buy/Sell signals with adaptive volatility bands Real-time TP/SL/DP levels based on ATR Built-in MA Filter with optional ATR/StdDev volatility Performance stats panel (Success, Profit/Loss, PP1/PP2) Alerts via popup, sound, push, or email Cu
Zoryk Gold
Reda El Koutbane
5 (15)
割引は 24 時間後に終了します — 次の価格は$ 69 ZORYK — MetaTrader 5専用 XAUUSDシグナル・トレードプランニングシステム このような経験はありませんか。 ゴールドを分析し、エントリーを待ち、ようやくポジションを持った直後に価格が逆方向へ動く。 早すぎる決済をしてしまったり、Stop Lossを動かしたり、数秒迷っている間にチャンスを逃したりする。 その後、相場は自分が最初に予想していた方向へ進み、目標へ到達する。 問題は常に方向判断ではありません。 本当の問題は、明確な計画がなかったことです。 どこでエントリーすべきか。 どこでトレードの前提が無効になるのか。 近い利益を確保すべきか、より大きな値動きを待つべきか。 現在のsetupが本当に強いのか、それとも無理にトレードを探しているだけなのか。 ゴールドは非常に速く動きます。 正しい分析でも、明確なプランがなければ数秒で悪い判断に変わることがあります。 ZORYKは、その問題を解決するために開発されました。 ZORYKとは ZORYKは、MetaTrader 5とXAU
SuperScalp Pro
Van Minh Nguyen
4.66 (35)
SuperScalp Pro - Professional Multi-Layer Confluence Scalping System SuperScalp Proは、クラシックなSupertrendに複数のインテリジェントな確認フィルターを追加した、高度なスキャルピングインジケーターです。より高い確率が期待できるBuy/Sellの取引機会を特定し、ダマシのシグナルを大幅に減らすことをサポートします。 明確なBuyとSellの矢印がチャート上に直接表示され、ATRに基づくStop LossとTake Profitのレベルがリアルタイムで自動計算されます。 購入後、設定方法や推奨設定についてのサポートが必要な場合は、私にご連絡ください。 SuperScalp Pro Auto Traderを使用して、シグナルを簡単に自動化できます: [Auto Trader] 推奨設定ファイルをダウンロード: [Set File] 完全なドキュメントは製品ブログでご覧いただけます: [User Guide] 最新情報を受け取るには公式チャンネルに参加してください: [Official Channel]
GoldenX Entry MT5
VividMind Digital Solutions
5 (16)
GoldenX Entryは、MT5向けのインジケーターであり、適応型Smart Entry Trendアルゴリズム、シグナルスコアリングシステム、マーケットレジーム検出機能、およびボラティリティフィルターを備えています。各シグナルには、計算されたエントリーレベル、3つのテイクプロフィット(TP1、TP2、TP3)、およびストップロスレベルが含まれます。本インジケーターは、異なる市場環境に適応するために設計された複数の分析レイヤー上に構築されており、マルチレイヤー分析システムと内蔵オプティマイザーおよび統計トラッキングシステムを組み合わせています。リスク・リワード(RR)指標および過去のトレード履歴に基づく定量分析を提供します。 使い始めは簡単です — 選択した時間足でオプティマイザーを実行し、そのままチャート上でインジケーターを使用します。 コア機能 GoldenX Entryは、シグナルエンジンとトレード管理機能、そして過去統計トラッキングを1つのチャートに統合しています: - 内蔵オプティマイザー: オプティマイザーはチャート上でワンクリックで実行できます。200通りのパラメー
SMC Intraday Formula
VividMind Digital Solutions
5 (26)
まず正直に言いましょう。 どんなインジケーターも、それ単体であなたを利益化させることはできません。もしそう言う人がいるなら、それは夢を売っているだけです。完璧な売買シグナル(矢印)を表示するインジケーターは、いくらでも“完璧に見せる”ことができます。正しい過去の区間を拡大して、勝ちトレードだけを切り取ればいいだけです。私たちはそれをしません。 SMC Intraday Formula はツールです。 市場構造を読み取り、最も高い確率の価格ゾーンを特定し、今この瞬間のスマートマネーの痕跡をシンプルな言葉で正確に示します。最終判断はあなたが行います。トレードを実行するのもあなたです。しかし今は「希望」ではなく「精度」でエントリーできます。 私たちはこのインジケーターを、ゴールド(XAUUSD)および主要FX通貨ペアで約3年間、日々のスキャルピングに使用してきました。M1、M5、M15、M30の主要ツールです。これは未来を予測しようとするのではなく、今まさに形成されている高確率セットアップを示し、その理由を説明します。 他のすべてのインジケーターと何が違うのか? ほとんどのトレーディングイ
Gann Made Easy   は、ミスター・ギャンの理論を使用した取引の最良の原則に基づいた、プロフェッショナルで使いやすい外国為替取引システムです。 W・D・ガン。このインジケーターは、ストップロスとテイクプロフィットレベルを含む正確な買いと売りのシグナルを提供します。 PUSH通知を利用して外出先でも取引可能です。 ご購入後、取引方法の説明と優れた追加インジケーターを無料で入手するには、私にご連絡ください! おそらく、ギャンの取引手法についてはすでに何度も聞いたことがあるでしょう。通常、ギャンの理論は初心者のトレーダーだけでなく、すでにある程度の取引経験がある人にとっても非常に複雑なものです。なぜなら、ギャンの取引手法は理論的にはそれほど簡単に適用できるものではないからです。私はその知識を磨き、最良の原則を私の外国為替インジケーターに組み込むために数年を費やしました。 このインジケーターは非常に簡単に適用できます。必要なのは、それをチャートに添付し、簡単な取引推奨事項に従うだけです。このインジケーターは常に市場分析の仕事を行い、取引の機会を探します。適切なエントリーポイントを検
Neuro Poseidon is a new indicator by Daria Rezueva. It combines precise trading signals with adaptive TP/SL levels - creating best possible trades as a result! Message me and get  Neuro Poseidon Assistant  as a gift to automize your trading process! What makes it stand out? 1. Proven profitability on all assets and timeframes 2. Only confirmed BUY and SELL signals present on the chart 3. Adaptive TP & SL levels generated by the software for each trade 4. Easy to understand - suitable for al
M1 SNIPER は使いやすいトレーディングインジケーターシステムです。M1時間足向けに設計された矢印インジケーターです。M1時間足でのスキャルピングのためのスタンドアロンシステムとして、また既存のトレーディングシステムの一部としても使用できます。このトレーディングシステムはM1時間足での取引に特化して設計されていますが、他の時間足でも使用できます。元々、この手法はXAUUSDとBTCUSDの取引用に設計しましたが、他の市場においても役立つと考えています。 インジケーターのシグナルは、トレンドの方向と逆方向に取引できます。インジケーターのシグナルを利用して両方向に取引するのに役立つ特別な取引テクニックをご紹介します。この手法は、特別な動的なサポートとレジスタンスの価格帯を利用することに基づいています。 ご購入後、M1 SNIPER矢印インジケーターをすぐにダウンロードできます。さらに、M1 SNIPERツールのすべてのユーザーに、以下のスクリーンショットに表示されているApollo Dynamic SRインジケーターを無料で提供しています。この2つのインジケーターを組み合わせることで
伝説が帰ってきました:Entry Points Pro 10。 MQL5 Marketのトップ3に3年間入り続けた伝説的インジケーターの再始動です。 2つのバージョンで合計589件の高評価レビュー、毎日数千人のトレーダーが実際のトレードに使用し、デモのダウンロードは31,000件以上   MT4+MT5 。 私はこの5年間に寄せられたレビューをすべて読み、約束を並べる代わりに、その答えをバージョン10に組み込みました。1999年から相場に携わり、 誠実さ、自らの評判、そして顧客を大切にする 作者による製品です。 Entry Points Proのエントリーシグナルは、リペイント(再描画)を一切行いません。 そして今回初めて、これは作者の言葉ではなく検証可能な事実になりました。確定シグナルはローソク足の終値確定後にのみ表示され、自動テストで リペイントはゼロ と確認されています(EURUSD、XAUUSD、BTCUSDで2,486,568回の不変条件チェック、違反0件)。検証方法は公開されており、ストラテジーテスターでご自身で再現できます。 ご購入後は、必ずすぐにダイレクトメッセージでご
UNIX SCALPER — 特別オファー セットアップを見つけ、取引プランを確認し、取引方法を選ぶ。 MT5用UNIX Scalperを99米ドルで購入すると、シグナルを自動売買に活用できるSmart Universal Expert Advisorが無料で付属します。 UNIX Scalperは、市場分析、BUY/SELL/WAITの判断、Entry、Stop Loss、TP1、TP2の水準を、見やすいパネルにまとめています。取引プランに沿って手動で取引することも、付属のEAを接続し、ご自身の設定に従って自動執行することもできます。 現在の99米ドルの価格は、今後30件の購入に適用されます。その後、価格は149米ドルになります。 パッケージの内容 ご購入には以下が含まれます。 • MT5用UNIX Scalper。 • Smart Universal Expert Advisor — 無料。 • UNIX Scalperの完全版PDFユーザーマニュアル。 • UNIX Scalper公式オンラインコース。 • インストールと設定の手順ガイド。 • 購入者限定コミュニティへ
新たな王者が登場 - インジケーター + 注文管理表示(TP1 + TP2 + TP3)+ オプションのTelegramシグナル送信機能付き(無料) (完全なトレード&シグナルシステム) ゴールド向け最高のEA: Gold Slayer このインジケーターには、高度な戦略、カスタマイズ可能な注文管理システム、そしてエンベロープ拡張を組み合わせた平均回帰システムが搭載されています。さらに、RSIなど複数のインテリジェントな確認フィルターによって、高確率の反転エントリーをBUY・SELLシグナルとして検出します。 単にトレードを学ぶだけでなく、複数ポジションを効果的に管理し、過去に利益を出しているオープンポジションで損失トレードをカバーする方法も学べます。 M5向けに構築・最適化されており、流動性が高くシグナルの精度が安定しているBTCUSDとXAUUSDで優れたパフォーマンスを発揮します。 このインジケーターは、ATRを基に自動計算されたエントリー、ストップロス、テイクプロフィットレベルを備えた明確なLong・Shortシグナルを提供するため、リスク管理が最初から組み込まれています。 マ
Auto Optimized SpeedAngle は、継続的なウォークフォワード最適化(WFO:Walk-Forward Optimization)によりカーブフィッティング(過剰最適化)を排除した、機関投資家レベルのモメンタムベクトルシステムです。市場レジームの変化時に効果が低下する静的な入力に依存せず、アウトオブサンプル(OOS)検証を用いてパラメーターを動的に再キャリブレーションすることで、表示されるシグナルが単なる過去の偶然ではなく、確実な統計的優位性に基づいていることを保証します。 主な機関投資家向けフレームワーク ウォークフォワード最適化エンジン: ルックバック期間やしきい値の数千に及ぶ組み合わせを継続的にスキャンし、データをインサンプルとアウトオブサンプルに厳格に分離します。未検証のデータ環境において数学的優位性が証明された場合にのみ、新しいパラメーター設定を採用します。 定量的目的関数: 単なる純利益の追求ではなく、機関投資家レベルの安定性指標をターゲットとします。システム品質ナンバー(SQN)、期待値(1トレードあたりの平均Rマルチプル)、またはネットRの最適化を選
FiboSniper Pro – Multi-Filter Fibonacci System with Auto SL/TP and Control Panel FiboSniper Proは、動的なFibonacci Envelopesと複数の確認フィルターを組み合わせ、選別されたBuyおよびSellシグナルを生成するテクニカルインジケーターです。FibonacciレベルはMoving AverageとATRを基に計算され、その後ADX、EMA、RSI、ATR、Volume、Time、Candle構造によってフィルタリングされます。インジケーターは、ATRに基づく自動Stop LossおよびTake Profitレベルをチャート上に直接表示し、さらに迅速な調整が可能なインタラクティブControl Panelを提供します。 購入後、推奨設定ファイルと詳細な使用方法については、私にご連絡ください。 Auto Trader Xを使用してFiboSniper Proのシグナルを自動化できます: [Auto Trader X] User GuideとSet Files: [Click her
Welcome to ENTRY IN THE ZONE AND SMC MULTI TIMEFRAME / SPECIAL BENEFIT FOR OUR MQL5 CUSTOMERS  FREE ACCESS TO THE NEW TOOL — COMING SOON —   Learn More on Our Official Website : https://www.fableedge.net Entry In The Zone and SMC Multi Timeframe is a real-time market analysis tool based on Smart Money Concepts (SMC), designed to analyze market structure, price direction, and key trading zones. It supports both Single-Timeframe Analysis and Multi-Timeframe Analysis, providing a clearer view of th
Tokyo Indicatorは、トレンドの方向性、潜在的な取引シグナル、および市場状況を視覚的に分かりやすく表示します。 色分けされた階段状のトレンドラインにより、強気局面(青色)と弱気局面(マゼンタ色)が明確に区別されます。トレンドの変化に合わせて表示される方向矢印は、売買の好機を強調します。 統合されたダッシュボードには、現在のシグナル、市場のバイアス(傾向)、モメンタム、ボラティリティ、シグナルの品質がひと目で分かるようにまとめられています。これにより、トレーダーはパネルを切り替えることなく、価格変動(プライスアクション)とインジケーターの数値を照らし合わせて分析を行うことができます。 すっきりとしたチャート表示と簡潔な市場概要により、Tokyo Indicatorはトレンド分析や取引判断における体系的なアプローチをサポートします。 あらゆる時間足や銘柄に対応しており、特に金(ゴールド)の取引に適しています。 トレンド スキャナーの強力なサポートを利用して、無料のインジケーターを入手し、プライバシーを守ります。あーみー!     設定 ShowHUD - チャート上のパネ
ATOMIC ANALYST — 特別オファー 市場分析、自動化EA、学習コンテンツとサポートをひとつに。 MT5用のAtomic Analystを99米ドルでご購入いただくと、シグナルの自動売買に使える Smart Universal Expert Advisorを無料でプレゼント します。 Atomic Analystは、プライスアクション、トレンドの方向、エントリー・決済シグナル、損切り水準、複数の利確水準をチャート上にまとめて表示します。分析を参考に手動で取引することも、付属のEAを接続し、ご自身で選んだ設定に基づいて自動売買することもできます。 現在の99米ドルという価格は、これからの30件の購入に適用されます。その後、価格は149米ドルに上がります。 充実のパッケージ内容 ご購入には以下が含まれます。 • MT5用Atomic Analyst。 • Smart Universal Expert Advisor — 無料。 • Atomic Analystの完全版PDFユーザーマニュアル。 • Atomic Analyst公式オンラインコース。 • インストールと設
Power Candles V3 - 自己最適化型強弱インジケーター Power Candles V3は 、通貨や銘柄の強さを、適用されたすべてのチャート上で実行可能なトレードプランに変換します。単にローソク足を色分けするだけでなく、バックグラウンドでリアルタイムの自動最適化を実行し、目の前の銘柄に対して最適なストップロス、テイクプロフィット、およびシグナルの閾値を提示します。ワンクリックで実取引に適用でき、エントリーポイント、ストップロス、テイクプロフィットのラインが正確な価格位置にチャート上に表示され、方向性を示すアラートがリアルタイムで発動します。 このツールは、Stein Investmentsのエコシステムの一部です。  18種類以上のツールをすべて閲覧し、AIを活用したセットアップの推奨事項を入手し、  https://stein.investments でコミュニティに参加しましょう クローズしたバーごとに3,000回以上のトレードシミュレーション。9つの強さの状態。2つの戦略を並行してテスト。勝率の高い設定をワンクリックで適用。 なぜこれが必要なのか ほとんどの強
SMART PRICE ACTION CONCEPTS — 特別オファー 構造を確認し、ゾーンを見つけ、取引プランを立てる。 MT5用Smart Price Action Conceptsを49米ドルで購入すると、Smart Universal Expert Advisorが無料で付属します。 Smart Money Concepts(SMC)、ICTスタイルの分析、プライスアクションを、見やすいチャートにまとめます。市場構造、オーダーブロック、流動性の参考水準、インバランスを確認し、Smart Panelで表示する要素を選択できます。 現在の49米ドルの価格は、今後30件の購入に適用されます。その後、価格は100米ドルになります。 パッケージの内容 • MT5用Smart Price Action Concepts。 • Smart Universal Expert Advisor — 無料特典。 • 完全版PDFユーザーマニュアルと公式オンラインコース。 • インストールと設定の手順ガイド。 • 購入者限定コミュニティへの参加とサポート。 ツール、学習教材、わかりやすい入門
Market Structure Order Block Dashboard MT5 は、市場構造と主要な価格反応ゾーンをチャート上で直接読み取りたいトレーダー向けに設計された MT5 インジケーターです。BOS、ChoCH、オーダーブロック、Fair Value Gap (FVG)、流動性、Kill Zones、Volume Profile、そして素早い分析のためのコンパクトなダッシュボードを組み合わせています。 本インジケーターは、市場構造、ICT、Smart Money の概念を意思決定の枠組みとして使用するトレーダーを対象としています。トレンド継続、反転の可能性、価格の不均衡、流動性ターゲット、注目ゾーンをより構造的に特定する助けとなります。 購入者向けの付属リソース 購入後、MQL5 のプライベートメッセージにてご依頼いただくと、完全な PDF ユーザーガイドとパラメータ設定のヒントを提供いたします。MQL5 のプライベートメッセージによる直接的な技術サポート。 バージョン 1.20 では 2 つの重要な追加機能があります: Pending BOS / Pending Cho
FX Trend NG:次世代マルチマーケット・トレンドインテリジェンス 概要 FX Trend NG は、複数の時間足に対応したプロフェッショナル向けトレンド分析およびマーケット監視ツールです。 市場全体の構造を数秒で把握することができます。 複数のチャートを切り替える必要はありません。どの銘柄がトレンド中なのか、どこでモメンタムが弱まっているのか、そしてどの時間足で強い整合性があるのかを瞬時に確認できます。 ローンチ特別オファー – FX Trend NG を $30(6ヶ月) または $80 永久ライセンス でご利用いただけます。 すでに Stein Investments のユーザーですか? -> メッセージを送信 して、プライベートグループへアクセスしてください。 セットアップや詳細情報が必要ですか? -> Stein Investments 公式ページ をご覧ください。 1. FX Trend NG が他と異なる理由 3ステート・トレンドロジック ― Buy と Sell だけではない • 多くのインジケーターは Buy または Sell の2状態のみを表示します。
FX Power: 通貨の強弱を分析して、より賢い取引を実現 概要 FX Power は主要通貨と金の実際の強弱をあらゆる市場状況で理解するための必須ツールです。強い通貨を買い、弱い通貨を売ることで、 FX Power は取引の意思決定を簡素化し、高い確率の取引機会を見出します。トレンドを追従する場合でも、極端なデルタ値を使用して反転を予測する場合でも、このツールはあなたの取引スタイルに完全に適応します。ただ取引するだけではなく、 FX Power で賢く取引をしましょう。 1. なぜ FX Power がトレーダーにとって非常に有益なのか 通貨と金のリアルタイム強弱分析 • FX Power は主要通貨と金の相対的な強弱を計算し、マーケットダイナミクスに関する明確な洞察を提供します。 • どの資産がリードしているか、または後れを取っているかを監視して、取引するペアを賢く選びましょう。 マルチタイムフレームの包括的なビュー • 短期、中期、長期のタイムフレームで通貨と金の強弱を追跡し、マーケットトレンドに基づいて取引戦略を調整できます。 • スキャルピングからスイングトレード
通貨強さウィザードは、取引を成功させるためのオールインワン ソリューションを提供する非常に強力な指標です。このインジケーターは、複数の時間枠のすべての通貨のデータを使用して、このまたはその外国為替ペアのパワーを計算します。このデータは、使いやすい通貨インデックスと通貨パワーラインの形式で表され、特定の通貨のパワーを確認するために使用できます。 必要なのは、取引したいチャートにインジケーターを接続することだけです。インジケーターは、取引する通貨の実際の強さを示します。このインジケーターは、トレンドに合わせて取引するときに有利に利用できる売買高の圧力の極値も示します。このインジケーターには、フィボナッチに基づく可能なターゲットも表示されます。 このインジケーターは、PUSH 通知を含むあらゆるタイプのアラートを提供します。 購入後ご連絡下さい。私の取引のヒントをあなたと共有し、素晴らしいボーナスインジケーターを無料で提供します! 幸せで有益な取引をお祈りします。
Adaptive Price Action Engine インジケーターを購入すると、EAが無料に マルチタイムフレーム対応・自己最適化トレンド&ローソク足パターン分析 市場環境は常に変化しており、すべてのPrice Actionパターンが、あらゆる市場環境で同じ価値を持つわけではありません。 Adaptive Price Action Engine は、変化する市場環境への適応を目的として、 トレンド構造、マルチタイムフレーム分析、ローソク足パターン、統計的最適化 を1つの分析フレームワークに統合しています。 2つのアダプティブモード Dual Alpha Trend Mode 低い時間足と高い時間足のAlpha Trendパラメータを自動的に探索し、直近の市場動向に合わせてトレンド判定を適応させます。 Candlestick + Alpha Mode Alpha Trendによる市場レジーム判定と、 22種類の強気・弱気ローソク足パターン を組み合わせます。すべてのパターンを同じように扱うのではなく、さまざまなパターンの組み合わせを統計的に評価し、選択された市場環境において過去
M1 Quantum を使用したライブトレードシグナル : シグナル (取引は 自動的に Quantum Trade Assistant によって実行され、この製品に 無料 で含まれています。) 最新ニュース: バージョン1.64がリリースされました。現在、すべての取引で、関連するサポート/レジスタンスゾーンの後ろにStop Lossが設定されます。今回のバージョンでは、EAのパフォーマンスを向上させるためにSmart Close機能も改善されました。 8月9日から、ライブシグナルはバージョン1.64で稼働しています。 価格プラン: 現在価格: $169 (早期購入者向けオファー) 次回予定価格: $189 予定小売価格: $299 開発者からのお知らせ: ご購入後、 最新の推奨設定ファイル(Set File) 、運用アドバイス、および他の M1 Quantum ユーザーと交流できる VIPサポートグループ への招待をご希望の場合は、お気軽にご連絡ください。 よくある質問 - 設定ファイル - インストールガイド M1 Quantum は、M1専用のプロフェッショナルトレーディング
トレンドトレーディング は、タイミングのプルバックとブレイクアウトにより、市場で起こっているトレンドから可能な限り利益を得るように設計された指標です。確立されたトレンドの中で価格が何をしているかを分析することにより、取引の機会を見つけます。 [ インストールガイド | 更新ガイド | トラブルシューティング | よくある質問 | すべての製品 ] 自信を持って効率的に金融市場を取引する むち打ちにならずに確立されたトレンドから利益を得る 収益性の高いプルバック、ブレイクアウト、早期の逆転を認識する この指標は、独自の品質とパフォーマンスを分析します 複数時間枠のダッシュボードを実装します インジケーターは再描画されていません 電子メール/音声/視覚アラートを実装します 確立されたトレンドは多くの取引機会を提供しますが、ほとんどのトレンド指標はそれらを完全に無視しています。インジケーターの解釈はかなり簡単です: (1) トレンドの変化 (2) トレンドの方向への後退 (3) トレンドの方向へのブレイクアウト 赤いダッシュ は下降トレンド中の修正です 青いダッシュ は上昇トレンド中
Scalper Vault は、スキャルピングを成功させるために必要なすべてを提供するプロフェッショナルなスキャルピング システムです。このインジケーターは、外国為替およびバイナリー オプションのトレーダーが使用できる完全な取引システムです。推奨される時間枠は M5 です。 システムは、トレンドの方向に正確な矢印シグナルを提供します。また、トップとボトムのシグナルとギャン マーケット レベルも提供します。 インジケーターは、プッシュ通知を含むすべてのタイプのアラートを提供します。 インジケータの購入後にご連絡ください。私の個人的な取引の推奨事項と素晴らしいボーナス指標を無料で共有します! 幸せで有益な取引をお祈りします!
このインジケーターを購入された方には、以下の特典を 無料 で提供しています: 各トレードを自動で管理し、ストップロスとテイクプロフィットを設定し、戦略ルールに基づいてポジションを決済する補助ツール 「Bomber Utility」 様々な銘柄に合わせたインジケーターの設定ファイル(セットファイル) 「最小リスク」、「バランスリスク」、「待機戦略」 の3つのモードで使用できる Bomber Utility 用の設定ファイル このトレーディング戦略をすぐに導入・設定・開始できる ステップバイステップのビデオマニュアル ご注意: 上記の特典を受け取るには、MQL5のプライベートメッセージシステムを通じて販売者にご連絡ください。 オリジナルのカスタムインジケーター 「Divergence Bomber(ダイバージェンス・ボンバー)」 をご紹介します。これは、MACDのダイバージェンス(乖離)戦略に基づいた 「オールインワン」型のトレーディングシステム です。 このテクニカルインジケーターの主な目的は、価格とMACDインジケーターの間に発生するダイバージェンスを検出 し、将来の価格の動きを示
Axiom Matrix — 特別オファー Axiom Matrix を 49 米ドルで購入すると、Smart Universal Expert Advisor を無料でプレゼント。 市場をスキャン。セットアップを比較。次のチャートを選ぶ。 Axiom Matrix は複数銘柄・複数時間足の分析を一つのダッシュボードに集約します。チャートを一つずつ開かずに注目する市場を探せます。 気配値表示または選択した銘柄を複数の時間足でスキャン。 トレンド、モメンタム、出来高、ボラティリティ、市場環境の質を比較。 Best Axiom Pick、シグナルの状態、クリックできるセルでセットアップを確認。 Axiom Matrix は分析用ダッシュボードです。取引は実行しません。 パッケージ内容 Axiom Matrix Smart Universal Expert Advisor PDF ユーザーガイドとオンライン講座。 設定ガイドと購入者コミュニティへのアクセス。 Smart Universal Expert Advisor は独立した特典です。本製品の直接的な自動化を約束するものではありません。
作者のその他のプロダクト
️ Aviso de Risco Negociar no mercado financeiro envolve riscos significativos. Esta ferramenta é um auxílio à tomada de decisão e não garante lucros. Opere com responsabilidade e sempre com gerenciamento de risco adequado. Caracteristicas deste Super Indicador de Topos e Fundos : - Analisa as últimas barras (configurável) e detecta topos e fundos; - Agrupa pivôs próximos em um único nível, usando uma tolerância baseada no range médio das barras.; - Níveis abaixo do preço atual viram suportes e
FREE
Painel de Controle – Boleta Inteligente para Forex Descrição Geral do Sistema: Apresentamos o   Painel de Controle – Boleta Inteligente para Forex , a ferramenta definitiva para traders que exigem agilidade, precisão e controle total sobre suas operações no mercado Forex. Com uma interface intuitiva e altamente funcional, este painel transforma sua plataforma MetaTrader em um centro de comando profissional, permitindo que você execute ordens, gerencie risco e monitore seus resultados em tempo re
FREE
Boleta Agil B3
Renato Aparecido Braguini
Sobre a Boleta Ágil – Descrição Completa Apresentamos a   Boleta Ágil , um painel de negociação completo e altamente personalizável para   MetaTrader 5 . Desenvolvida para traders que exigem   velocidade, precisão e flexibilidade , esta ferramenta coloca o controle total das suas operações na palma da sua mão — diretamente no gráfico. Com uma interface moderna e intuitiva, você executa ordens, gerencia riscos e ajusta estratégias em tempo real, sem perder tempo com menus complicados. Botões
FREE
Boleta para operações Long & Short na bolsa Brasileira B3 para operações em ações, mini-indice e mini-dolar com lotes ajustaveis; Possui botões de COMPRA, VENDA e FECHAR TODAS AS OPERAÇÕES; Podem ser definidos Ganhos (TakeProfit) e perdas (StopLoss), além do controle do StopMóvel (configuravel); É possível determinar quantidade de operações por dia; Existe um painel informativo com lucro ou prejuízo diário. É possível determinar os horários de início e término das operações quando selecion
FREE
MultiForça 4 em 1 (MACD + Bulls + Bears + Média 50). Descrição Geral O   MultiForça 4 em 1   é um indicador sintético de análise técnica que reúne em um único painel quatro ferramentas essenciais para identificação de tendência e momento do ativo: MACD (Moving Average Convergence Divergence)   – tendência e momentum. Bulls Power   – força dos compradores. Bears Power   – força dos vendedores. Média Exponencial de 50 períodos (EMA 50)   – direção da tendência de médio prazo. Cada um desses
FREE
️ Aviso de Risco Negociar no mercado financeiro envolve riscos significativos. Esta ferramenta é um auxílio à tomada de decisão e não garante  lucros. Opere com responsabilidade e sempre com gerenciamento de risco adequado. O painel do indicador MACD utiliza como base uma das três possíveis configurações a seguir :  1. Cruzamento das Linhas (MACD x Linha de Sinal); -  Sinal de Compra (Alta): Ocorre quando a Linha MACD cruza de baixo para cima a Linha de Sinal.  -  Sinal de Venda (Baixa): Ocorr
FREE
️ Aviso de Risco Negociar no mercado financeiro envolve riscos significativos. Esta ferramenta é um auxílio à tomada de decisão e não garante lucros. Opere com responsabilidade e sempre com gerenciamento de risco adequado. Atenção : Testado em timeframe de 2 minutos e no mini-indice da B3 do Brasil. Elimine falsos sinais do MACD com confirmação da força do candle em tempo real. Este indicador avançado gera sinais de COMPRA (seta azul) e VENDA (seta vermelha) apenas quando o MACD cruza a linha d
FREE
Flash counter
Renato Aparecido Braguini
Candle Timer - Indicador de Contagem Regressiva O   Candle Timer   é um indicador para MetaTrader 5 que exibe um contador regressivo mostrando o tempo restante até o fechamento do candle atual. O indicador é altamente personalizável e permite ajustar sua aparência e posicionamento na tela. Funcionalidades Principais Contagem regressiva em tempo real do candle atual Suporte a todos os timeframes (M1, M5, M15, M30, H1, H4, D1, W1, MN) Atualização automática a cada segundo Posicionamento d
FREE
Painel Inteligente B3 – Monitoramento e Troca Rápida de Ativos para MetaTrader 5 O Painel Inteligente B3 é um utilitário essencial para quem opera no mercado brasileiro (Ações, FIIs, BDRs, ETFs e Contratos Futuros). Ele foi projetado para otimizar o acompanhamento do mercado em tempo real e agilizar a navegação entre ativos diretamente na tela do seu MetaTrader 5. Com uma interface moderna e altamente personalizável, o painel elimina a necessidade de trocar manualmente o símbolo do gráfico ou ab
フィルタ:
レビューなし
レビューに返信