Chandelier Structure Pro
- 지표
-
Minh Truong Pham
 Hello, my name is Pham and I am a programmer and trader! At here, I create amazing forex indicators and expert advisors for Metatrader.
I will try:
+ Provide best tools base on my 5 years experience as a trader and 10 years as a programmer. - 버전: 1.0
- 활성화: 15
Most ATR trend tools can't tell you in advance where the trend flips. The band is built from the midpoint of the bar you're standing on, so the level that would turn it slides while that bar prints. You can't place an order against a moving line.
Chandelier Structure Pro tests the close against the previous bar's stop. The number you read at 09:00 is the number that decides 09:59. On 57,540 hourly gold bars back to January 2014 it flipped 829 times on default settings, about one signal every 69 bars. So it's a responsive tool rather than a patient one, and that's worth knowing before you decide it suits you.
What a trend flip needs, and what usually gets built
| What a trend flip needs | What a band-style tool usually does | What Chandelier Structure Pro does |
|---|---|---|
| A trigger you can read in advance | Compares the close with a band built from that same bar's midpoint, so the trigger moves as the bar forms | Compares the close with the previous bar's stop. The level is fixed at the prior close |
| A stop that doesn't loosen | Recentres every bar, so a quiet stretch widens the band again | Once price is on the right side the stop only ratchets toward price, and never backs away |
| One sensitivity control | Two or three dials that interact in ways nobody documents | Also two dials, and they turn out to be the same dial. Measured below |
| A visible level | Draws a band around price | Draws the decision level itself as a step line, so its last point is the trigger for the next bar |
Row one is why the thing exists. The stop is hl2 ± TBSensitivity × Signal Filter × ATR(Period), recomputed each bar and then ratcheted, and the flip rule reads the previous value of it. If you trade a flip, you knew the price that would cause it before the bar opened. With a same-bar band you're chasing a number that moves every tick.
The two dials that turn out to be one dial
TBSensitivity and Signal Filter look like separate controls. They aren't. Stop distance is their product, so any pair with the same product gives a bar-for-bar identical chart. Counted on the same 57,540 gold H1 bars:
| Setting | Signals | Bars per signal |
|---|---|---|
| Signal Filter 0.50, TBSensitivity 10 | 1,637 | 35 |
| TBSensitivity 5, Signal Filter 1.0 | 1,637 | 35 |
| Signal Filter 1.00, TBSensitivity 10 | 829 | 69 |
| Signal Filter 2.00, TBSensitivity 10 | 393 | 146 |
| TBSensitivity 20, Signal Filter 1.0 | 393 | 146 |
Not close. Identical. Pick one, leave the other alone, and you have a single honest sensitivity control instead of two knobs that quietly cancel each other.
What it draws
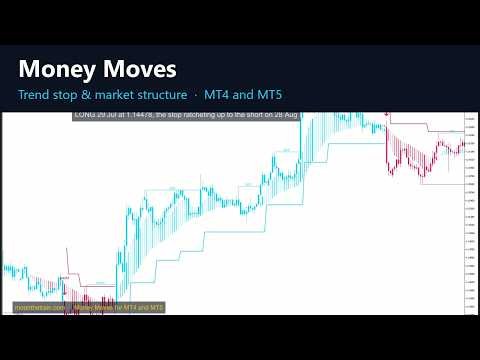
The trend stop. A step line under price in an uptrend and above it in a downtrend, broken on the flip bar so the jump isn't drawn as a vertical line. The engine computed this level on every bar and nothing plotted it, so the one line that says where the trend turns was invisible. It's on by default here.
LONG and SHORT signals. An arrow and a word on the flip bar, each in its own buffer, so a cBot or EA can read them through iCustom instead of scraping objects.
A vortex cloud. Two bands, each the average of six moving averages, shaded by the tick-volume spike on the bar: faint when volume is ordinary, solid when it's over twice its ten-bar median.
Market structure. BOS and CHoCH lines from confirmed swing pivots, with optional HH, LH, HL and LL labels. State is committed on closed bars only, so the lines behind the forming bar don't get rewritten while you look at them.
Top and bottom crosses. From a slow WaveTrend oscillator turning back from beyond its threshold. They say not here. They aren't entries, and they never touch the signals.
A trend ribbon along one edge, an optional trailing stop in percent, ATR or points, and optional entry, stop and 1:1, 2:1, 3:1 levels. Everything except the signals has its own switch.
No position sizing, no order blocks, no scanner, no dashboard panel.
Reading the chart
| On the chart | Read it as |
|---|---|
| Step line flat for many bars | The ratchet has nothing new to lock in |
| Step line creeping toward price | The trend is tightening its own invalidation |
| A cross above a candle, no signal | Momentum is stretched. A reason not to add, not a reversal call |
| Two flips within a handful of bars | A range, and the engine has no range filter |
Long: wait for the close beyond the previous bar's stop, which is the LONG print, and check that structure agrees rather than showing a fresh CHoCH against you. Then drop to your execution chart, take your own confirmation, and use the step line as the invalidation, because that's the level the tool itself flips on. Short is the same thing inverted.
Skip it when two flips have printed inside five or six bars, or when a top cross sits right above your long entry. The first means the range is eating the engine, the second means you're buying into stretched momentum.
Settings
Six inputs move signals. Everything else moves pixels.
| Setting | Default | What it changes | When to move it |
|---|---|---|---|
| Period | 1 | ATR length behind the stop distance | The input with the most leverage. Gold H1: 829 signals at 1, 307 at 5, 253 at 10. Raise it if the default feels twitchy after a spike |
| TBSensitivity | 10 | ATR multiples of stop distance | Your sensitivity control. Raise for fewer, later signals; lower and you get more of them, and more of those are wrong |
| Signal Filter | 1.0 | Multiplies the same distance | Leave it at 1.0. It duplicates TBSensitivity exactly, and running both is how people end up lost |
| Strategy | Default | Overwrites the three rows above with a preset | Only if you want a starting point. The names mislead, so read the block below before picking one |
| Top/Bottom Sensitivity | 5 | Length of the exhaustion oscillator | Lower for more crosses: 1,146 tops at 1, 689 at 5, 445 at 10 on gold H1. It never touches LONG and SHORT |
| Swing Length | 10 | Bars either side that must be lower before a swing counts, which feeds BOS and CHoCH | Raise to 15 or 20 on M15 and below, where ten-bar pivots fire on noise |
Period and TBSensitivity are the pair to think about together: Period sets what an ATR unit means, TBSensitivity sets how many of them you want.
The Period default deserves a second look. ATR(1) isn't an average of anything, it's the true range of the bar you're on, so at default the stop sits one candle wide times ten. Quick off a spike, jumpy right after one.
The four presets, measured on gold:
Default Period 1 · TBSens 10 · Filter 1.0 H1 829 signals H4 325 Scalping Period 10 · TBSens 10 · Filter 0.5 H1 683 signals H4 191 Intraday Period 2 · TBSens 15 · Filter 0.5 H1 689 signals H4 181 Swing Period 10 · TBSens 5 · Filter 1.2 H1 534 signals H4 151
Read that again. Scalping is quieter than Default on H1 and H4, not busier; it only gets busiest down on M15. Pick by the numbers, not the name.
None of the display inputs change a signal: cloud switch and sensitivity, cloud rails, ribbon position, candle colouring, arrow and text size, marker distance, bars back to draw, structure line style. The TP and SL levels and the trailing stop are drawing too, off by default. Everything left over is colours, alert channels and label sizes.
If you only touch three things, touch Period, TBSensitivity and the timeframe you run it on.
Alerts
Popup, mobile push, email, and on MT5 a Telegram message with a chart screenshot. Separate switches for signals, top and bottom crosses, BOS and CHoCH, and trailing stop flips, so you can arm only the one you care about. The confirmed-only switch is what stops a forming bar from alerting you twice before it decides.
What this version can't do
It has no range filter, and the distribution is lopsided. Take the fourteen most recent EURUSD H4 signals: six ran under 25 pips before the opposite signal printed, and four ran over 170. The big ones pay for the small ones or they don't, and that's an exit question this indicator doesn't answer.
The exhaustion crosses are slow by design. On gold H1 that's 689 tops in twelve years, roughly one a week, and on M15 you can go days without one.
You won't find a win rate table in this listing, and I'd treat any indicator listing that has one with some care. Every count on this page counts signals, not trades.
The part that ate the most time wasn't the engine. It was one array read a single element past the end, on the oldest bar of the MT4 build, which loaded without a word and drew an empty chart. It compiled clean the whole time.
Questions you'll have
Does it repaint? The stop, the signals and the structure lines are computed from closed bars, and the flip test reads the previous bar's stop, so a printed signal stays where it printed. The bar you're standing on is still live until it closes, which is true of every indicator, and the confirmed-only alert switch exists for exactly that reason.
M1? You can, but I wouldn't. Below M5 the stop flips on noise and the structure pivots churn faster than they're worth.
MT4 or MT5? Same engine, same defaults, same signals bar for bar. MetaTrader 4 has no coloured candles and no fills, so candle painting is missing there and the cloud is drawn as two coloured rails instead of a shaded band. Telegram alerts are MT5 only. Everything else, the stop line, signals, structure, crosses and ribbon, is identical.
Can an EA read it? Yes. LONG and SHORT live in their own buffers for iCustom.
Support
Message me here on MQL5 with a screenshot of the chart, plus symbol, timeframe and your input list. That's normally enough for me to find it. Updates are free.
Analysis tool. It places no trades and makes no profitability claim. Past price behaviour is not a guide to future price behaviour.