VWAP Ribbons

VWAP RIBBON INTELLIGENCE

Free MT5 VWAP Indicator | Rolling VWAP + Wilder ATR Volatility Ribbons + Breakout RSI Telemetry

VWAP Ribbon Intelligence combines Volume-Weighted Average Price (VWAP), Wilder ATR volatility ribbons, and RSI telemetry into one clean chart framework.

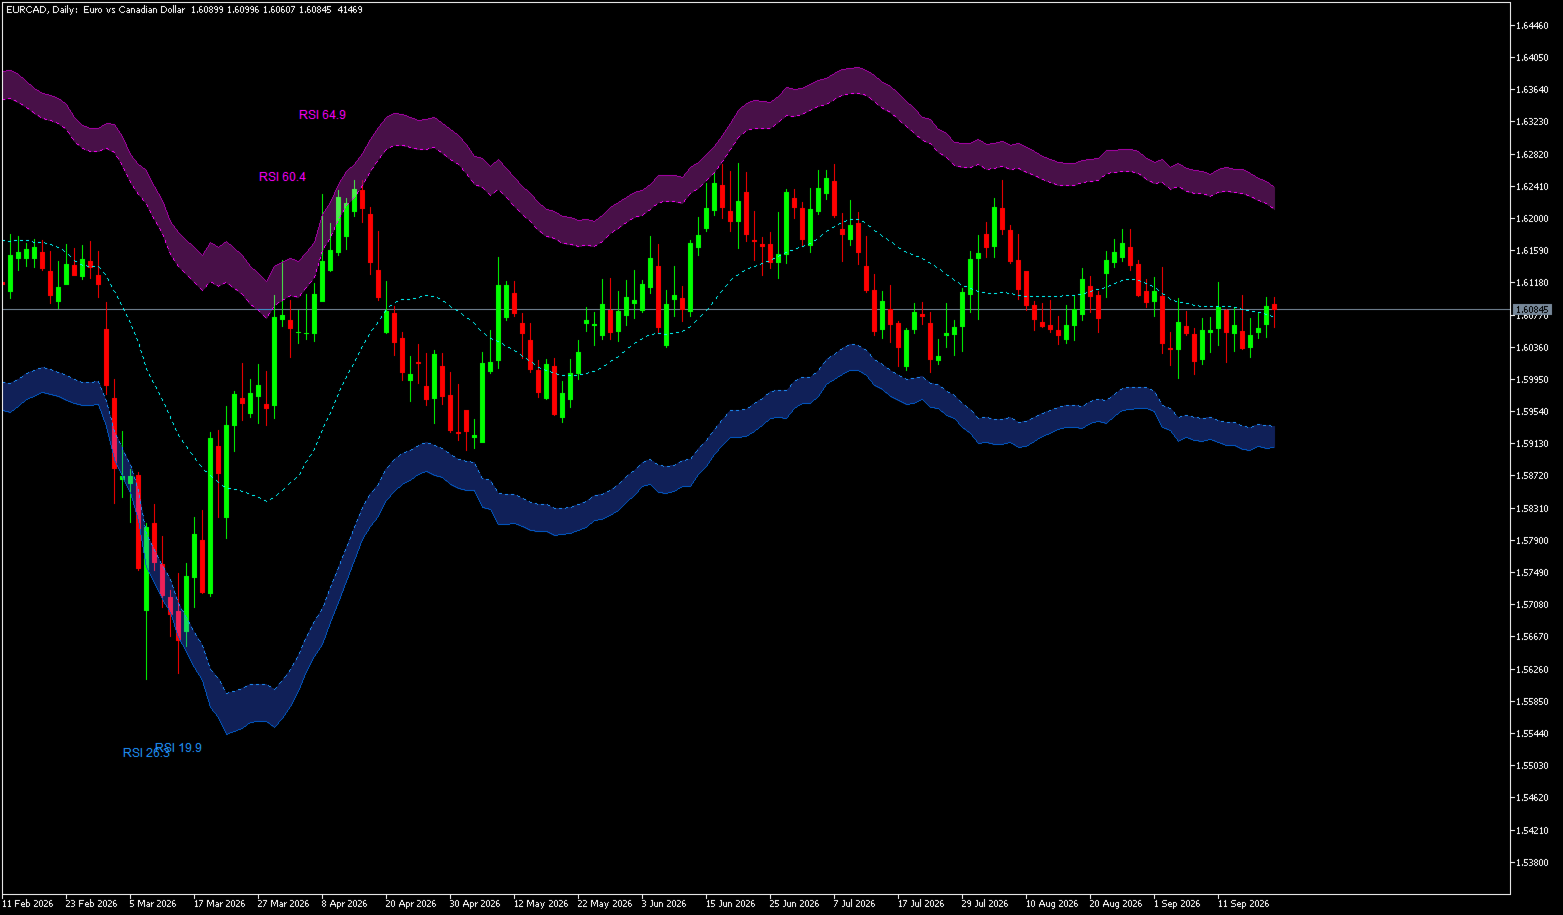
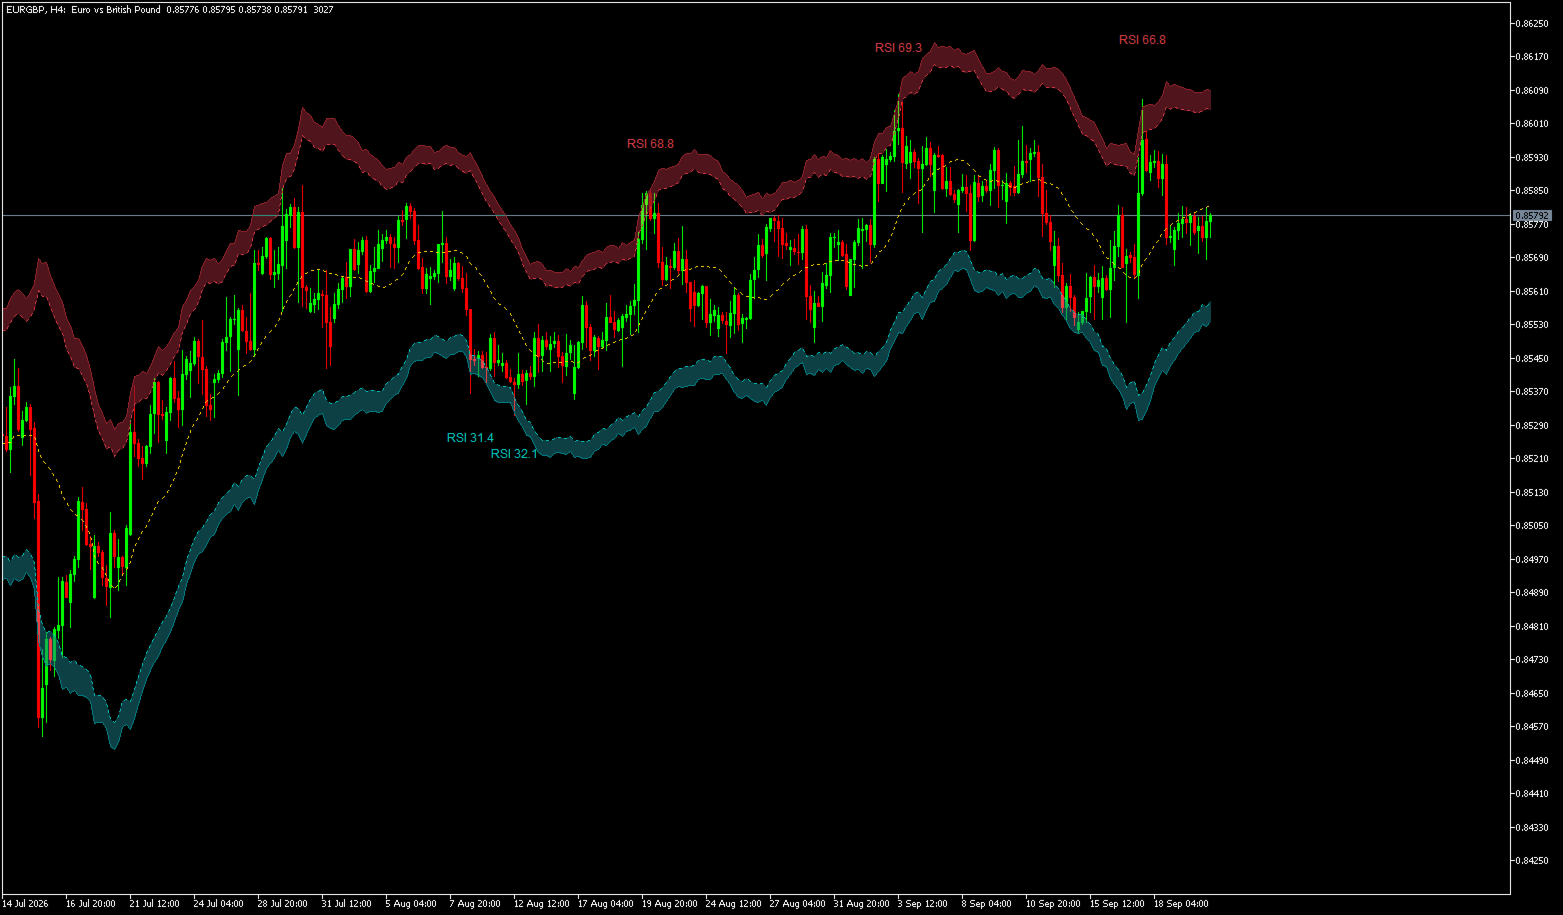
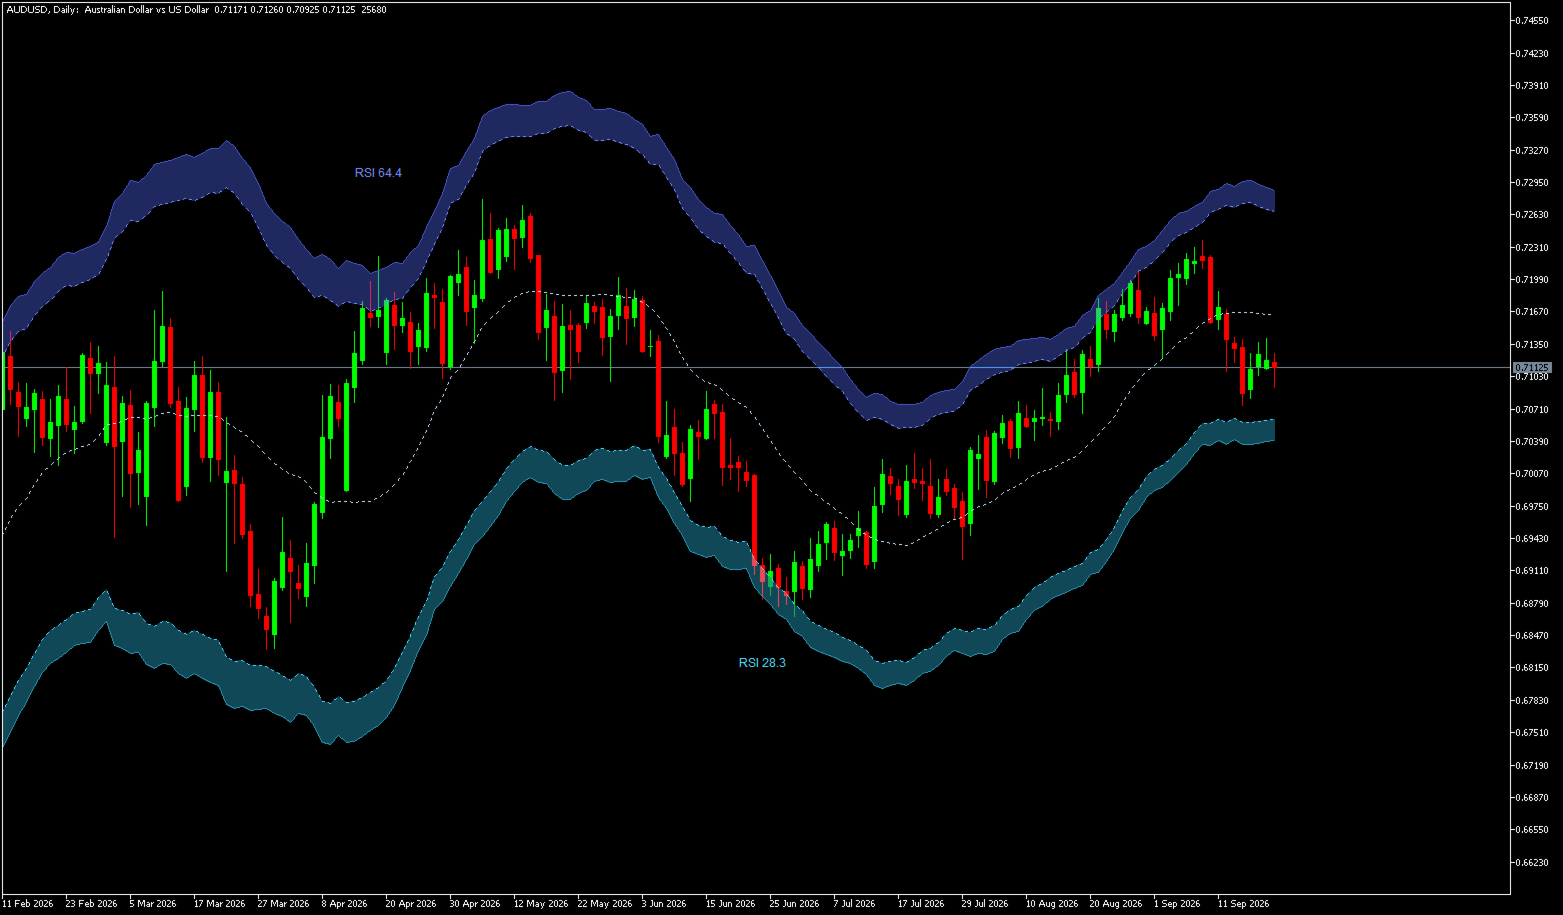
Use VWAP as a volume-weighted price reference, ATR ribbons to visualize changing volatility around that reference, and RSI labels to review momentum at significant historical ribbon extensions.

Designed for Forex, Gold, indices, commodities, and crypto, the indicator provides a compact way to study price location, volatility expansion, and momentum extremes without adding several separate indicators to the chart.

100% FREE • No DLLs • No external services • No subscription

WHAT THE INDICATOR DOES

VWAP Ribbon Intelligence combines three complementary components:

Rolling or Daily VWAP

Choose between a configurable rolling VWAP and a daily-reset VWAP.

The VWAP forms the central reference line used throughout the indicator.

Dynamic ATR Ribbons

The VWAP is surrounded by inner and outer volatility boundaries calculated using Wilder's ATR.

As market volatility changes, the distance of the ribbons changes with it.

RSI Breakout Telemetry

When price extends through the configured ribbon boundaries, the indicator can record the RSI associated with the relevant completed candle.

Historical RSI readings are displayed directly on the chart, while an optional live RSI label can track the currently forming candle.

HOW IT WORKS

VWAP CALCULATION

The indicator provides two VWAP modes.

Rolling VWAP

Calculates VWAP using a continuously moving lookback window.

This allows the VWAP reference to adapt as older observations leave the calculation window and newer observations enter it.

Daily VWAP

Resets the VWAP accumulation at the broker/server calendar-day boundary.

This provides a session-oriented VWAP reference for traders who prefer a daily calculation.

The VWAP calculation uses the volume data available for the selected instrument.

WILDER ATR VOLATILITY RIBBONS

The central VWAP is surrounded by volatility boundaries derived from Wilder's Average True Range (ATR).

The indicator provides configurable inner and outer ribbon distances.

This creates a progressive volatility framework:

VWAP

Central volume-weighted reference.

Inner Ribbon

First volatility boundary around VWAP.

Outer Ribbon

Wider volatility boundary representing a greater price extension relative to current ATR.

Because the distances are ATR-based, the ribbons expand during higher-volatility conditions and contract when volatility decreases.

This allows the chart structure to adapt to changing market conditions rather than relying on a fixed price distance.

RSI BREAKOUT TELEMETRY

VWAP Ribbon Intelligence can record RSI values associated with historical ribbon extensions.

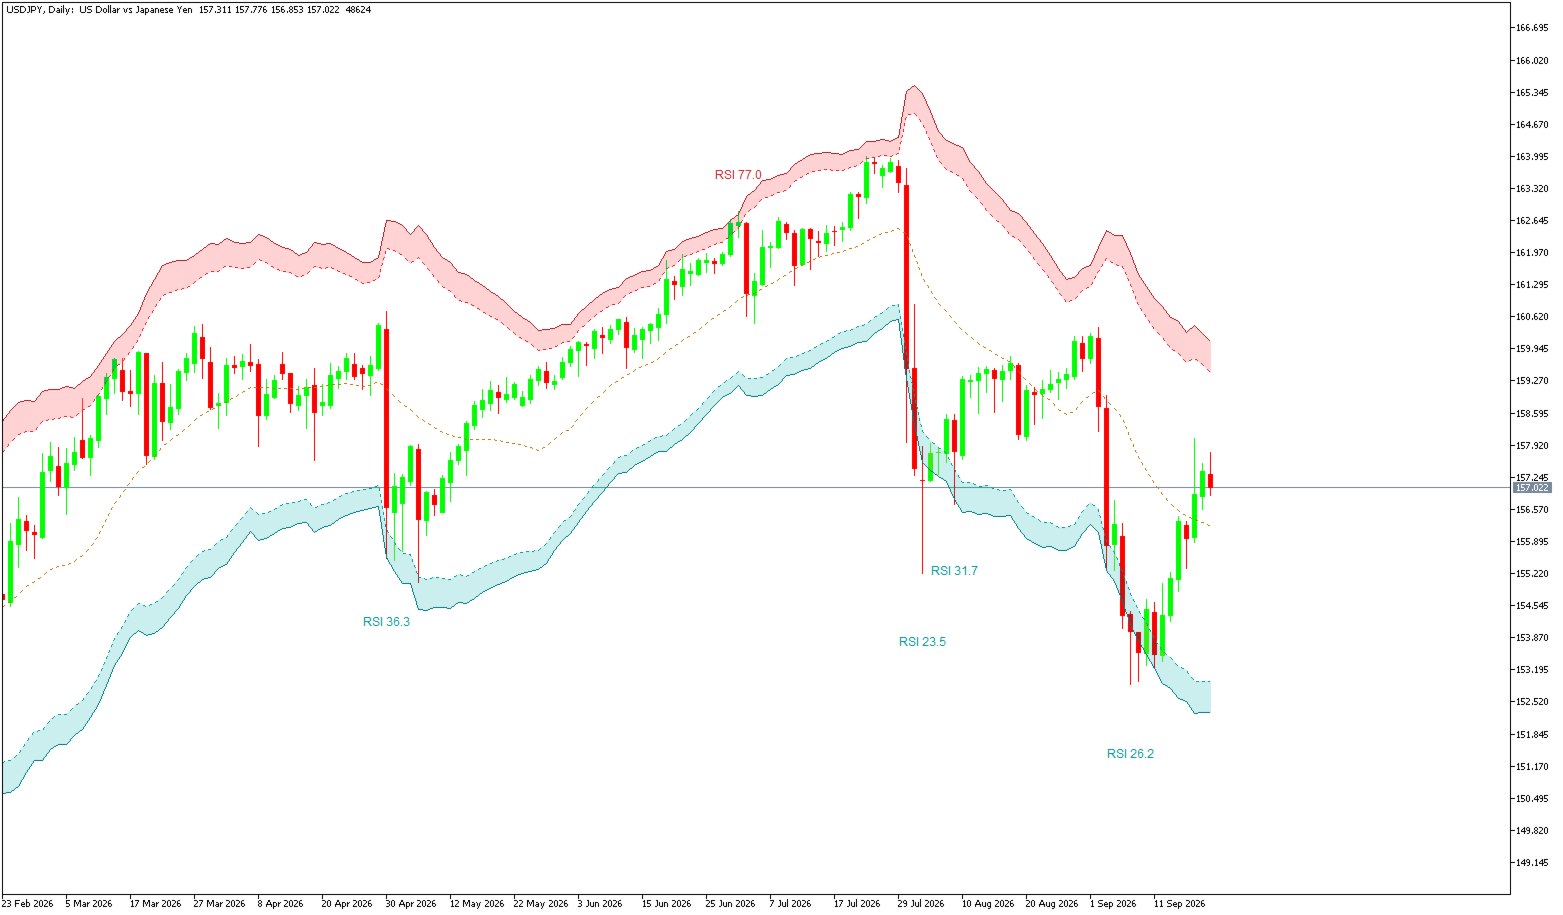
For example, the chart may display:

RSI 78

or

RSI 24

at the relevant historical price extreme.

The purpose is to make the momentum condition visible alongside the volatility extension rather than requiring the trader to switch between the main chart and a separate RSI panel.

Historical RSI Labels

Historical labels are associated with completed candles and remain fixed after the relevant candle has closed.

Live RSI Telemetry

The optional live RSI label tracks the currently forming candle.

Because the active candle is still developing, its RSI value can change as new ticks arrive.

This separates historical confirmed information from live developing information.

CHART EXPERIENCE

The default Midnight Gold theme provides a compact visual layout built around the VWAP and its volatility ribbons.

The chart can display:

  • Gold VWAP baseline

  • Upper and lower ATR volatility ribbons

  • Inner and outer volatility boundaries

  • Visual ribbon shading

  • Historical RSI readings at configured breakout extremes

  • Live forming-bar RSI telemetry

  • Configurable visual themes

The central design is intentionally simple:

VWAP → volatility → price extension → RSI

This allows the trader to evaluate the current price position without requiring multiple separate chart indicators.

UNDER THE HOOD

Volume-Weighted Price Reference

VWAP weights price using the available volume data rather than treating every observation identically.

This creates a volume-weighted reference that can be compared with the current market price.

Wilder ATR Volatility Measurement

The ribbon distances are based on Wilder ATR, providing a volatility measure that responds to changes in the market's recent trading range.

Progressive Volatility Boundaries

Inner and outer multipliers create multiple levels of distance around VWAP.

This makes it possible to distinguish a relatively normal deviation from a larger volatility extension.

Historical RSI Memory

The indicator can retain a configurable number of completed RSI labels so previous ribbon extensions can be reviewed directly on the chart.

Live Forming-Bar Tracking

The live telemetry component updates while the current candle develops, providing a current RSI reading without treating the unfinished candle as historical data.

HOW TO INTERPRET THE RIBBONS

The ribbons are designed as contextual volatility boundaries, not automatic buy or sell signals.

Price Near VWAP

Price is trading relatively close to the volume-weighted reference.

This can be used when assessing whether the market is trading near its recent volume-weighted center.

Price Inside the Inner Ribbon

Price remains within the first ATR-based volatility corridor.

This provides a reference for relatively contained movement around VWAP.

Price Beyond the Inner Ribbon

Price has moved further from VWAP relative to the selected ATR multiplier.

This can be useful when monitoring expanding volatility or increasing distance from the VWAP reference.

Price Beyond the Outer Ribbon

Price has moved beyond the wider ATR-based boundary.

The corresponding RSI telemetry can provide additional momentum context for that extension.

The indicator does not assume that every outer-ribbon extension will reverse. The reading can instead be incorporated into the trader's broader price-action, trend, volatility, and risk analysis.

PRACTICAL MARKET SCENARIOS

1. Monitoring a Volatility Expansion

Price begins close to VWAP and then moves rapidly through the inner ribbon.

The ATR boundaries expand as volatility increases, allowing the trader to see the changing volatility environment directly on the chart.

The outer ribbon provides an additional reference for measuring the extent of the move.

2. Reviewing a Historical Price Extension

Price previously moved beyond the outer ribbon and produced an RSI label such as RSI 78.

The historical label remains attached to the completed candle, allowing the trader to review the momentum reading that accompanied the extension.

This can be useful when studying previous volatility and momentum behavior.

3. Monitoring Price Relative to VWAP

Price repeatedly moves around the central VWAP while remaining within the surrounding ribbons.

The VWAP provides a central volume-weighted reference, while the ATR corridors provide context for the distance of price from that reference.

This can be incorporated into broader range, trend, or mean-reversion analysis.

4. Monitoring a Live Extension

The current candle moves through an ATR ribbon while the live RSI telemetry is enabled.

The RSI label updates as the candle develops, allowing the trader to monitor the current momentum reading in real time.

Once the candle closes, historical processing can use the completed candle rather than the unfinished live value.

NON-REPAINTING & LIVE DATA BEHAVIOR

VWAP Ribbon Intelligence distinguishes between completed historical information and live forming-candle information.

Historical RSI labels are generated from completed candles and are retained at their corresponding historical locations after the candle closes.

The live RSI telemetry is intentionally dynamic because the current candle is still forming.

This means the live reading can change before candle close, while completed historical labels provide a fixed reference for chart review.

PARAMETERS

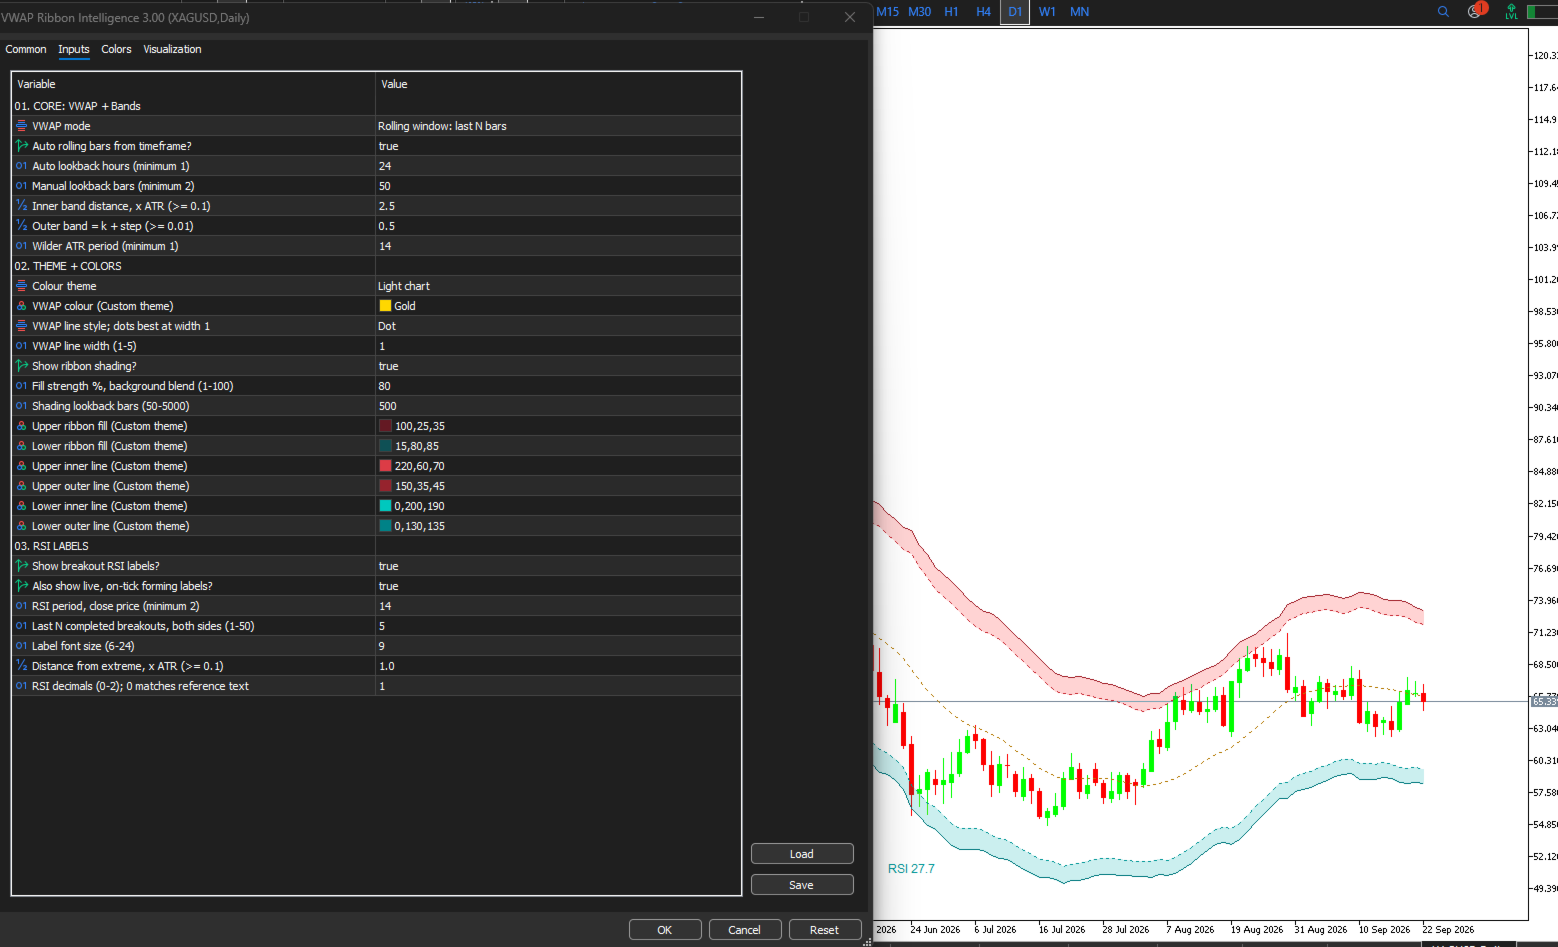
CORE — VWAP + BANDS

Configure the primary calculation:

  • VWAP calculation mode

  • Rolling VWAP window

  • ATR period

  • Inner ribbon multiplier

  • Outer ribbon multiplier

THEME + COLORS

Choose between the available visual presets:

  • Midnight Gold

  • Neon

  • Ocean

  • Light Chart

  • Custom

Additional visual settings control ribbon appearance and historical display depth.

RSI LABELS

Configure:

  • Historical RSI labels

  • Live forming-bar RSI

  • Font size

  • Decimal precision

  • Label offset

  • Historical label depth

The default configuration is designed to provide the main VWAP, ribbon, and RSI functionality without requiring extensive setup.

ASSET & TIMEFRAME COMPATIBILITY

VWAP Ribbon Intelligence is designed for use on instruments available through MetaTrader 5, including:

  • Forex

  • Gold

  • Indices

  • Commodities

  • Crypto

It can be used across intraday and higher timeframes, including:

M1, M5, M15, M30, H1, H4 and D1

The VWAP calculation uses the volume data supplied by the broker for the selected instrument.

TECHNICAL INFORMATION

VWAP Ribbon Intelligence is implemented as a native MQL5 indicator.

The product does not require:

  • External DLL files

  • Web requests

  • External services

  • Third-party software

The indicator performs its calculations directly within MetaTrader 5.

Rolling calculations are designed to avoid unnecessary repeated historical processing when updating the rolling VWAP.

WHO IS THIS INDICATOR FOR?

VWAP Ribbon Intelligence can be useful for traders who want to combine:

Volume-weighted price

with

ATR-based volatility context

and

RSI momentum information

in a single chart.

It can be used as a standalone analytical reference or alongside a broader trading methodology involving price action, market structure, trend analysis, volume, or other confirmation tools.

It does not generate a mandatory BUY or SELL decision.

100% FREE FOR THE MQL5 COMMUNITY

VWAP Ribbon Intelligence is available completely free.

There is:

  • No subscription

  • No trial period

  • No DLL requirement

  • No external service requirement

  • No separate purchase required

Download the indicator through the MQL5 Market and add it directly to your MetaTrader 5 charts.

PART OF THE VWAP TOOLKIT

If you want to extend the VWAP framework with additional analysis, the following products provide complementary functionality:

VWAP SNIPER VOLUME PROFILE PRO

Extends VWAP analysis with a dynamic volume profile including Point of Control (POC), Value Area High/Low (VAH/VAL), and High Volume Nodes (HVN).

VWAP SNIPER REVERSAL PRO

Adds additional reversal analysis around VWAP using volume, momentum, and candle-based conditions.

CONSOLIDATION INTELLIGENCE PRO

Provides a separate framework for analysing consolidation structure, range behavior, and price-density conditions.

GET VWAP RIBBON INTELLIGENCE

Use VWAP, dynamic ATR volatility ribbons, and RSI telemetry together in one MetaTrader 5 indicator.

Download VWAP Ribbon Intelligence through the MQL5 Market and explore the indicator on your own charts.

Free for the MQL5 community.

VWAP indicator | MT5 VWAP | MetaTrader 5 VWAP | Rolling VWAP | Daily VWAP | Wilder ATR | ATR volatility bands | VWAP ribbons | RSI indicator | RSI breakout | volatility indicator | Forex indicator | Gold indicator | XAUUSD indicator | MT5 free indicator
추천 제품
Follow The Line MT5
Oliver Gideon Amofa Appiah
4.6 (35)
This indicator obeys the popular maxim that: "THE TREND IS YOUR FRIEND" It paints a GREEN line for BUY and also paints a RED line for SELL. (you can change the colors). It gives alarms and alerts of all kinds. IT DOES NOT REPAINT and can be used for all currency pairs and timeframes. Yes, as easy and simple as that. Even a newbie can use it to make great and reliable trades. NB: For best results, get my other premium indicators for more powerful and reliable signals. Get them here: https://www.m
FREE
HMA Scalper Pro
Vladimir Shumikhin
5 (1)
HMA Scalper Pro for MetaTrader 5 HMA Scalper Pro는 2005년 Alan Hull이 처음 발표한 Hull Moving Average (HMA) 알고리즘을 기반으로 하는 MetaTrader 5용 추세 지표입니다. 이 지표는 현재 추세 방향을 분석하고 Hull Moving Average 알고리즘을 기반으로 구축된 평활선을 표시하도록 설계되었습니다. 기존 이동 평균과 비교하여 이 알고리즘은 라인의 부드러움을 유지하면서 지연을 줄이도록 설계되었습니다. HMA Scalper Pro를 사용하면 추세 방향의 변화를 시각적으로 추적할 수 있으며 다양한 금융 상품의 기술적 분석에 사용할 수 있습니다. 유사한 알고리즘을 사용한 자동 거래가 필요하시다면, 동일한 개념을 기반으로 개발된 HMA Scalper Pro EA 트레이딩 어드바이저를 확인하십시오. HMA Scalper Pro EA: https://www.mql5.com/en/market/product/
FREE
AXR Market Check
Stoyan Kirilov Karlov
5 (2)
AXR Market Check 는 현재 차트 환경을 한눈에 이해하고 싶은 트레이더를 위한 무료 MetaTrader 5 시장 준비도 지표입니다. AXR 도구 라인의 일부입니다. 업데이트와 연락 옵션은 공식 MQL5 페이지를 이용해 주세요: AXR MQL5 Channel: 제품 업데이트, 릴리스 노트, 새로운 AXR 도구 Telegram: 판매자 프로필 열기 ; Telegram 연락처는 프로필 설명에 표시되어 있습니다. 세션 상태, 뉴스 타이밍, 일일 범위, 변동성, 스프레드 압력, 시장 구조 및 일일 프로파일 레벨을 하나의 깔끔한 시각적 대시보드에 결합합니다. 핵심 질문: 현재 시장은 지금 관찰할 만큼 충분히 활발하고 명확하며 관련성이 있는가? 왜 도움이 되는가 셋업이 중요해지기 전에 시장 환경이 먼저 중요합니다. 차트가 흥미롭게 보일 수 있지만 세션이 약하거나, 일일 범위가 이미 많이 사용되었거나, 변동성이 너무 낮거나, 스프레드가 비싸거나, 중요한 뉴스가 가까울 수 있습니다.
FREE
The CV MACD Indicator is a modern and professional momentum indicator designed to analyze trend strength, market direction and potential reversals. By combining the MACD line, signal line and histogram, the indicator helps traders identify market momentum and high-quality trading opportunities with clarity and precision. Features: Precise MACD momentum analysis Early trend reversal detection Clear histogram for market strength visualization Adjustable Fast, Slow and Signal periods Visual Buy & S

FREE
Engulfing Stochastic
John Davis
2.5 (2)
We have all seen a currency pair enter the overbought or oversold territory and stay there for long periods of time. What this indicator does is gives you the emphasis. So if you are looking for reversals then you may want to take notice when oversold territory is entered into with a bullish engulfing candle or if the trend is your thing then check for bearish engulfing candles while entering oversold. This indicator will show a downward arrow when it detects a bearish engulfing candle while cro
FREE
HiperCube Renko Candles
Adrian Lara Carrasco
HiperCube Renko Candles에 오신 것을 환영합니다. 다윈엑스 제로 25% 할인 코드: DWZ2328770MGM 이 지표는 시장이 Renko Candle Style로 변환되는 실제 정보를 제공합니다. 정의 Renko 차트는 가격 변동을 측정하고 표시하는 재무 차트의 한 유형으로, 가격 변동을 나타내는 벽돌(또는 막대)을 사용합니다. 전통적인 캔들스틱 차트와 달리 Renko 차트는 시간 기반 정보를 표시하지 않고 가격 변동에만 초점을 맞춥니다. 기능: 별도 창의 지표 캔들 색상 사용자 정의 핍 단위의 캔들/벽돌 크기 사용자 정의 Chatgpt 와 AI를 사용하여 개발되었습니다. Renko를 사용한 예시 전략: 추세 식별 Renko 캔들로 풀백과 인클루핑을 기다림 진입 인클루핑의 SL 하위 위험 보상 TP 1:2, 1:3... 이것은 예시이며 기본 또는 새로운 전략이 될 수 있지만 실제 계정에서 사용하기 전에 시도하고 테스트해 보세요. 이 정보는 Renko 캔들 hi
FREE
Mitimom
Danil Poletavkin
The indicator is based on Robert Miner's methodology described in his book "High probability trading strategies" and displays signals along with momentum of 2 timeframes. A Stochastic oscillator is used as a momentum indicator. The settings speak for themselves period_1 is the current timeframe, 'current' period_2 is indicated - the senior timeframe is 4 or 5 times larger than the current one. For example, if the current one is 5 minutes, then the older one will be 20 minutes The rest of the s

FREE
Simple Trend Direction MT5
Khalaf Hamza Mohammad Yousef
This is a FREE Trend Direction Indicator for MetaTrader 5. Features: Identifies market trend direction Uses EMA 50 and EMA 200 Non-repainting logic Clear visual display Suitable for manual trading Free version includes: - Single timeframe - Trend direction only - No alerts If you need: Alerts Multi-timeframe version EA automation Custom modifications My Name is Khalaf Hamza , You can contact me for freelance work --> khalaf.hamza.hi@gmail.com

FREE
Phoenix Momentum 5 Star
Nigel Nii Darku Narnor Darko
This indicator, "Phoenix Volume Amazing", is a sophisticated Volume Delta and Order Flow Dashboard. Unlike standard volume indicators that only show total activity, this tool dissects the internal "tug-of-war" between buyers and sellers in real-time. Core Functionality The indicator calculates Delta (the difference between buying volume and selling volume) to provide a "under the hood" look at market sentiment. It uses a custom-built GUI (Graphical User Interface) panel to display these metrics

FREE
Trendline mt5 indicator

David Muriithi
4 (2)
Are you tired of drawing trendlines every time you're analyzing charts? Or perhaps you would like more consistency in your technical analysis. Then this is for you. This indicator will draw trend lines automatically when dropped on a chart. How it works Works similar to standard deviation channel found on mt4 and mt5. It has 2 parameters: 1. Starting Bar 2. Number of bars for calculation The   starting bar   is the bar which drawing of the trend lines will begin, while the   number of bars for c
FREE
SMC Trend Momentum – Adaptive Trend and Momentum Oscillator SMC Trend Momentum is a momentum oscillator plotted in a separate window. The indicator combines a Donchian position bias with a ZigZag leg normalization and transforms this into a smoothed, color‑coded histogram for assessing trend direction and momentum changes. Optionally, a higher timeframe filter can be applied. The indicator is designed to be flexible for different trading styles (short‑term, swing, indices, FX) using ready‑to‑u
FREE
Donchian Breakout And Rsi
Mattia Impicciatore
4.5 (2)
개요 이 지표는 클래식 돈치안 채널(Donchian Channel) 의 향상된 버전으로, 실전 트레이딩을 위한 다양한 기능이 추가되었습니다. 표준 세 개의 선(상단, 하단, 중앙선) 외에도 브레이크아웃 을 감지하여 차트에 화살표로 시각적으로 표시하며, 차트를 깔끔하게 보기 위해 현재 추세 방향의 반대 라인만 표시 합니다. 지표 기능: 시각적 신호 : 브레이크아웃 시 컬러 화살표 표시 자동 알림 : 팝업, 푸시 알림, 이메일 RSI 필터 : 시장의 상대 강도를 기반으로 신호 검증 사용자 맞춤 설정 : 색상, 선 두께, 화살표 코드, RSI 임계값 등 동작 원리 돈치안 채널은 다음을 계산합니다: 상단선 : 최근 N개의 종가 완료 캔들에서 가장 높은 고가 하단선 : 최근 N개의 종가 완료 캔들에서 가장 낮은 저가 중앙선 : 고가와 저가의 평균값 상방 브레이크아웃 은 종가가 상단선을 돌파할 때 발생하며, 하방 브레이크아웃 은 종가가 하단선 아래로 내려갈 때 발생합니다. 이 지표는: 세 개의
FREE
Transparent Renko Overlay Indicator Overview Transparent Renko Overlay Indicator displays Renko bricks directly on the main price chart as a semi-transparent overlay. Unlike traditional Renko charts that require a separate offline window, this indicator allows traders to view standard candlestick price action and Renko structure simultaneously on the same chart. The overlay helps identify trend direction, price noise, and consolidation phases without losing time-based market context. Key Feature
FREE
Dynamic Zones
Kee Huang Tan
Dynamic Supply and Demand indicator automatically identifies and displays Supply and Demand Zones on your chart based on price action patterns and market structure.  These zones represent areas where institutional buying or selling pressure has historically occurred, making them key levels for potential price reactions. This form of indicator takes inspiration from ICT as well as traditional Support & Resistance formation. **For the first 50 candles (number depends on LookBackCandles) when indic
FREE
Free automatic Fibonacci is an indicator that automatically plots a Fibonacci retracement based on the number of bars you select on the BarsToScan setting in the indicator. The Fibonacci is automatically updated in real time as new highest and lowest values appears amongst the selected bars. You can select which level values to be displayed in the indicator settings. You can also select the color of the levels thus enabling the trader to be able to attach the indicator several times with differe
FREE
Prometheus Analyst
Humphrey Mangera
PROMETHEUS TECHNICAN VERSION Free | By THE SONS A gift from The Sons — no strings, no trial, no expiry. Every trader deserves access to professional-grade market intelligence. That belief is why Prometheus Technical Version exists, and why it costs nothing. Consider it our handshake to the trading community. What You're Getting This is not a simplified tool dressed up as a gift. Prometheus Technican Version is a fully built, institutional-quality technical analysis indicator running a dual-model
FREE
Multi-timeframe trend indicator based on the ADX / ADXWilder indicator with Fibonacci levels The indicator shows trend areas using ADX or ADXWilder indicator data from multiple timeframes. The impulse mode of the indicator allows you to catch the beginning of a trend, and several "Screens" with different timeframes allow you to filter out market noise. Fibonacci levels are added to the price chart, which have flexible settings. How the indicator works: if PDI is greater than NDI, then   it`s
FREE
Montecarlo forecast
Giuseppe Pajusco
Description of the MonteCarloBands Indicator The   MonteCarloBands   indicator is a forward-looking analytical tool that employs the Monte Carlo method to project potential future price scenarios of a financial asset. It appears as a set of five percentile bands extending into the future, visualizing a "probability cone" based on the historical behavior of the market. Visual Appearance: P50 (Median) : Solid green line at the center, representing the expected median path P25 and P75 : Two orange
FREE
RSI Divergence F
Andrey Dik
5 (3)
A professional tool for trading - the divergence indicator between the RSI and the price, which allows you to receive a signal about a trend reversal in a timely manner or catch price pullback movements (depending on the settings). The indicator settings allow you to adjust the strength of the divergence due to the angle of the RSI peaks and the percentage change in price, which makes it possible to fine-tune the signal strength. The indicator code is optimized and is tested very quickly as par
FREE
Auto Fibonacci
Ali Gokay Duman
5 (3)
This indicator calculates fibonacci levels via moving averages trend and draw these lines. You can change fast and slow Moving Averages settings for customization. Inputs: Fast MA Time Period :  64 Fast MA Shift: 0 Fast MA Method: Smoothed Fast MA Apply To: Median Price Slow MA Time Period: 32 Slow MA Shift: 0 Slow MA Method: Smoothed Slow MA Apply To: Median Price ZigZag: False ZigZag Color: Red ZigZag Type: DashDot ZigZag Width: VeryThin Fibo Settings TrendFibonacci: True FiboTrendColor: Black
FREE
Heiken Ashi Smoothwave
Alexandre Vincent Traber
개요 Heiken Ashi Smoothwave는 메인 차트 창에서 직접 차트를 스무딩된 헤이킨아시 캔들로 변환하여 표준 캔들을 대체하고 더 깔끔한 추세 뷰를 제공합니다. 별도의 창 없이, 산만함 없이. 작동 방식 각 봉마다 실제 가격 데이터로부터 헤이킨아시 OHLC 값을 계산합니다. 컬러 헤이킨아시 캔들을 메인 차트 위에 직접 표시합니다. 네이티브 차트 캔들을 자동으로 숨기고 헤이킨아시 캔들만 표시합니다. 인디케이터를 제거하면 표준 캔들이 자동으로 복원됩니다. 입력 파라미터 설정 가능한 파라미터가 없습니다. 부착만 하면 바로 사용 가능합니다. 권장 설정 모든 심볼, 모든 타임프레임. 외환, 금, 지수 및 MetaTrader 5에서 사용 가능한 모든 상품에서 작동합니다. 스크린샷 Heiken Ashi Smoothwave 적용된 차트, 네이티브 캔들 자동 숨김. 면책 조항 이 인디케이터는 추세 분석을 위한 시각적 도구이며, 매매 신호 생성기가 아닙니다. 과거 실적과 시각적 스무
FREE
Bosenic TrendCandles
Puguh Andrie Setia Aji
Bosenic V1 Trend Candles Bosenic V1 Trend Candles is a lightweight MT5 chart indicator designed to visually display the trend condition used by the Bosenic V1 trading system. Instead of using a separate trend calculation, the indicator applies the same baseline calculation used by the EA. This allows traders to see the underlying bullish or bearish condition directly on the main price chart. How It Works The indicator calculates EMA values separately from the Open, High, Low, and Close prices us
FREE
RaysFX Pattern Detector è uno strumento di analisi tecnica all'avanguardia progettato per i trader che basano le loro decisioni sull'azione dei prezzi (Price Action). Questo indicatore scannerizza automaticamente il grafico in tempo reale per identificare e segnalare i pattern candlestick più affidabili e noti, eliminando il lavoro manuale e aiutandoti a non perdere mai un'opportunità di trading. Che tu sia un trader discrezionale, un principiante che sta imparando a riconoscere le candele, o un
FREE
Cross MA histogram
Mariusz Piotr Rodacki
The Cossover MA Histogram indicator is a simple tool showing the trend based on crossover of moving averages. Simply specify two mobving averages and addicional parameters like MA method and Applied price. When fast MA is above slow MA the histogram is green, indicating an uptrend. When MA fast is below MA slow the histogram is red, indicating an downtrend.
FREE
FX Clock
Abderrahmane Benali
FXClock – Professional Clock Indicator for Traders Please leave a 5 star rating if you like this free tool! Thank you so much :) The FXClock indicator is a practical and simple tool that displays time directly on your trading platform, allowing you to track multiple key pieces of information at the same time. It is specially designed to help traders synchronize their trading with market hours and global sessions. Key Features: Displays the broker server time with precision. Displays your local c
FREE
Servo Momentum Scalper
Abhishek Dubey
5 (1)
"Dominate the charts with cold, calculated precision. Servo Momentum Scalper strips away market noise to deliver raw, high-probability entry triggers. This isn't just an indicator; it’s your tactical advantage in a volatile market. Built for the relentless, designed for those who refuse to lose. Stop chasing the trend—capture it the moment it births. Download now and rewrite your trading reality."
FREE
RSI Divergence L
Vasin Chatkittisuk
RSI Divergence Lite (Free) - MT5 Indicator ------------------------------------------------- This is the Lite (free) version of RSI Divergence. - Detects basic Bullish and Bearish divergence between price and RSI - Works only on M15 timeframe - No divergence lines, no alerts - Fixed internal settings (RSI 14, pivot sensitivity, thresholds) - For educational and testing purposes For the full PRO version (multi-timeframe, alerts, divergence lines, advanced UI), please upgrade to RSI Divergence
FREE
Qunity ADX Trend
Rodion Kachkin
Trend indicator based on the ADX / ADXWilder indicator The indicator shows trend areas using ADX or ADXWilder indicator data. How the indicator works: if PDI is greater than NDI, then it`s bullish movement; if PDI is less than NDI, then it`s bearish movement; if ADX is less than or equal to the filter value specified in the parameters, then there is no movement state. Input parameters of the indicator: Calculate Timeframe - timeframe for calculation; ADX Type - type of ADX calculation based
FREE
ICONIC TRENDLINE for MetaTrader 5 Title: ICONIC TRENDLINE: Advanced Trend Indicator with MTF Panel & Alerts Short Description Tired of identifying trends too late and getting tricked by false signals in sideways markets? The ICONIC TRENDLINE indicator for MT5 is your solution. This advanced tool combines intelligent EMA logic with the power of the ADX to provide you with clear, early, and filtered trend signals. With a dynamic trendline, a multi-timeframe dashboard, and instant push notificatio
FREE
The indicator identifies when a divergence occurs between price and an indicator or oscillator. It identifies both regular and hidden divergences. Combined with your own rules and techniques, this indicator will allow you to create (or enhance) your own powerful system. For higher probability setups I can recommend you to use my Supply Demand indicator and trade only if the divergence occurs inside a zone. Supply zone for bearish div and demand zone for bullish div. The optimal scenario is if it
FREE
이 제품의 구매자들이 또한 구매함
SMART TREND TRADING SYSTEM — 특별 혜택 트레이딩 시스템, 자동매매 EA, 교육과 지원을 하나로. MT5용 Smart Trend Trading System을 99 USD에 구매하고, 시스템의 신호를 자동매매에 활용할 수 있는 Smart Universal Expert Advisor를 무료로 받으세요 . STTS는 추세 방향, 진입·청산 신호, 반전 구간, 주요 가격 수준을 차트에 모아 보여줍니다. 시스템을 참고해 수동으로 거래하거나, 포함된 EA를 연결하여 선택한 설정에 따라 자동으로 거래를 실행할 수 있습니다. 현재 가격인 99 USD는 앞으로 이루어지는 30건의 구매에 적용됩니다. 이후 가격은 149 USD로 인상됩니다. 전체 패키지 구성 구매 시 다음 항목이 포함됩니다. • MT5용 Smart Trend Trading System. • Smart Universal Expert Advisor — 무료. • 전체 STTS PDF 사용자 설명서. • STTS
Trend Sniper X
Sarvarbek Abduvoxobov
4.9 (39)
Trend Sniper X 는 트레이더가 추세 방향과 잠재적 반전 지점을 명확하고 정확하게 포착할 수 있도록 도와주는 MetaTrader 5용 멀티 타임프레임 추세 추종 지표입니다. MT4용: https://www.mql5.com/en/market/product/193245 가격 정보: 현재 가격은 프로모션 할인가이며, 향후 업데이트 및 새로운 기능이 출시됨에 따라 변동될 수 있습니다. 보너스 혜택: 본 지표 전용 무료 자동매매 Assistant EA를 받으시려면 구매 후 작성자에게 메시지를 보내주시기 바랍니다. Code2Profit 채널 멀티 타임프레임 분석으로 시장을 마스터하세요! Trend Sniper X로 승률을 극대화하는 방법: 핵심 규칙 및 세션 팁 기술 사양 플랫폼 MetaTrader 5 지표 유형 멀티 타임프레임 추세 지표 운용 타임프레임 모든 차트 타임프레임 지원, 독립적으로 선택 가능한 상위 타임프레임(M1–MN1) 주요 상품 외환, 금(XAUUSD) 및 기타 C
Zoryk Gold
Reda El Koutbane
5 (12)
ZORYK — MetaTrader 5용 XAUUSD 전문 신호 및 트레이드 플래닝 시스템 이런 경험이 있을 것입니다. 골드를 분석하고 진입을 기다린 뒤 마침내 포지션을 열었지만 가격이 곧바로 반대 방향으로 움직입니다. 너무 일찍 청산하거나 Stop Loss를 옮기거나 몇 초 동안 망설입니다. 그 후 시장은 내가 없이도 처음 예상했던 목표까지 정확히 움직입니다. 문제는 항상 방향이 아니었습니다. 진짜 문제는 불확실성이었습니다. 정확한 진입 위치를 몰랐습니다. 어느 지점에서 원래의 트레이드 아이디어가 무효가 되는지 몰랐습니다. 가까운 수익을 확보해야 할지 더 큰 움직임을 기다려야 할지 판단하기 어려웠습니다. 현재 setup이 정말 강한지 아니면 단지 새로운 거래를 억지로 찾고 있는지도 확신하기 어려웠습니다. 골드는 매우 빠르게 움직입니다. 명확한 계획이 없다면 좋은 분석도 몇 초 만에 나쁜 결정으로 바뀔 수 있습니다. ZORYK는 이 문제를 해결하기 위해 개발되었습니다.
SMC Intraday Formula
Kareem Abbas
5 (24)
먼저 솔직하게 말하겠습니다. 어떤 인디케이터도 단독으로 당신을 수익성 있게 만들어주지 않습니다. 누군가 그렇게 말한다면, 그는 당신에게 꿈을 파는 것입니다. 완벽한 매수/매도 화살표를 보여주는 모든 인디케이터는 완벽하게 보이도록 만들 수 있습니다 — 단지 올바른 과거 구간을 확대하고 승리한 거래만 캡처하면 됩니다. 우리는 그렇게 하지 않습니다.  SMC Intraday Formula는 도구입니다. 시장 구조를 읽고, 가장 높은 확률의 가격 구간을 표시하며, 현재 스마트 머니의 흐름이 어떻게 보이는지 아주 단순한 언어로 보여줍니다. 최종 결정은 여전히 당신이 합니다. 실행도 당신이 합니다. 하지만 이제는 희망이 아니라 정확성으로 거래하게 됩니다. 우리는 이 인디케이터를 지난 약 3년 동안 골드(XAUUSD) 및 주요 외환 통화쌍의 데이 트레이딩 스캘핑에 사용해 왔습니다. M1, M5, M15, M30에서 우리의 핵심 도구입니다. 이 도구는 미래를 예측하려 하지 않습니다 — 지금 형성
Unix Scalper
Issam Kassas
5 (3)
UNIX SCALPER — 특별 혜택 매매 기회를 찾고, 거래 계획을 확인하고, 실행 방법을 선택하세요. MT5용 UNIX Scalper를 99 USD에 구매하면 신호 자동매매에 사용할 수 있는 Smart Universal Expert Advisor를 무료로 받으실 수 있습니다. UNIX Scalper는 시장 분석, BUY/SELL/WAIT 판단, Entry, Stop Loss, TP1 및 TP2 가격 수준을 하나의 정돈된 패널에 제공합니다. 거래 계획에 따라 수동으로 매매하거나, 포함된 EA를 연결하여 선택한 설정에 따라 자동으로 실행할 수 있습니다. 현재 가격인 99 USD는 앞으로 30건의 구매에 적용됩니다. 이후 가격은 149 USD로 인상됩니다. 전체 패키지 구성 구매 시 다음 항목이 포함됩니다. • MT5용 UNIX Scalper. • Smart Universal Expert Advisor — 무료. • UNIX Scalper 전체 PDF 사용자 매뉴얼. • UNIX
SuperScalp Pro
Van Minh Nguyen
4.65 (34)
SuperScalp Pro - Professional Multi-Layer Confluence Scalping System SuperScalp Pro는 클래식 Supertrend에 여러 지능형 확인 필터를 추가한 고급 스캘핑 지표입니다. 더 높은 확률의 Buy/Sell 거래 기회를 식별하는 데 도움을 주며, 잘못된 신호를 크게 줄이는 데 도움을 줍니다. 명확한 Buy 및 Sell 화살표가 차트에 직접 표시되며, ATR 기반 Stop Loss 및 Take Profit 수준이 실시간으로 자동 계산됩니다. 구매 후 설정 방법 및 권장 구성에 대한 안내가 필요하시면 저에게 문의해 주세요. SuperScalp Pro Auto Trader를 사용하여 신호를 쉽게 자동화할 수 있습니다: [Auto Trader] 권장 설정 파일 다운로드: [Set File] 전체 문서는 제품 블로그에서 확인할 수 있습니다: [User Guide] 업데이트를 확인하려면 공식 채널에 참여하세요: [Official C
Reversion King Indicator
Eugen-alexandru Zibileanu
5 (8)
새로운 왕의 등장 - 인디케이터 + 주문 관리 표시(TP1 + TP2 + TP3) + 선택형 텔레그램 시그널 전송 기능 포함 (무료) (완전한 트레이딩 및 시그널 시스템) 골드를 위한 최고의 EA: Gold Slayer 이 인디케이터는 고급 전략, 사용자 지정 가능한 주문 관리 시스템, 그리고 엔벨로프 확장을 결합한 평균 회귀(mean reversion) 시스템을 포함하고 있습니다. 또한 RSI와 같은 여러 지능형 확인 필터를 통해 높은 확률의 반전 진입 구간을 포착하여 BUY 및 SELL 시그널을 제공합니다. 단순히 거래 방법만 배우는 것이 아니라, 여러 포지션을 효과적으로 관리하고 이전에 수익 중인 오픈 포지션으로 손실 거래를 커버하는 방법까지 익힐 수 있습니다. M5 전용으로 설계 및 최적화되었으며, 유동성이 풍부해 시그널이 더 깔끔하고 신뢰도 높은 BTCUSD와 XAUUSD에서 뛰어난 성능을 발휘합니다. 이 인디케이터는 ATR 기반으로 자동 계산된 진입가, 손절가, 익절가와
GoldenX Entry MT5
Kareem Abbas
5 (16)
GoldenX Entry는 MT5용 인디케이터로, 적응형 Smart Entry Trend 알고리즘, 신호 스코어링 시스템, 시장 레짐 감지 기능, 그리고 변동성 필터를 포함합니다. 각 신호에는 계산된 진입 레벨, 3개의 익절(TP1, TP2, TP3) 레벨, 그리고 손절(Stop-Loss) 레벨이 포함됩니다. 이 인디케이터는 다양한 시장 환경에 적응하도록 설계된 다중 분석 레이어 구조 위에 구축되어 있으며, 내장 최적화기와 통계 추적 시스템을 결합합니다. 또한 Risk-to-Reward(RR) 지표와 과거 거래 행동 기반의 정량 분석을 제공합니다. 시작은 간단합니다 — 선택한 타임프레임에서 최적화기를 실행한 뒤 차트에서 바로 인디케이터를 사용하면 됩니다. 핵심 기능 GoldenX Entry는 하나의 차트에서 신호 엔진, 트레이드 관리 기능, 그리고 과거 통계 추적을 통합합니다: - 내장 최적화기: 최적화기는 차트에서 원클릭으로 실행됩니다. 200개의 파라미터 조합을 두 단계 탐색
Neuro Poseidon MT5
Daria Rezueva
4.79 (53)
Neuro Poseidon is a new indicator by Daria Rezueva. It combines precise trading signals with adaptive TP/SL levels - creating best possible trades as a result! Message me and get  Neuro Poseidon Assistant  as a gift to automize your trading process! What makes it stand out? 1. Proven profitability on all assets and timeframes 2. Only confirmed BUY and SELL signals present on the chart 3. Adaptive TP & SL levels generated by the software for each trade 4. Easy to understand - suitable for al
Entry Points Pro for MT5
Yury Orlov
4.52 (151)
전설이 돌아왔습니다: Entry Points Pro 10. MQL5 마켓 Top-3 자리를 3년간 지켜온 전설적인 지표의 재출시입니다. 수백 개의 호평 리뷰(두 버전 합산 589개), 매일 이 지표로 거래하는 수천 명의 트레이더, 31,000회 이상의 데모 다운로드   MT4+MT5 . 지난 5년간 여러분이 남긴 리뷰를 하나도 빠짐없이 읽었고, 약속 대신 그 답을 버전 10에 담았습니다. 1999년부터 시장에서 활동하며 정직함과 자신의 평판, 그리고 고객을 소중히 여기는 개발자가 만들었습니다. Entry Points Pro의 진입 시그널은 절대 리페인팅되지 않습니다. 그리고 이번에는 개발자의 말뿐이 아니라 검증 가능한 사실입니다: 확정 시그널은 캔들 종가에서만 표시되며, 자동화 테스트에서 리페인팅 0건 이 확인되었습니다(EURUSD, XAUUSD, BTCUSD에서 2,486,568회의 불변조건 검사 — 위반 0건). 검증 방법은 공개되어 있으니 전략 테스터에서 직접 재현해 보실 수
Gold Entry Sniper
Tahir Mehmood
5 (20)
Gold Entry Sniper – 골드 스캘핑 & 스윙 트레이딩을 위한 전문 다중 시간 프레임 ATR 대시보드 Gold Entry Sniper 는 XAUUSD 및 기타 종목에 대해 정확한 매수/매도 신호 를 제공하는 고급 MetaTrader 5 지표입니다. ATR 트레일링 스톱 로직 과 다중 시간 프레임 분석 을 기반으로 설계되어 스캘핑과 스윙 트레이딩 모두에 적합합니다. 주요 기능 및 장점 다중 시간 프레임 분석 – M1, M5, M15 추세를 한눈에 확인. ATR 기반 트레일링 스톱 – 변동성에 따라 자동 조정. 전문 차트 대시보드 – 신호 상태, ATR 레벨, 회귀선, 매매 방향 표시. 명확한 매수/매도 마커 – 자동 화살표와 텍스트 라벨. 종료 알림 & 거래 관리 – 수익 보호를 위한 자동 종료 감지. 완전 사용자 설정 가능 – 대시보드 위치, 색상, ATR/회귀선 파라미터 조정. 골드(XAUUSD) 최적화 – M1~M15 스캘핑에 완벽, 외환/지수/암호화폐에도 적용 가능.
Welcome to ENTRY IN THE ZONE AND SMC MULTI TIMEFRAME Entry In The Zone and SMC Multi Timeframe is a real-time market analysis tool based on Smart Money Concepts (SMC), designed to analyze market structure, price direction, and key trading zones. It supports both Single-Timeframe Analysis and Multi-Timeframe Analysis, providing a clearer view of the overall market structure across multiple timeframes, with real-time BUY / SELL signals that do not repaint. It is designed to help filter trading opp
Divergence Bomber
Ihor Otkydach
4.89 (94)
이 지표를 구매하신 분께는 다음과 같은 혜택이 무료로 제공됩니다: 각 거래를 자동으로 관리하고, 손절/익절 수준을 설정하며, 전략 규칙에 따라 거래를 종료하는 전용 도우미 툴 "Bomber Utility" 다양한 자산에 맞게 지표를 설정할 수 있는 셋업 파일(Set Files) "최소 위험", "균형 잡힌 위험", "관망 전략" 모드로 설정 가능한 Bomber Utility의 셋업 파일 이 전략을 빠르게 설치, 설정, 시작할 수 있도록 돕는 단계별 영상 매뉴얼 주의: 위의 모든 보너스를 받기 위해서는 MQL5 개인 메시지 시스템을 통해 판매자에게 연락해 주세요. 독창적인 커스텀 지표인 “Divergence Bomber(다이버전스 봄버)”를 소개합니다. 이 지표는 MACD 다이버전스(괴리) 전략을 기반으로 한 올인원(All-in-One) 거래 시스템입니다. 이 기술 지표의 주요 목적은 가격과 MACD 지표 간의 다이버전스를 감지하고, **향후 가격이 어느 방향으로 움직일지를 알려주
Tokyo mt5 Indicator
Vasiliy Strukov
5 (1)
Tokyo Indicator는 추세 방향, 잠재적 거래 신호 및 시장 상황을 명확하고 시각적으로 보여줍니다. 색상으로 구분된 계단식 추세선은 강세 구간(파란색)과 약세 구간(자홍색)을 명확히 구별해 줍니다. 추세가 전환될 때 나타나는 방향성 화살표는 잠재적인 매수 및 매도 기회를 강조하여 보여줍니다. 통합 대시보드는 현재 신호, 시장 성향(bias), 모멘텀, 변동성, 신호 품질 등의 정보를 한눈에 파악할 수 있도록 구성되어 있습니다. 이를 통해 트레이더는 별도의 패널을 오갈 필요 없이 가격 움직임(price action)과 지표의 데이터를 동시에 분석할 수 있습니다. 깔끔한 차트 화면과 간결한 시장 개요를 제공하는 Tokyo Indicator는 체계적인 추세 분석과 거래 결정을 지원합니다. 모든 시간대와 다양한 자산(특히 금)에서 활용할 수 있습니다. 추세 방향, 잠재적 거래 신호 및 시장 상황을 명확하고 시각적으로 보여줍니다. 색상으로 구분된 계단식 추세선은 강세 구간(파란색)
M1 Sniper MT5
Oleg Rodin
5 (7)
M1 SNIPER 는 사용하기 쉬운 거래 지표 시스템입니다. M1 시간대에 맞춰 설계된 화살표 지표입니다. 이 지표는 M1 시간대 스캘핑을 위한 단독 시스템으로 사용할 수 있으며, 기존 거래 시스템의 일부로도 사용할 수 있습니다. 이 거래 시스템은 M1 시간대 거래용으로 특별히 설계되었지만, 다른 시간대에도 사용할 수 있습니다. 원래는 XAUUSD와 BTCUSD 거래를 위해 이 방법을 설계했지만, 다른 시장 거래에도 유용하다는 것을 알게 되었습니다. 이 지표의 신호는 추세 방향과 반대로 거래될 수 있습니다. 저는 지표의 신호를 활용하여 양방향으로 거래할 수 있도록 돕는 특별한 거래 기법을 알려드립니다. 이 방법은 특별한 동적 지지선과 저항선 가격 영역을 활용하는 것을 기반으로 합니다. 구매하시면 M1 SNIPER 화살표 지표를 바로 다운로드하실 수 있습니다. 또한, 아래 스크린샷에 표시된 Apollo Dynamic SR 지표는 M1 SNIPER 도구를 사용하는 모든 사용자에게 무료로
Atomic Analyst MT5
Issam Kassas
4.45 (58)
ATOMIC ANALYST — 특별 혜택 시장 분석 도구, 자동매매 EA, 교육과 지원을 하나로. MT5용 Atomic Analyst를 99 USD에 구매하고, 지표의 신호를 자동매매에 활용할 수 있는 Smart Universal Expert Advisor를 무료로 받으세요 . Atomic Analyst는 가격 움직임 분석, 추세 방향, 진입·청산 신호, 손절 수준, 여러 익절 수준을 차트에 모아 보여줍니다. 분석을 참고해 수동으로 거래하거나, 포함된 EA를 연결하여 선택한 설정에 따라 자동으로 거래를 실행할 수 있습니다. 현재 가격인 99 USD는 앞으로 이루어지는 30건의 구매에 적용됩니다. 이후 가격은 149 USD로 인상됩니다. 전체 패키지 구성 구매 시 다음 항목이 포함됩니다. • MT5용 Atomic Analyst. • Smart Universal Expert Advisor — 무료. • 전체 Atomic Analyst PDF 사용자 설명서. • Atomic Ana
Gann Made Easy MT5
Oleg Rodin
5 (10)
Gann Made Easy 는 mr.의 이론을 사용하여 최고의 거래 원칙을 기반으로 하는 전문적이고 사용하기 쉬운 Forex 거래 시스템입니다. W.D. 간. 이 표시기는 Stop Loss 및 Take Profit Levels를 포함하여 정확한 BUY 및 SELL 신호를 제공합니다. PUSH 알림을 사용하여 이동 중에도 거래할 수 있습니다. 구매 후 거래 방법 안내 및 유용한 추가 지표를 무료로 받으시려면 저에게 연락주세요! 아마도 Gann 거래 방법에 대해 이미 여러 번 들었을 것입니다. 일반적으로 Gann의 이론은 초보자 거래자뿐만 아니라 이미 거래 경험이 있는 사람들에게도 매우 복잡한 것입니다. Gann의 거래 방식은 이론적으로 적용하기 쉽지 않기 때문입니다. 나는 그 지식을 연마하고 Forex 지표에 최고의 원칙을 적용하기 위해 몇 년을 보냈습니다. 표시기는 적용하기가 매우 쉽습니다. 차트에 첨부하고 간단한 거래 권장 사항을 따르기만 하면 됩니다. 지표는 지속적으로 시장 분석
Power Candles MT5
Daniel Stein
4.58 (12)
Power Candles V3 - 자체 최적화 강도 지표 파워 캔들 V3는 적용된 모든 차트에서 통화 및 상품의 강세를 실행 가능한 거래 계획으로 전환합니다. 단순히 캔들에 색상을 입히는 대신, 백그라운드에서 실시간 자동 최적화를 수행하여 현재 보고 있는 종목에 대한 최적의 손절매, 익절 및 신호 임계값을 제공합니다. 한 번의 클릭으로 실시간 거래에 적용할 수 있으며, 진입점, 손절매 및 익절 선이 정확한 가격에 맞춰 차트에 표시되고, 방향과 함께 알림이 발령됩니다. 이 도구는 Stein Investments 에코시스템의 일부입니다. 18개 이상의 도구와 함께 당신의 1대1 AI 트레이딩 멘토 Max.  항상 대기 중, 모든 인디케이터를 깊이 있게 이해, 무언가를 차근차근 생각해보고 싶은 순간에 도움을 줍니다.  https://stein.investments 에서 만나보세요 매 종가 바마다 3,000회 이상의 트레이딩 시뮬레이션. 9가지 강도 상태. 2가지 전략을 병렬로 테스트.
Axiom Matrix
Issam Kassas
5 (8)
Axiom Matrix — 특별 혜택 Axiom Matrix을 49 미국 달러에 구매하고 Smart Universal Expert Advisor를 무료로 받으세요. 시장을 탐색하세요. 기회를 비교하세요. 다음 차트를 선택하세요. Axiom Matrix는 여러 종목과 시간대의 분석을 하나의 대시보드에 모읍니다. 모든 차트를 따로 확인하지 않고 집중할 시장을 찾으세요. 종합시세 또는 선택한 종목을 여러 시간대에서 탐색. 추세, 모멘텀, 거래량, 변동성 및 시장 품질 정보 비교. Best Axiom Pick, 신호 상태 및 클릭 가능한 셀로 거래 조건 확인. Axiom Matrix는 분석 대시보드이며 거래를 실행하지 않습니다. 패키지 구성 Axiom Matrix Smart Universal Expert Advisor PDF 사용 설명서와 온라인 강좌. 설정 안내와 구매자 커뮤니티 이용 혜택. Smart Universal Expert Advisor는 별도의 보너스입니다. 이 제품의 직접적인
Trend Catcher ind mt5
Ramil Minniakhmetov
5 (18)
트렌드 캐처 인디케이터 트렌드 캐처 인디케이터는 개발자가 자체 개발한 맞춤형 적응형 트렌드 분석 지표들을 조합하여 시장 가격 움직임을 분석합니다. 단기적인 노이즈를 제거하고 근본적인 모멘텀 강도, 변동성 확대, 가격 구조 움직임에 집중하여 진정한 시장 방향을 파악합니다. 또한 이동 평균, RSI, 변동성 필터와 같은 맞춤형 지표들을 활용하여 가격을 평활화하고 트렌드를 필터링합니다. 실제 운영 모니터링 및 기타 제품은 다음 링크에서 확인하실 수 있습니다:   https://www.mql5.com/en/users/mechanic/seller 텔레그램에서는 EA나 설정 파일을 판매하지 않습니다. 사기이니 주의하세요. 모든 설정 파일은 블로그에서 무료로 제공됩니다. 중요! 구매 후 즉시 연락 주시면 사용 방법 및 보너스를 드립니다!
FiboSniper Pro
Van Minh Nguyen
5 (3)
FiboSniper Pro – Multi-Filter Fibonacci System with Auto SL/TP and Control Panel FiboSniper Pro는 동적 Fibonacci Envelopes와 여러 확인 필터를 결합하여 선별된 Buy 및 Sell 신호를 생성하는 기술적 지표입니다. Fibonacci 레벨은 Moving Average와 ATR을 기반으로 계산된 후 ADX, EMA, RSI, ATR, Volume, Time 및 Candle 구조를 통해 필터링됩니다. 이 지표는 ATR 기반의 자동 Stop Loss 및 Take Profit 레벨을 차트에 직접 표시하며, 빠른 설정 조정을 위한 인터랙티브 Control Panel을 제공합니다. 구매 후 권장 설정 파일과 자세한 사용 방법을 받으려면 저에게 문의해 주세요. Auto Trader X를 사용하여 FiboSniper Pro 신호를 자동화할 수 있습니다: [Auto Trader X] User Guide 및 Se
UZFX {SSS} 스캘핑 스마트 시그널 v5.0 MT5는 급변하는 시장에서 정확한 실시간 시그널을 필요로 하는 스캘퍼, 데이 트레이더, 스윙 트레이더를 위해 설계된 리페인팅이 없는 고성능 트레이딩 지표입니다. (UZFX-LABS)에서 개발한 이 지표는 가격 움직임 분석, 추세 확인 및 스마트 필터링을 결합하여 모든 통화 쌍과 시간대에서 높은 확률의 매수 및 매도 신호, 경고 신호, 추세 지속 기회를 생성합니다. 거래에 대한 망설임을 멈추고, 명확성, 정밀성, 그리고 규율 있는 시장 실행을 원하는 트레이더를 위해 설계된 체계적인 신호 시스템을 따르기 시작하세요. 제 말을 믿으세요. 이 지표는 MQL5에서 구할 수 있는 최고의 지표 중 하나입니다. 그러니 절대 놓치지 마세요!! “현명한 트레이더를 위한 스마트 신호” 지금 최신 버전 5.0이 출시되었으며, 사전 공지 없이 가격이 최대 $499.99까지 인상될 수 있으니 기회를 놓치기 전에 서둘러 구매하세요!! 최종 구매 전! 무료 체
Superhero
Ihor Otkydach
5 (3)
SUPERHERO 지표는 “올인원” 방식으로 설계된 다중 통화 거래 시스템입니다. 이 지표는 시장을 독자적으로 분석하여 포지션을 개설하고 청산할 시점에 대한 신호를 제공합니다. 손절매(Stop Loss) 및 익절(Take Profit) 주문을 활용하며, 위험 대비 수익 비율(R:R)은 1:1입니다. 이 시스템은 스마트폰으로 푸시 알림을 전송할 수 있으므로, PC에 묶여 있을 필요 없이 “이동 중에도” 매매를 할 수 있습니다. 이는 자체 거래 전문 회사에 안성맞춤입니다. 모든 고객님께 드리는 특별 혜택: 이 지표를 구매하시는 모든 분께는 제가 특별히 준비한 유틸리티를 선물로 드릴 예정이며, 이 유틸리티는 다음과 같은 기능을 제공합니다: 손절매 및 익절 주문을 자동으로 설정합니다 가격이 목표 수준에 도달하면 자동으로 포지션을 청산합니다 미결제 주문 거래를 지원합니다 평균화 거래 모드를 지원합니다 이 훌륭하고 매우 편리한 유틸리티를 선물로 받고 싶으시다면, SUPERHERO 지표를 구매하
CRT Candle Range Theory HTF MT5 - Ultimate CRT Indicator: 고급 ICT 개념 및 Malaysian SnR 트레이딩 시스템 가장 진보된 Candle Range Theory 지표로 마켓 메이커의 발자취를 마스터하십시오. Ultimate CRT Indicator를 사용하여 Smart Money Concepts(SMC)의 진정한 힘을 발휘하고 기관처럼 정확하게 거래하십시오. 진지한 트레이더를 위해 독점적으로 제작된 이 지표는 ICT Concepts(Inner Circle Trader)의 핵심 기둥인 매우 효과적인 Candle Range Theory(CRT)를 자동화하고 Malaysian Support and Resistance(SnR) 진입 방법과 FVG(Imbalance) 영역의 치명적인 정밀도로 이를 강화합니다. MT5에서 Forex, Crypto 또는 지수를 거래하든 이 알고리즘은 시장 소음을 제거하고 가짜 돌파(fakeout)를 필터링하며
통화 강도 마법사는 성공적인 거래를 위한 올인원 솔루션을 제공하는 매우 강력한 지표입니다. 표시기는 여러 시간 프레임의 모든 통화 데이터를 사용하여 이 또는 해당 외환 쌍의 힘을 계산합니다. 이 데이터는 특정 통화의 힘을 확인하는 데 사용할 수 있는 사용하기 쉬운 통화 지수 및 통화 전력선의 형태로 표시됩니다. 필요한 것은 거래하려는 차트에 표시기를 부착하는 것뿐입니다. 표시기는 거래하는 통화의 실제 강세를 보여줍니다. 지표는 또한 추세와 거래할 때 유리하게 사용할 수 있는 구매 및 판매 거래량 압력의 극한값을 보여줍니다. 지표는 또한 피보나치에 기반한 가능한 대상을 보여줍니다. 표시기는 PUSH 알림을 포함한 모든 유형의 알림을 제공합니다. 구매 후 연락주세요. 나는 당신과 거래 팁을 공유하고 당신에게 무료로 훌륭한 보너스 지표를 줄 것입니다! 나는 당신에게 행복하고 유익한 거래를 기원합니다!
SMART PRICE ACTION CONCEPTS — 특별 혜택 구조를 확인하고, 구간을 파악하고, 거래 계획을 세우세요. MT5용 Smart Price Action Concepts를 49 USD에 구매하면 Smart Universal Expert Advisor를 무료로 받으실 수 있습니다. Smart Money Concepts(SMC), ICT 방식의 분석, 가격 행동 분석을 하나의 정돈된 차트에서 활용하세요. 시장 구조, 오더 블록, 유동성 참고 수준과 불균형을 파악하고, Smart Panel에서 표시할 요소를 선택할 수 있습니다. 현재 가격인 49 USD는 앞으로 30건의 구매에 적용됩니다. 이후 가격은 100 USD로 인상됩니다. 전체 패키지 구성 • MT5용 Smart Price Action Concepts. • Smart Universal Expert Advisor — 무료 보너스. • 전체 PDF 사용자 매뉴얼 및 공식 온라인 강좌. • 단계별 설치 및 설정 안내.
RelicusRoad Pro MT5
Relicus LLC
4.96 (24)
RelicusRoad Pro: 퀀트 시장 운영 체제 70% 할인 평생 이용권 (한정 시간) - 2,000명 이상의 트레이더와 함께하세요 왜 대부분의 트레이더는 "완벽한" 지표를 가지고도 실패할까요? 진공 상태에서 단일 개념 만으로 거래하기 때문입니다. 문맥 없는 신호는 도박입니다. 지속적인 승리를 위해서는 컨플루언스(중첩) 가 필요합니다. RelicusRoad Pro는 단순한 화살표 지표가 아닙니다. 완전한 퀀트 시장 생태계 입니다. 독점적인 변동성 모델링을 사용하여 가격이 이동하는 "공정 가치 로드"를 매핑하고, 단순 노이즈와 실제 구조적 돌파를 구분합니다. 추측은 그만두세요. 기관급 로드 로직으로 거래를 시작하세요. 핵심 엔진: "Road" 알고리즘 시스템의 중심에는 시장 상황에 실시간으로 적응하는 동적 변동성 채널인 Road Algo 가 있습니다. 세이프 라인(평형) 과 가격이 수학적으로 반전될 가능성이 높은 확장 레벨 을 투영합니다. Simple Road: 일반적인 시장을 위
ATstrong
Zaha Feiz
5 (1)
ATSTRONG PRO: 시장 구조 및 돌파(Breakout) 지표 돌파 감지 엔진 | 5개의 동적 TP 목표 | 실시간 대시보드 패널 | 리페인팅 없음 출시 기념 가격 현재 가격: $59 — 10개가 판매될 때마다 가격이 $10씩 인상됩니다. ATSTRONG PRO 는 MetaTrader 5 전용으로 설계된 고급 돌파 및 기관 수준의 시장 구조 지표입니다. 높은 확률의 스윙 피벗을 감지하고, 군집된 지지 및 저항 축적 영역을 식별하며, 실시간으로 구조 붕괴(BOS) 및 특성 변화(CHoCH) 신호를 제공합니다. 이 지표는 차트 위에 동적 손절매(Stop Loss)와 5개의 개별 이익 실현 수준(TP1 ~ TP5)을 자동으로 그려주며, 위험 대비 보상 투영 상자, 별점으로 매겨진 신호 품질 등급, 실시간 온차트 성과 분석 대시보드를 함께 제공합니다. 거래 주의 사항: 이 지표는 수동 거래 및 시장 분석용입니다. 캔들이 마감될 때 시각적으로 명확한 신호, 레벨, 알림을 리페인팅
Scalper Vault 는 성공적인 스캘핑에 필요한 모든 것을 제공하는 전문 스캘핑 시스템입니다. 이 표시기는 외환 및 바이너리 옵션 거래자가 사용할 수 있는 완전한 거래 시스템입니다. 권장 시간 프레임은 M5입니다. 시스템은 추세 방향으로 정확한 화살표 신호를 제공합니다. 또한 상단 및 하단 신호와 Gann 시장 수준을 제공합니다.  이 시스템은 사용하기가 매우 쉽습니다. 원하는 시장 지역의 화살표만 따라가면 됩니다. 엑시트는 가격이 적정 수준에 도달하거나 시장의 고점 또는 저점 신호가 나타날 때 수행됩니다.  표시기는 PUSH 알림을 포함한 모든 유형의 경고를 제공합니다. 인디케이터 구매 후 연락주세요. 내 개인 거래 권장 사항과 훌륭한 보너스 지표를 무료로 공유합니다! 나는 당신에게 행복하고 유익한 거래를 기원합니다!
SMC Market Structure MT5 PRO is a chart-based analysis indicator for MetaTrader 5 designed for traders who use Smart Money Concepts (SMC), Inner Circle Trader (ICT) concepts, market structure, liquidity analysis, and multi-timeframe price action. The indicator brings a comprehensive collection of SMC and ICT tools into a single chart, including Market Structure, Break of Structure (BOS), Change of Character (CHoCH), Order Blocks (OB), Fair Value Gaps (FVG), Inverse Fair Value Gaps (IFVG), Balanc
제작자의 제품 더 보기
SWING VOLUME PROFILE Swing-Based Volume Profile + Fibonacci + RSI -------------------------------------------------- Auto-detected swings. Volume profile. Fibonacci. RSI. All-in-one. -------------------------------------------------- WHAT THIS INDICATOR DOES Swing Volume Profile (SVP) automatically detects structural swings and displays a volume profile for the most recent completed swing — with Fibonacci retracement and RSI overlay. No manual range selection needed. The indicator finds
SWING DETECTOR WITH RSI AND FIBONACCI Structural Swing Points + Fibonacci Retracement + RSI Overlay -------------------------------------------------- FREE INDICATOR Identify swings. See Fibonacci levels. Check RSI. All in one free indicator. -------------------------------------------------- WHAT THIS INDICATOR DOES This indicator automatically detects structural swing highs and lows using configurable depth and deviation filtering. It connects swings with trend lines, overlays standard
FREE
SWING HIGHS LOWS DETECTOR Swing Detection with Divergence Analysis -------------------------------------------------- Identify swings. Spot divergences. Trade with confluence. -------------------------------------------------- WHAT THIS INDICATOR DOES This indicator automatically detects structural swing highs and lows using configurable depth and deviation filtering. It then analyzes RSI and MACD to detect regular and hidden divergences between consecutive swings of the same type. Diver
FREE
SWING DETECTOR WITH RSI AND FIBONACCI Structural Swing Points + Fibonacci Retracement + RSI Overlay -------------------------------------------------- FREE INDICATOR Identify swings. See Fibonacci levels. Check RSI. All in one free indicator. -------------------------------------------------- WHAT THIS INDICATOR DOES This indicator automatically detects structural swing highs and lows using configurable depth and deviation filtering. It connects swings with trend lines, overlays standard
FREE
SWING HIGHS LOWS DETECTOR Swing Detection with Divergence Analysis -------------------------------------------------- Identify swings. Spot divergences. Trade with confluence. -------------------------------------------------- WHAT THIS INDICATOR DOES This indicator automatically detects structural swing highs and lows using configurable depth and deviation filtering. It then analyzes RSI and MACD to detect regular and hidden divergences between consecutive swings of the same type. Diver
FREE
Fixed Range Volume Profile Auto-Detecting Volume Profile Indicator with Real-Time Trendline Tracking for MetaTrader 5 Product Overview Fixed Range Volume Profile is a free MetaTrader 5 indicator that displays volume distribution across a user-defined price range by automatically detecting the latest trendline drawn or dragged on the chart. It calculates and displays the Point of Control, Value Area boundaries, and High Volume Nodes for any selected range, updating live as the trendline is adjus
VWAP RIBBON INTELLIGENCE — MT4 EDITION Free MT4 VWAP Indicator | Rolling VWAP + Wilder ATR Volatility Ribbons + Breakout RSI Telemetry VWAP Ribbon Intelligence  combines Volume-Weighted Average Price (VWAP) , Wilder ATR volatility ribbons , and RSI telemetry in one chart-based framework. Use VWAP as a volume-weighted price reference, ATR ribbons to visualize changing volatility around that reference, and RSI labels to examine momentum at significant historical ribbon extensions. Designed for For
FREE
Fixed Range Volume Profile MT4 Volume Profile Indicator — Auto-Detecting Trendline Tracking, POC, Value Area & High Volume Nodes in Real Time Fixed Range Volume Profile (FRVP) displays volume distribution over a user-defined range — automatically detecting the latest trendline you draw or drag on the chart. No manual range selection. No naming conflicts. Just draw a trendline and the profile appears. Update it live by dragging. MT4 Native • No Repainting • Real-Time Trendline Tracking • Fully Cu
Adaptive Swing Density Heat Map MT4 Structural Density Indicator — Swing Clustering, Participation Tracking, Acceptance vs Rejection & Color-Coded Heat Map Adaptive Swing Density Heat Map analyzes swing point density across price levels, then tracks how price actually interacts with each zone — measuring participation, acceptance, and rejection. The result is a heat map of structural zones, color-coded by density strength. Not all support and resistance levels are equal — this indicator quantif
CONSOLIDATION INTELLIGENCE PRO MT4 Consolidation Indicator | Automatic Range Detection + 5-Tier Price-Density Heatmaps + Re-Entry Alerts Consolidation Intelligence Pro is a MetaTrader 4 indicator designed to identify areas where price repeatedly overlaps and trades within a concentrated range. The indicator analyzes candle overlap, body-to-wick structure, zone strength, and price-density distribution, then displays detected consolidation areas as 5-tier heatmaps directly on the chart. It also su
DONCHIAN MARKET & TREND INTELLIGENCE ENGINE (MT4) Multi-Factor Volatility, Trend Structure & Institutional Breakout Validation Dashboard MOST BREAKOUT INDICATORS ARE TRAPPING YOU. They Tell You THAT Price Broke Out. They Never Tell You IF It Will Hold. You have lived this scenario dozens of times: Price spends days coiling inside a tight Donchian band on your MT4 chart. A massive candle punches above the 20-period high. You buy the breakout — expecting momentum. Three candles later, price colla
BOLLINGER MARKET & TREND INTELLIGENCE MT4 Bollinger Breakout Analysis • Volatility Regimes • Trend Structure • Breakout Validation • Post-Breakout Analysis STOP GUESSING WHICH BREAKOUTS ARE REAL. You've been here before. Price closes outside the upper Bollinger Band. You see the breakout. You hesitate for a second — then enter. Three candles later, price is back inside the band. The breakout failed. Now you're wondering whether you entered too early, whether you should have waited for a retest,
VWAP Sniper Reversal
Charles Mwangi Ndungu
VWAP Sniper Reversal Pro v3.00 MT4 Mean-Reversion Indicator — Rolling VWAP, Dual-Layer ATR Bands, Volume Exhaustion, RSI Gate & Confirmation Modes VWAP Sniper Reversal Pro identifies potential mean-reversion setups at statistical price extremes. It combines a rolling volume-weighted average price (VWAP) baseline, dual-layer ATR deviation bands, volume and wick exhaustion filters, and an RSI gate to confirm reversal signals on completed bars. Built for traders who want multi-factor confluence ra
Adaptive Swing Density Heat Map MT5 Structural Density Indicator — Swing Clustering, Participation Tracking, Acceptance vs Rejection & Color-Coded Heat Map Adaptive Swing Density Heat Map analyzes swing point density across price levels, then tracks how price actually interacts with each zone — measuring participation, acceptance, and rejection. The result is a heat map of structural zones, color-coded by density strength. Not all support and resistance levels are equal — this indicator quantif
Last Swing Volume Profile
Charles Mwangi Ndungu
Swing Volume Profile MT5 Swing Volume Profile Indicator — Auto Swing Detection, Volume Profile, Fibonacci Retracement & RSI Overlay in One Chart Tool Swing Volume Profile (SVP) automatically detects structural swings and displays a volume profile for the most recent completed swing — with Fibonacci retracement and RSI overlay. No manual range selection. No trendline required. The indicator finds the swings and builds the profile automatically. MT5 Native • No Repainting • Auto Swing Detection •
Consolidation Intelligence Pro MT5 Consolidation Indicator — Automatic Range Detection, 5-Tier Price-Density Heatmaps & Re-Entry Alerts Consolidation Intelligence Pro automatically identifies where price repeatedly overlaps and trades within a concentrated range — then renders that structure as a 5-tier price-density heatmap directly on your chart. No more manually drawing every consolidation box. The indicator analyzes historical price structure, measures candle overlap and body-to-wick charac
DONCHIAN MARKET & TREND INTELLIGENCE The Only Donchian Tool That Tells You WHY the Market Is Moving — Not Just Where Most Donchian indicators draw three lines and call it a day. You get an upper band. A middle band. A lower band. And when price pokes above the upper band, you're supposed to just... buy? That's not analysis. That's guessing with extra steps. THE PROBLEM EVERY DONCHIAN TRADER KNOWS You've seen it a hundred times. Price finally breaks above the 20-period high after days of compress
BOLLINGER MARKET & TREND INTELLIGENCE — MT5 STOP GUESSING WHAT A BOLLINGER BREAKOUT IS TELLING YOU You've been here before. It's 2 AM. You're staring at a chart. Price has just closed outside the upper Bollinger Band. You enter. Three candles later, price is back inside the band. Then the move reverses. You tell yourself: "I should have waited for a retest." But when you wait for the retest, sometimes price continues without giving you the entry you wanted. So you add another filter. RSI. Then M
VWAP Sniper Reversal Pro
Charles Mwangi Ndungu
VWAP Sniper Reversal Pro MT5 Mean-Reversion Indicator — Rolling VWAP, Dual-Layer ATR Bands, Volume Exhaustion & RSI Gate VWAP Sniper Reversal Pro identifies potential mean-reversion setups at statistical price extremes. It combines a rolling volume-weighted average price (VWAP) baseline, dual-layer ATR deviation bands, volume and wick exhaustion filters, and an RSI gate to confirm reversal signals on completed bars. Built for traders who want multi-factor confluence rather than a single oscilla
필터:
리뷰 없음
리뷰 답변