Adaptive Swing Density Heat Map 2

Adaptive Swing Density Heat Map
MT4 Structural Density Indicator — Swing Clustering, Participation Tracking, Acceptance vs Rejection & Color-Coded Heat Map

Adaptive Swing Density Heat Map analyzes swing point density across price levels, then tracks how price actually interacts with each zone — measuring participation, acceptance, and rejection.

The result is a heat map of structural zones, color-coded by density strength. Not all support and resistance levels are equal — this indicator quantifies the difference.

MT4 Native • No Repainting • Adaptive to Volatility • Fully Customizable

The Idea in One Line

See where price clusters. See where price fights.

What the Indicator Does

Adaptive Swing Density Heat Map answers one core question:

Where have swings repeatedly clustered — and is price accepting or rejecting those levels right now?

The indicator detects swing points using a fractal algorithm, clusters them by ATR-based price proximity, and assigns each cluster a density score from 0 to 100%. It then tracks how price interacts with each zone over a configurable behavior window — separating genuine structural levels from weak ones.

Zones are color-coded by density strength:

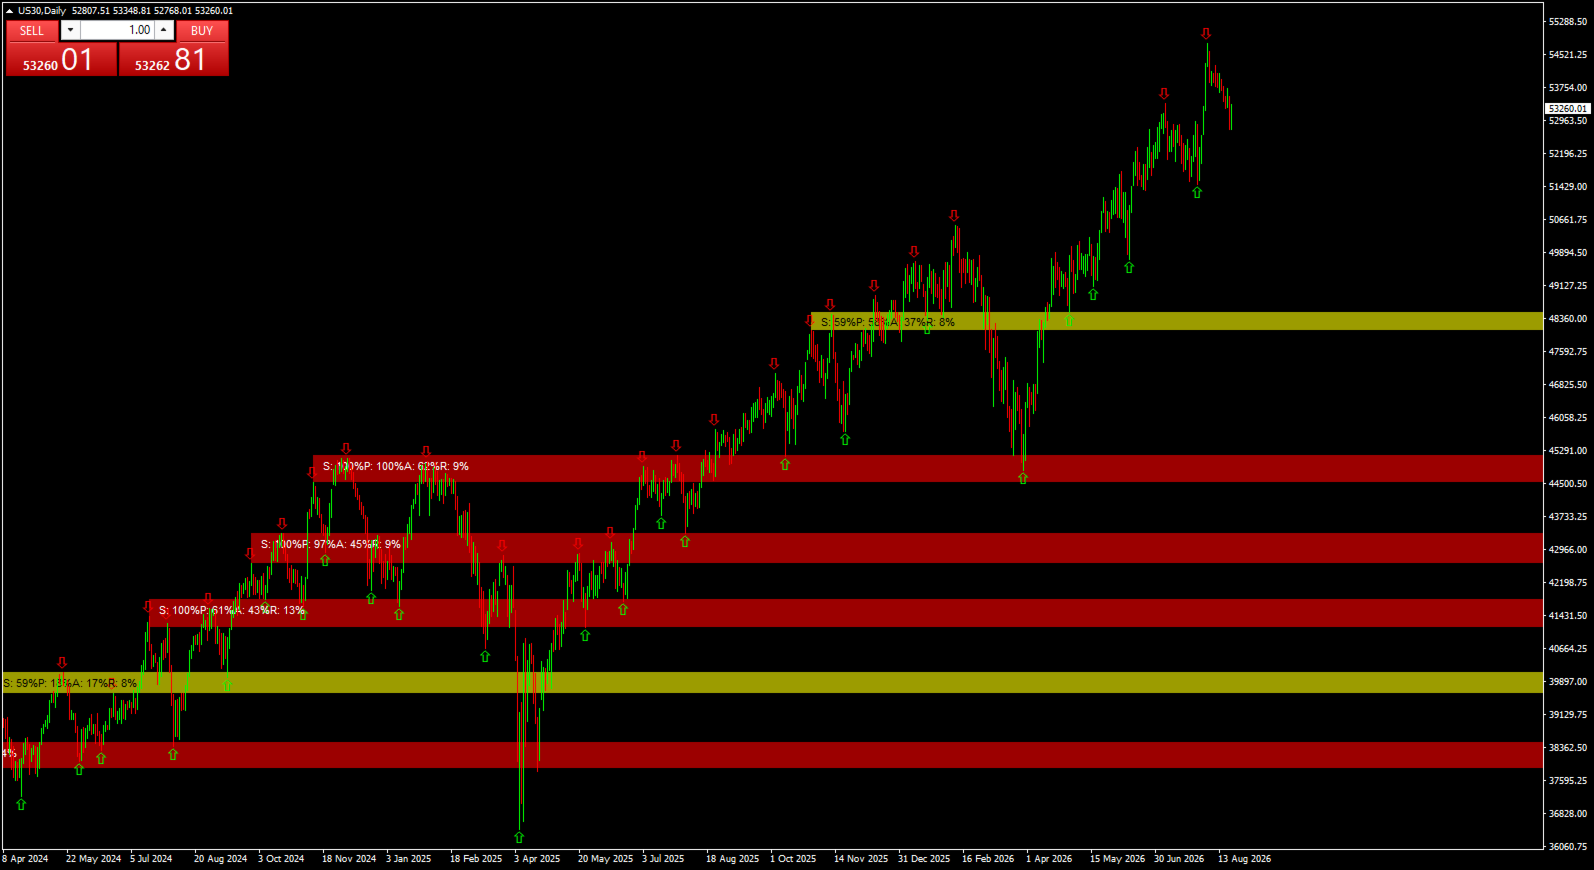
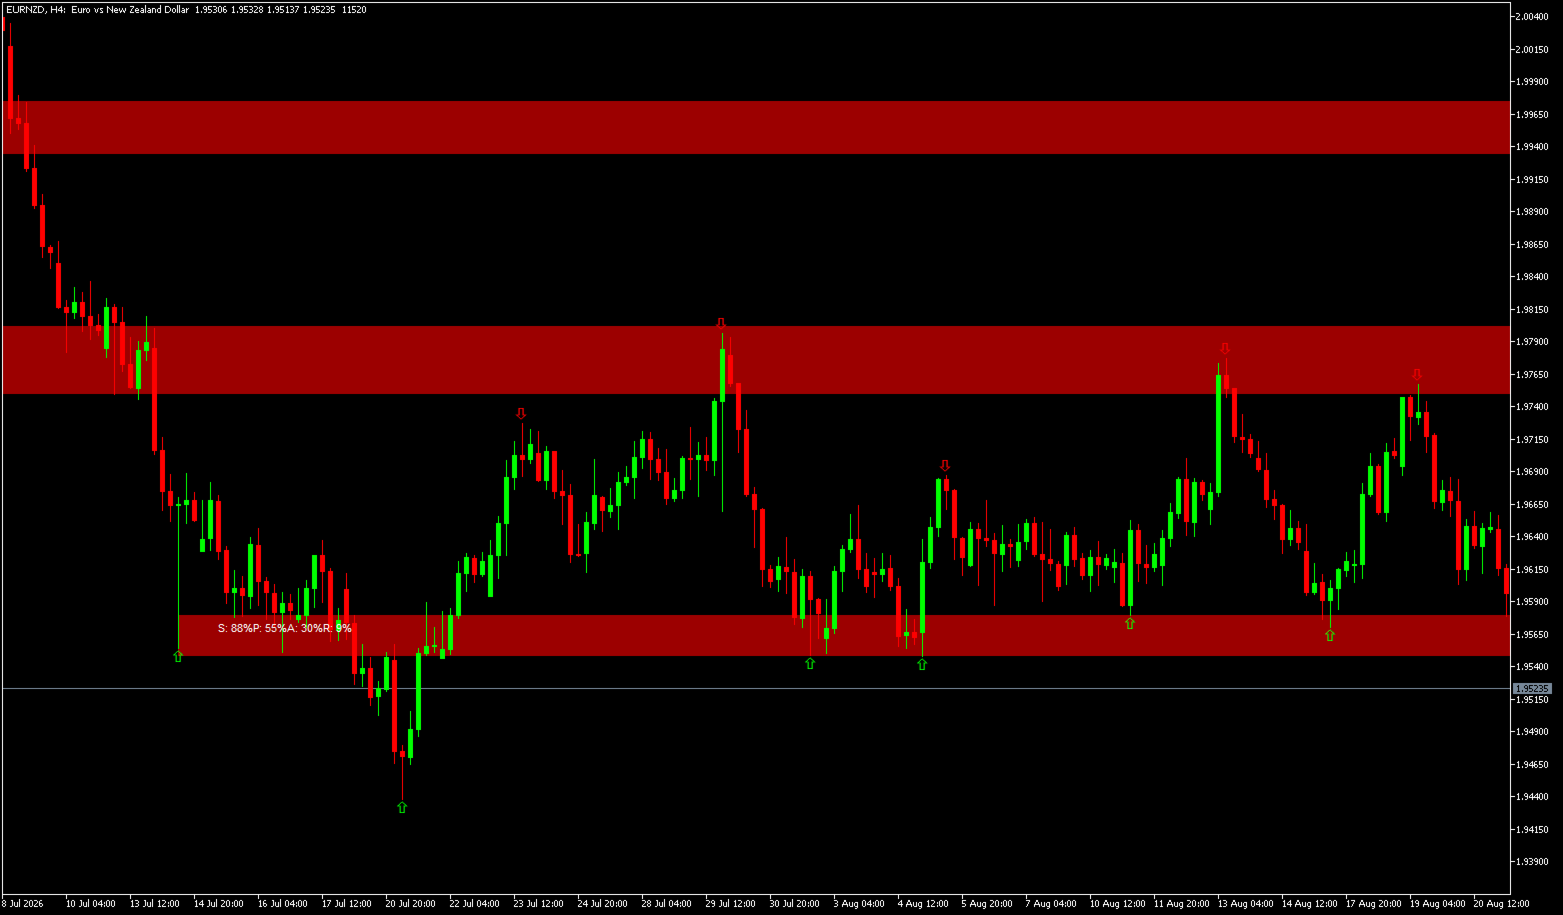
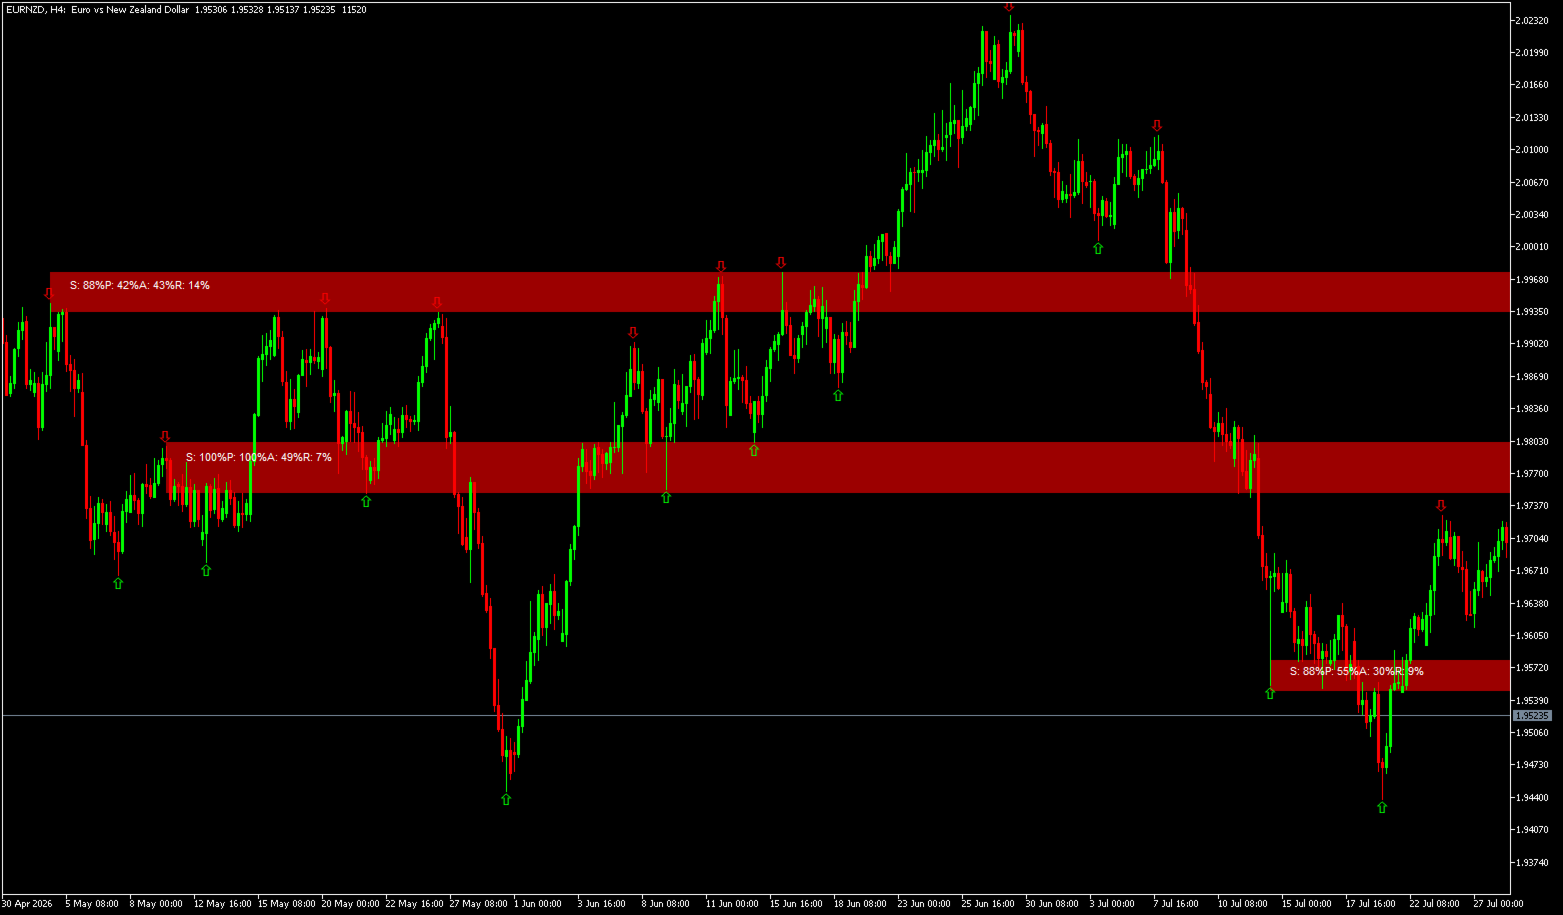
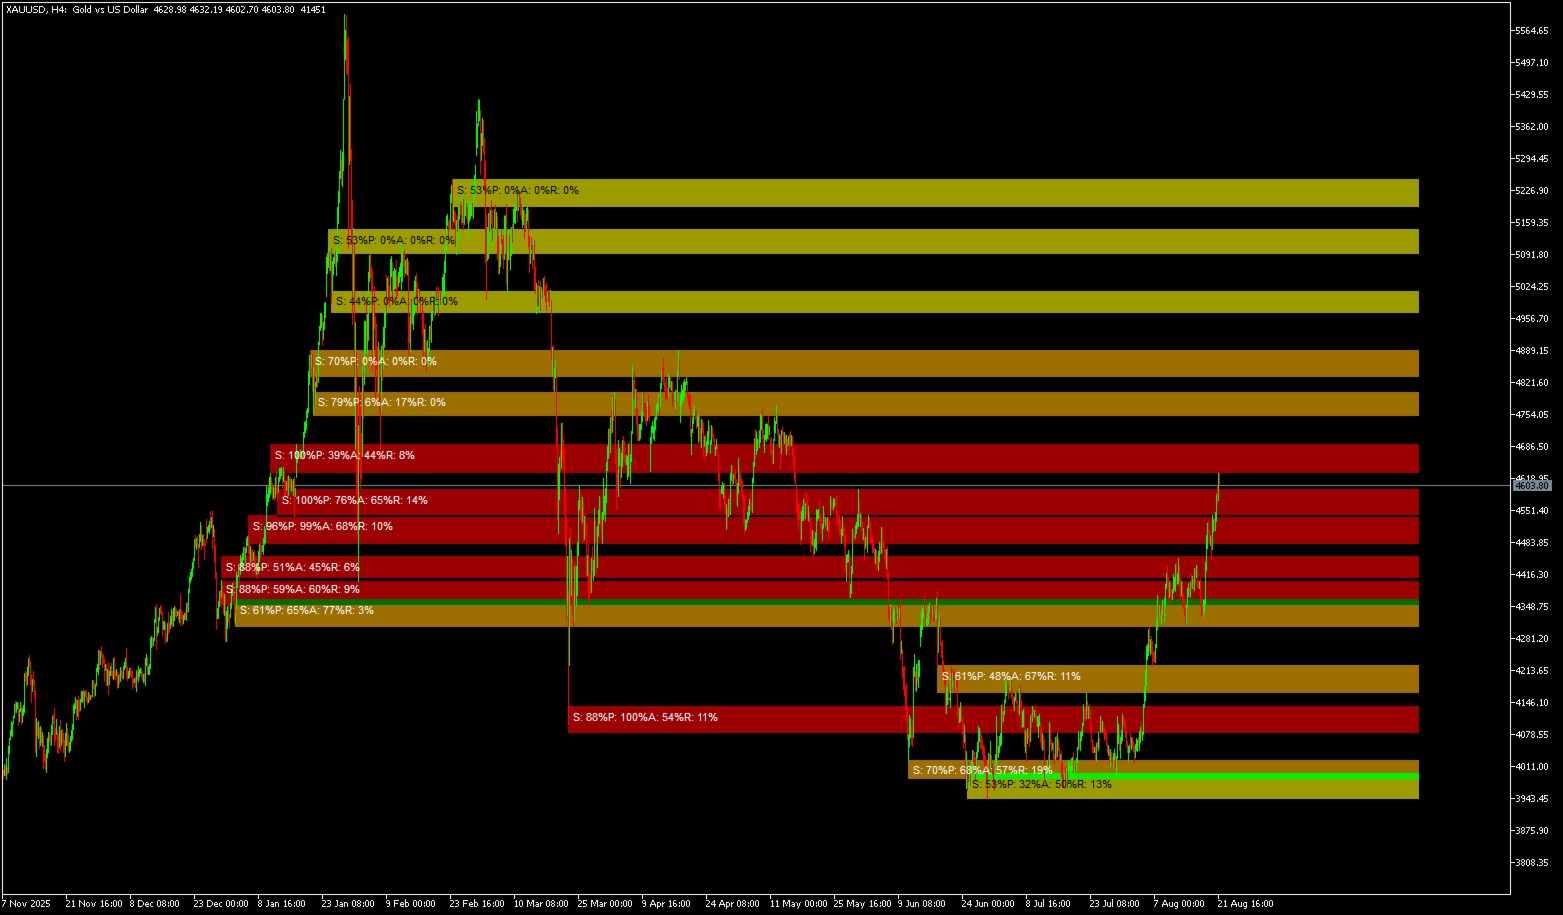
  • Red zones = Highest density (80–100%) — levels where price has repeatedly turned

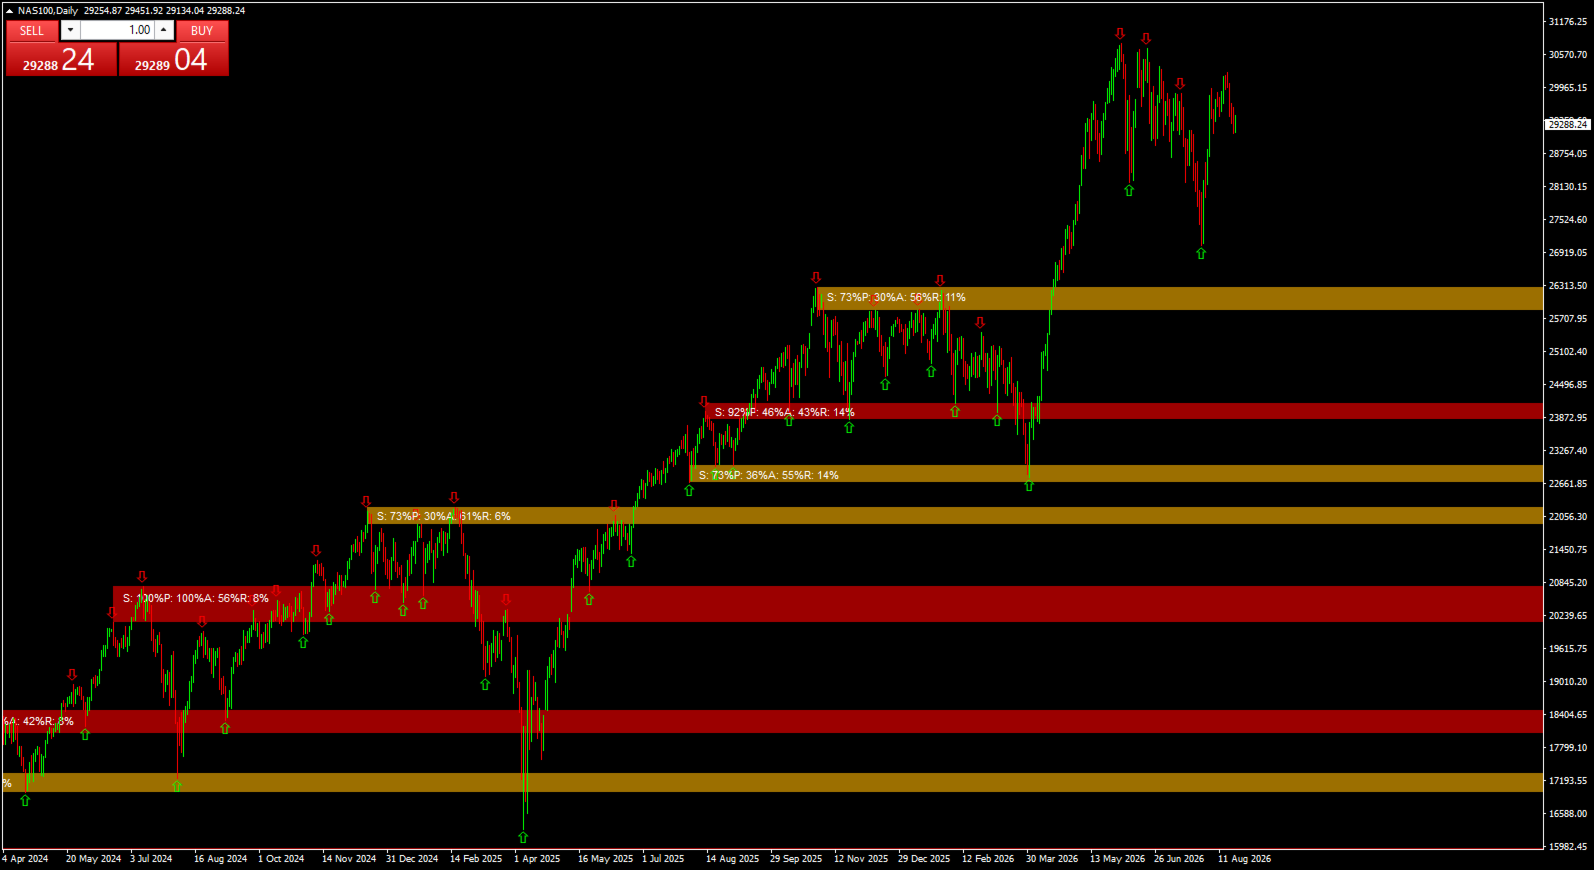
  • Orange zones = High density (60–80%) — significant structural levels with active interest

  • Yellow zones = Moderate density (40–60%) — areas of some interest but less conviction

  • Blue zones = Low density (below 40%) — weak structural levels, best ignored

A level where many swings have clustered indicates genuine market attention. A level with only one or two touches is statistically less significant. This indicator quantifies that difference.

Core Logic and Calculation

The indicator begins by detecting swing points using a fractal algorithm. Each swing point represents a structural high or low where price reversed direction — these points are the foundation of all subsequent analysis.

Swings are then clustered by price proximity using an ATR-based radius. This radius adapts to market volatility, ensuring clusters are meaningful in both quiet and volatile conditions. Clusters that are too wide are rejected, as they represent broad ranges rather than specific levels.

Density is normalized by comparing each cluster to the top clusters in the current analysis window. This creates a 0 to 100 percent scale that remains consistent across different market conditions. A zone with 80 percent density has significantly more swing clustering than the reference zone, indicating strong structural importance.

Participation analysis measures how often price candles touch each zone. This is distinct from density — a zone may have many swings (high density) but rarely be visited (low participation). Such zones are less actionable.

Acceptance and rejection analysis distinguishes support from resistance. When price closes inside a zone, it indicates acceptance and suggests the zone is acting as support. When price leaves long wicks without closing inside, it indicates rejection and suggests the zone is acting as resistance.

A smoothing mechanism stabilizes the density reference across bars, preventing zone colors from flickering due to normal variations in which zones qualify as the strongest. This makes the indicator visually reliable and easier to interpret.

Key Strengths

Swing Density Analysis
Clusters swing points by price proximity using an ATR-based radius that adapts to volatility. The more swings at a level, the higher the density score — directly indicating structural significance.

Participation Tracking
Measures how often candles touch each zone as a percentage. A zone with high density but low participation is less actionable than one with high participation.

Acceptance vs Rejection
Tracks closes inside the zone as acceptance and wick rejections as rejection. This distinguishes support levels from resistance levels based on actual price behavior.

Adaptive Smoothing
Density reference is smoothed across bars to prevent color flickering, making the visual output stable and reliable.

Color-Coded Heat Map
Uses a Red to Blue intensity scale for instant visual interpretation of zone strength.

Fully Customizable
Swing strength, lookback, clustering radius, zone filtering, and behavior lookback are all adjustable.

Anchor Zones to Formation
Zones remain fixed to their structural formation period, preserving the context of their origin.

No Repainting
All calculations are based on historical data and do not change on the current bar, ensuring consistency for backtesting.

What You See on the Chart

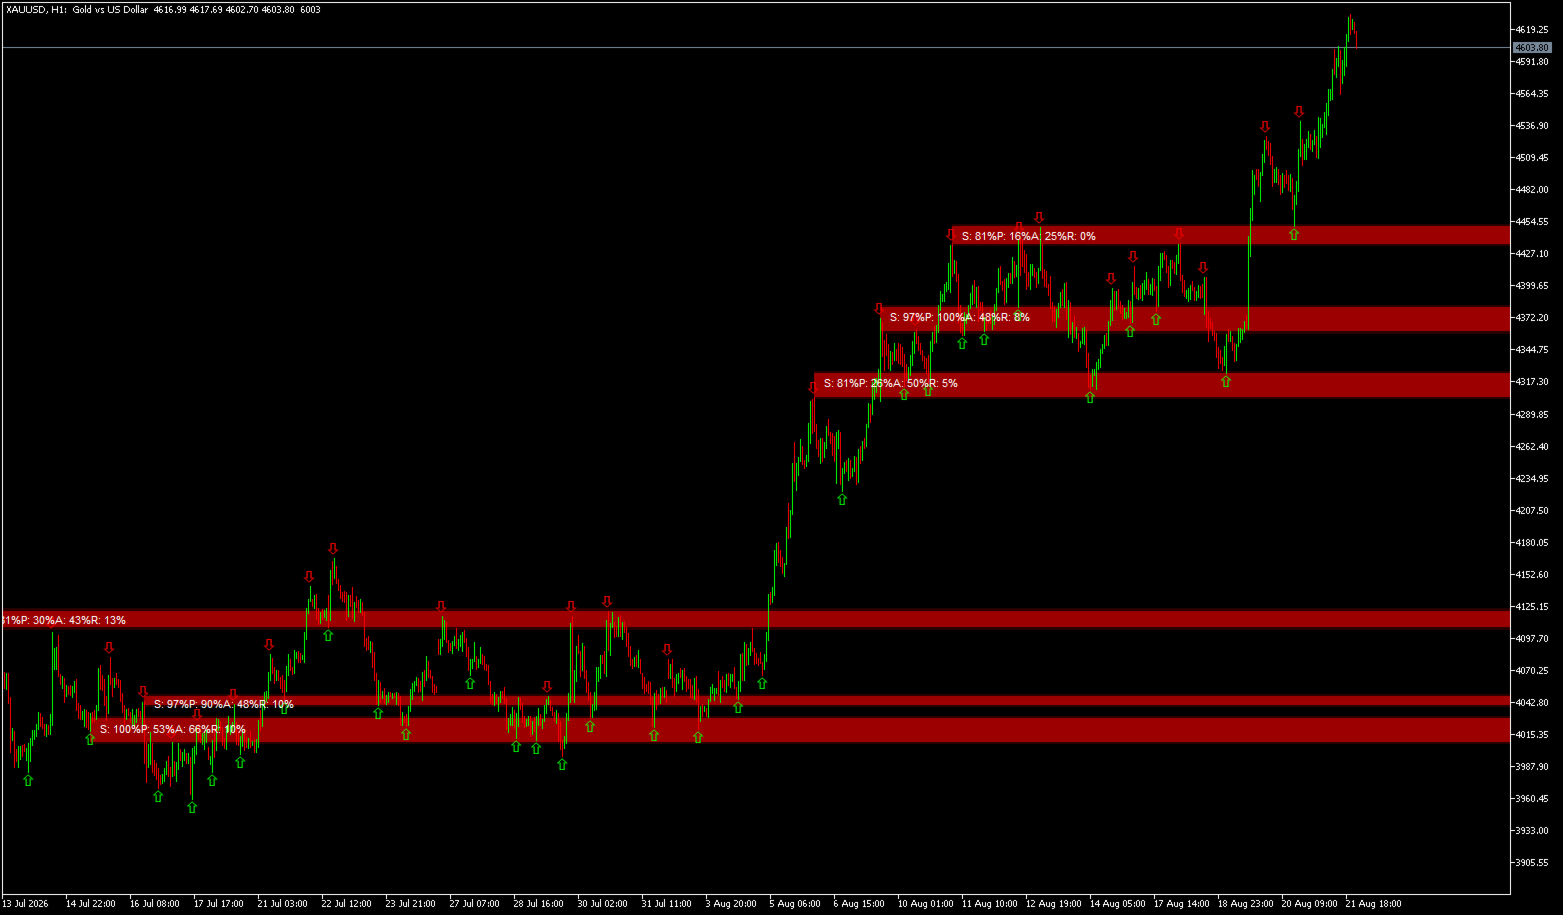
  • Red zones represent the highest density levels, indicating the strongest structural interest

  • Orange zones represent high density levels with significant swing clustering

  • Yellow zones represent moderate density levels with some market attention

  • Blue zones represent low density levels where structural interest is minimal

  • Semi-transparent halo extends above and below each zone for rejection detection

  • Data labels show Density %, Participation %, Acceptance %, and Rejection %

  • Swing high and low arrows can be toggled on or off

  • Zones auto-clean and redraw automatically on each new bar

How It Works

  1. Detects swing points using configurable strength and lookback limits.

  2. Clusters swings by price proximity using an ATR-based radius that adapts to volatility.

  3. Filters clusters by compactness — rejecting zones that are too wide.

  4. Assigns density scores normalized from 0 to 100 percent.

  5. Analyzes price behavior around each zone to measure participation, acceptance, and rejection.

  6. Draws a color-coded heat map with data labels and halo extensions.

Parameter Architecture

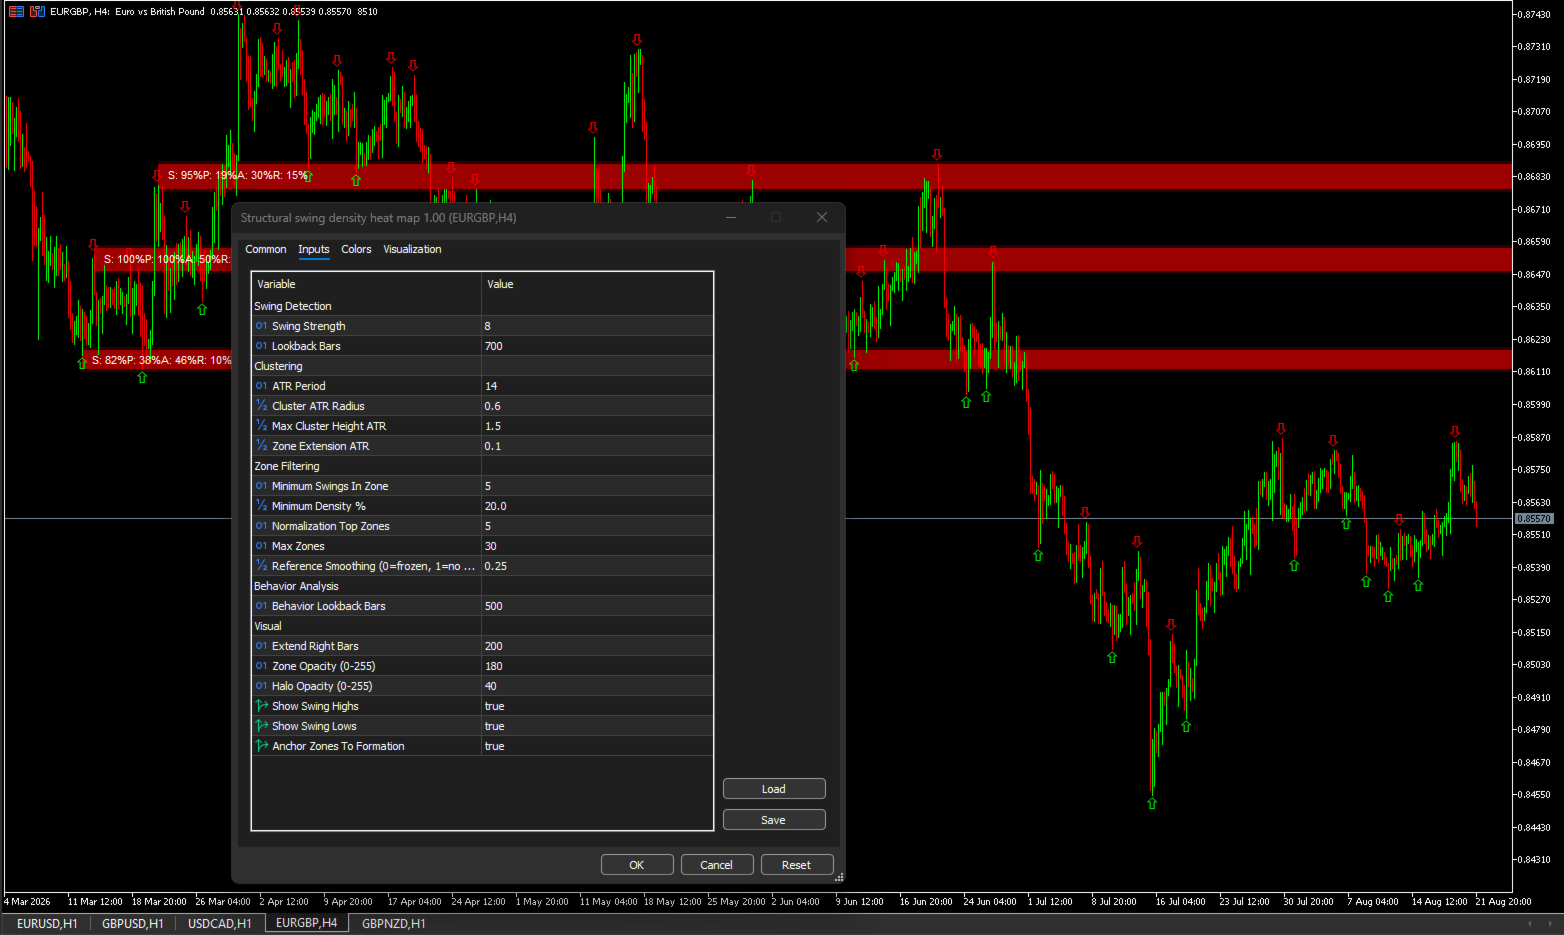
Swing Detection
Swing Strength — bars to check for local extrema (higher = fewer swings) · Lookback Bars — how far back to detect swings

Clustering
ATR Period — for adaptive radius calculation · Cluster ATR Radius — how close swings must be to cluster · Max Cluster Height ATR — rejects zones wider than this · Zone Extension ATR — halo size for rejection detection

Zone Filtering
Minimum Swings In Zone — minimum cluster size · Minimum Density Percent — only show zones above this · Normalization Top Zones — reference for density scaling · Max Zones — maximum zones displayed · Reference Smoothing — prevents color flickering (0 = frozen, 1 = no smoothing)

Behavior Analysis
Behavior Lookback Bars — period for participation analysis

Visual
Extend Right Bars — zone projection forward · Zone Opacity — transparency of core (0–255) · Halo Opacity — transparency of halo (0–255) · Show Swing Highs / Lows — toggle arrows · Anchor Zones To Formation — zones remain fixed to structure

Practical Usage Guide

The primary use of this indicator is to identify genuine structural levels for entries, exits, and stop placement. Red zones are your strongest levels — they represent price levels where swings have repeatedly clustered, indicating strong market attention. These zones are the most reliable for support and resistance decisions.

To interpret a zone, examine the four metrics displayed in the label:

  • Density tells you how strong the zone is relative to others.

  • Participation tells you whether price actually visits the zone.

  • Acceptance tells you if price closes inside — meaning the zone acts as support.

  • Rejection tells you if price leaves long wicks — meaning the zone acts as resistance.

A high density zone with high acceptance (above 50%) is a strong support level. Price tends to hold above this zone, making it suitable for buy entries and stop placement below.

A high density zone with high rejection (above 50%) is a strong resistance level. Price tends to reverse at this zone, making it suitable for sell entries and stop placement above.

A zone with high density but low participation (below 20%) may be less reliable. The market has shown interest through swing clustering but has not recently interacted with the level. Consider waiting for a touch and reaction before trading.

A zone with low density but high participation may be a temporary area of interest rather than a structural level.

For the most reliable trades, combine high density with high participation. These are zones where price has historically fought. When price returns to a high density zone, watch for acceptance or rejection to confirm the direction. Entry can be made on rejection candles or close confirmations.

Recommended Workflow

  1. Attach the indicator to your chart with default settings.

  2. Identify the highest density zones, shown in red and orange.

  3. Check participation, acceptance, and rejection metrics for each zone.

  4. Use acceptance zones as support and rejection zones as resistance.

  5. Confirm with price action, such as candlestick patterns, before entering trades.

Practical Use Cases

  • Identify high-density structural zones where the strongest levels are located

  • Distinguish acceptance zones that act as support from rejection zones that act as resistance

  • Avoid low-density, low-participation areas that are unlikely to hold

  • Find structural clusters for entry and exit placement with higher probability

  • Use as confluence with trend indicators or order flow analysis

Technical Notes

  • Overlay indicator that draws directly on the price chart

  • Works on any timeframe and symbol

  • Adaptive to volatility via ATR-based radius calculations

  • No repainting — all calculations are historical and do not change on the current bar

  • Optimized for performance with once-per-bar recalculation and configurable lookback limits

  • Compatible with MetaTrader 4

Support

Lifetime updates included. For assistance, click Developer's Profile below.

Adaptive Swing Density Heat Map — MT4 Structural Density Indicator | Swing Density Heat Map | Swing Clustering Indicator | Participation Tracking | Acceptance Rejection Analysis | Support Resistance Heat Map | ATR Adaptive Zones | Structural Levels MT4 | High Density Zones | No Repaint Heat Map | Market Structure Indicator | Swing Point Analysis | Price Cluster Indicator | MT4 Heat Map Indicator | Order Flow Alternative | Institutional Levels Indicator

추천 제품
Linear Trend Predictor - 진입 지점과 방향성 지원선을 결합한 추세 지표입니다. 고가/저가 채널을 돌파하는 원칙에 따라 작동합니다. 지표 알고리즘은 시장 노이즈를 걸러내고 변동성과 시장 역학을 고려합니다. 표시기 기능  평활화 방법을 사용하여 시장 추세와 BUY 또는 SELL 주문을 시작하기 위한 진입 시점을 보여줍니다.  모든 기간의 차트를 분석하여 단기 및 장기 시장 움직임을 파악하는 데 적합합니다.  어떠한 시장과 시간대에도 적용할 수 있으며, 입력 매개변수를 통해 거래자는 자신에게 맞게 지표를 독립적으로 사용자 지정할 수 있습니다.  설정된 지표 신호는 사라지거나 다시 그려지지 않습니다. 이는 캔들 마감 시 결정됩니다.  여러 유형의 알림이 화살표와 결합되어 있습니다.  이 지표는 독립적인 거래 시스템으로 사용할 수도 있고, 다른 거래 시스템에 추가하는 용도로도 사용할 수 있습니다.  모든 수준의 경험을 가진 거래자가 사용할 수 있습니다. 주요 매
이 지표는 실제 거래에 완벽한 자동 파동 분석 지표입니다! 사례... 참고:   웨이브 그레이딩에 서양식 이름을 사용하는 데 익숙하지 않습니다. Tang Lun(Tang Zhong Shuo Zen)의 명명 규칙의 영향으로 기본 웨이브를   펜   으로 명명하고 2차 웨이브 밴드를   세그먼트   로 명명했습니다. 동시에, 세그먼트에는 추세 방향이 있습니다.   주요 추세 세그먼트에는   이름이 지정되지만(이 이름 지정 방법은 향후 노트에서 사용됩니다. 먼저 말씀드리겠습니다.) 알고리즘은 굴곡 이론과 거의 관련이 없으므로 그렇게 해서는 안 됩니다. 이는 나의 시장 분석을   통해 요약된 끊임없이 변화하고 복잡한 운영 규칙을   반영합니다. 밴드는 더 이상 사람마다 다르지 않도록 표준화되고 정의되었습니다. 인위적인 간섭의 드로잉 방법은 시장 진입을 엄격하게 분석하는 데 핵심적인 역할을 합니다. 이 지표를 사용하는 것은 거래 인터페이스의 미학을 개선하고 원래의 K-line 거래를
Oscillator helps determine the direction of the market Shows the direction of the price movement and is painted in the appropriate color. Allows you to conduct trend and counter trend trading It works on all timeframes, on any currency pairs, metals and cryptocurrency Can be used when working with binary options Distinctive features Does not redraw; Simple and clear settings; It works on all timeframes and on all symbols; Suitable for trading currencies, metals, options and cryptocurrency (Bitco
OVERVIEW The Vector Candle Zones Render indicator automatically renders boxes for vector candle zones that are yet to be recovered. The indicator is an implementation of an existing PVA candles indicator. Combine it with PVSRA and MarketMakerMethod strategy. FEATURES Software: MetaTrader4 - MT4 - 600+ build Timeframes: Multi-Timeframe Markets: Forex/Cryptos/Energies/Bonds/Metals/Indices/Futures/Commodities Customizable style parameters: Change Color style Change Percentage style C
BID Wave Volume 2
Mostefa Mammeri
Product Title: BID Wave Volume 1 - Smart Institutional Liquidity Tracker Short Description: Uncover institutional footprints! A powerful dual-timeframe volume indicator that detects real market turns by checking M1 volume order flow at current timeframe reversal zones. Full Description:  BID Wave Volume 2 is a revolutionary, advanced volume indicator designed for pro-scalpers and day traders. It bridges the gap between raw price action and institutional order flow. Unlike traditional indicators,
Introducing the Donchian Channels indicator for MQL4, a powerful technical analysis tool designed to boost your trading success. This indicator consists of four lines that represent the upper and lower boundaries of price movement over a specified period. With the Donchian Channels indicator, you can easily identify potential breakouts and reversals in the market. The upper line shows the highest high of the specified period, while the lower line represents the lowest low. The space between thes
Engulfing Candle Alert MT4
Prafull Manohar Nikam
This is a simple arrow system based on Engulfing Candlestick Pattern. It gives you alerts on your smartphone when there is an engulfing candlestick pattern happens. Which type of alerts available? 1. It paints on chart Up/Down Arrows. 2. Popup message and sound alert in trading terminal window. 3. Push notification or Alert on your Android and IOS mobile phones (requires MT4 or MT5 app installed!) *Note: Use it on higher timeframes like H4 (4 hours), D1 (1 Day) then find trade opportunities on s
DayLevelsSignalPro
Vladimir Chebonenko
The MT4 " DayLevelsSignalPro " indicator . Signal Indicator – generates the most accurate buy / sell signals . Noise filtering indicator  – reduces false signals . Signal information with a clear , understandable and visually convenient view . User- friendly graphical interface ( colors , sound notifications , customization options ) . - Generation of a breakdown signal for significant peaks of the Current day . - Generation of a signal for the breakdown of the previous Day 's Level - Generation
Cloud Power
Andriy Sydoruk
Implementation of indication of trend movement with moments for potential stops in the Cloud Power indicator. The transition to the shadow warns of a possible reversal. The entry of the price inside the shadow speaks of a flat movement. The indicator tracks the market trend with unmatched reliability, ignoring sharp market fluctuations and noise around the average price. Simple, visual and efficient use. The indicator does not redraw and does not lag. It can be easily used as an independent t
MoveWave
Andriy Sydoruk
MoveWave - Moving waves are very handy indicators for determining pivot levels. Most Forex traders make decisions based on technical analysis. This type of analysis determines patterns and trends in the market. With the help of complex mathematical equations that are combined and made out in the form of this indicator, the trader will be able to more accurately determine the price reversal levels. Wave theory mathematically represents various behavioral models of the market. It is used as the ba
15 years old, 15 years old, 15 years old. 2024 years ago: ️ What to do next. I want to know what I want to know. Sorry, I don't know what to do. I want to know, I want to know, I want to know. I want to know what I want to know. I want to know what I want to know. H4(단지 M1에서 M30) I'm here. I'm here. I want to know what I want to know. I want to know what I'm saying. I want to know what I want to know. I want to know what I want to know. I want to know what I want to know. I want to
Rira VWAP Bands
Vitor Palmeira Abbehusen
VWAP Bands gives you the regular Volume-Weighted Average Price and also the deviation bands. Use this indicator to see the possible amount of market movement, find support and resistance lines, find good spots for entry and exit,  and the most important feature is to find possible pivot points. This indicator has been mathematically improved by Rira team. The calculation begins at the start of each trading day
Auto Elliott Engine
Enrique Gauto Sand
Auto Elliott Engine The Auto Elliott Engine is a tool designed for MetaTrader 4 that automates the identification, decomposition, and projection of price structures based on the Elliott Wave Theory. Powered by a pattern-recognition engine, this indicator processes price action to identify market configurations, translating data into structured scenarios. Key Features Multi-Degree Recognition: Analyzes price action across multiple fractal levels. From higher degrees, such as Supercycle or Cycle,
The indicator sends messages to e-mail and mobile terminal when the price approaches the horizontal levels and trend lines that are drawn using the handy panel! The levels and trend lines are deleted and placed to the chart using one click on the panel, and they can be dragged on the chart by mouse! It is possible to set the interval between messages in the settings, the interval is applied to each object separately! Indicator Settings ===*** Main settings ***=== - below is the list of the main
Gann Box MT4
Frederic Jacques Collomb
5 (1)
Gann Box 지표는 트레이더가 시장의 핵심 수준을 식별하고 활용할 수 있도록 설계된 강력하고 다재다능한 도구입니다. 이 지표는 차트에 직사각형을 그릴 수 있게 해주며, 자동으로 전략적 수준인 0, 0.25, 0.50, 0.75, 1 로 여러 영역으로 나뉩니다. 가격이 이 중 하나의 수준에 도달하면 경고가 활성화되어 거래 결정을 내리는 데 귀중한 도움을 제공합니다. 그리신 영역에 대한 시장의 변화를 즉시 알 수 있습니다. 영역을 그리려면 간단한 직사각형을 그리고 이름을 GannBox 로 바꾸기만 하면 됩니다. 이 지표는 지지 및 저항 , 공급 및 수요 개념을 사용하는 트레이더, ICT 기술을 사용하는 트레이더, 또는 공정 가치 갭 (FVG) 전문가 등 모든 유형의 트레이더를 위해 설계되었습니다. 일일 거래자, 스윙 거래자 또는 포지션 거래자이든, Gann Box 는 시장의 움직임을 더 잘 이해하고 예측하는 데 도움을 주어 반응성과 성과를 향상시킵니다. MT5 버전 Gann Box
Eurusdkiller
Nehemiah Rono
EUTUSDKILLER is a trend EA that works in all market conditions (i)It buys when the indicator confirms a trend  (ii)Sell when the same indicator confirms a down trend. (iii)Easy visual and effective trend detection. (iV)It filters and improve your trading strategies. (v) It scans previous data and give real time output. (vi) It can be set to auto calculate lots size.
Trend and Lines
Oliver Hinrichs
This indicator draws lines at the open, close, high and low price of the last chart candle from the set timeframe. In addition, a label shows whether it was an up or down candle. The standard settings follow the original idea of ​​getting the price data from the daily timeframe for day trading/scalping, but since this indicator is fully customizable, you can also set a different timeframe. Based on the drawn price lines, you can then also display Fibonacci levels. This function can also be
My Point MT4
Claudia Ramona Angerer
4 (1)
Diagnosis of major and minor pivot Trend detection with many signals Can be used in all symbols Can be used in all time frames Settings: Back Show: The number of candles it displays If you need any adjustments, or have any questions or suggestions, message me How to trade: Blue: sell signal Red: buy signal Blue and red at the same time: no signal Exit signal: Opposite signal
Trend Line Finder
Stephen Reynolds
5 (1)
Trend Line Finder will project forward a support and resistance lines using 2 previous highs for resistance and 2 previous lows for support.  It will then signal to the trader by alert making the trader more aware that a possible good move is about to happen.     This is not a stand-alone trading system but is very useful in finding key areas of support resistance levels where price will usually either rebound from or breakthrough. Its down to the trader to decide what to do with use of other s
Implement
Vitalii Zakharuk
5 (1)
Implement analyzes market dynamics for pivot points. If you want to learn how to spot the correct reversals for consistently likely profitable trading, buy this indicator. Shows favorable moments of entering the market in stripes. Ready-made trading system. The principle of operation of the indicator is to automatically determine the current state of the market when placed on a chart, analyze historical data based on historical data and display instructions for further actions on the trader's
Pullback Probability   It is an indicator that shows us the probability that the price will t urn around   and we can operate that market turn. The indicator marks a line that oscillates between a percentage of 0% to 100%. The one indicated in the upper left corner shows us a help in which it informs us of the area in which the price is in real time, as well as the percentage that the candle is open. You can download the demo and test it yourself. The indicator marks 6 work zones. 1)   Above
This unique auto trend line drawing indicator works on all time frames which can help you to easily trade short term trend reversals as well as  as well as short term trend breakouts indicating the stronger asset in the market. It uniquely allows you to get in EARLY for heavy swings. Inputs include:  - Max Candles Look Back for Trend Lines - Line Type and Color - Max Distance to Outer Band and Band Period - Options to Auto Re-Draw Trend Line off of the Pivot When a Confirmation Candle or Price
Description: Range Pulse Pro — Advanced Range Trading EA with Bollinger Bands + RSI (Swap-Free) PRODUCT OVERVIEW Range Pulse Pro is a premium automated trading solution designed for the MetaTrader 4 platform. It specializes in range-bound markets where price oscillates between support and resistance levels. The EA uses a dual-confirmation system: • Bollinger Bands to identify overbought and oversold zones • RSI 14 to confirm market extremes This combination allows the EA to buy near
Engulfing Candle Scanner
Ibrahim Olalekan Ganiu
This is an indicator that helps you to scan the whole timeframe then informs you about the last candle position Engulfing Candlestick pattern was formed. The indicator also send alert to your mobile when a new engulfing candle is formed.  For the visual; 1. Green up arrow indicates a bullish engulfing candlestick pattern  2. Red down arrow indicates a bearish engulfing candlestick pattern
FREE
PTW NON REPAINT TRADING SYSTEM + HISTOGRAM Non-Repainting ,   Non-Redrawing   and   Non-Lagging  Trading System. Does the following: - Gives Accurate Entry and Exit Points - Scalping, Day and Swing Trading  - 95% Accuracy  - Targets, where to take profits. - Shows Trends, Support and resistance levels - Works on All Brokers - Works on All Currencies, CFDs and Stocks - It does not place trades for you, it only shows you what trades to place. - It works on All Timeframes - It is for Trend or ran
The indicator is the main part of Michael Huddleston's ICT (Inner Circle Trader) trading strategy. His legendary trading strategy is based on the concept of "Smart Money". To analyze the medium -term trend , the  ICT offers an analysis based on  twenty -day levels . The indicator builds levels , while showing the turning points with arrows . An important feature of the indicator is the automatic display of levels for different periods . You do not have to change the indicator settings when chang
Trend Sim
Ivan Simonika
This is a professional Trend Sim indicator. The intelligent algorithm of the Trend Sim indicator accurately detects the trend, filters out market noise and generates input signals and exit levels. Functions with advanced statistical calculation rules improve the overall performance of this indicator. The indicator displays signals in a simple and accessible form in the form of arrows (when to buy and when to sell). Knowing the entry point of each of the currencies is very important for every f
Semi-Automatic Trading EA Description This EA is designed for semi-automatic trading, requiring the user to have a good understanding of the following functions: Automatic Trading with 3 MAs : The EA analyzes and trades based on signals generated by three Moving Averages (MA). Users must configure the MA settings according to their strategy. Drawing Trendlines : Users can draw trendlines on the trading platform to identify market trends. The EA will place trades when the price breaks through the
Five Candles Pattern
Miguel Antonio Rojas Martinez
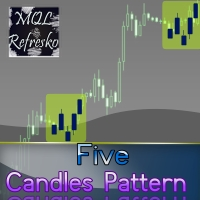
The "Five Candle Pattern" indicator is a novel way to see the market, because with it we can compare and/or seek training or the pattern of the past 4 or 5 Candles, and identify them in the same graph, to view your behavior at an earlier time. The indicator creates a pattern of those 4 or 5 candles and searches backward, identifies, and marks the same formation or pattern. With that information you adjust the strategy that is operating, or create a new one, because you can compare the past devel
Multiphase
Ivan Simonika
Multiphase is a non-redrawing channel indicator based on moving averages. The key difference between the Multiphase indicator and other channel indicators (for example, from the same Bollinger Band) is that Multiphase takes into account not simple moving averages, but double-smoothed ones, which, on the one hand, makes it possible to more clearly determine the market movement, but, with on the other hand, it makes the indicator less sensitive.
이 제품의 구매자들이 또한 구매함
Trend SniperX MT4
Sarvarbek Abduvoxobov
5 (4)
Trend Sniper X 는 트레이더가 명확하고 정확하게 트렌드 방향과 잠재적 반전 지점을 포착할 수 있도록 돕는 MetaTrader 5 전용 멀티 타임프레임 추세 추종 지표입니다. MT5 버전 링크: https://www.mql5.com/en/market/product/181101 가격 안내: 현재 가격은 프로모션 할인가이며, 향후 업데이트 및 새 기능 출시 시 인상될 수 있습니다. Code2Profit 채널 멀티 타임프레임 분석으로 시장을 정복하세요! Trend Sniper X로 승률을 극대화하는 방법: 핵심 규칙 및 세션 팁 기술 사양 플랫폼 MetaTrader 5 지표 유형 멀티 타임프레임 추세 지표 작동 타임프레임 모든 차트 타임프레임 (상위 타임프레임 M1–MN1 독립 선택 가능) 주요 종목 외환(Forex), 골드(XAUUSD) 및 기타 CFD 추천 계좌 모든 계좌 유형 시각화 컬러 추세 캔들 (매수/매도/약세/변화) + 매수/매도 화살표 추가 모듈 세션 마켓 박스 (
SR Liquidity
Oleg Rodin
5 (2)
SR Liquidity 는 시장 유동성이 집중되고 가격이 가장 강력하게 반응하는 숨겨진 구간을 포착하도록 설계된 트레이딩 지표입니다. 이러한 특수 유동성 구간은 강력한 지지 및 저항선 역할을 하며, 시장 반전 가능성이 가장 높은 지점을 명확하게 보여주는 지도가 되어 줍니다. SR Liquidity는 일반적인 지지 및 저항선을 단순히 그리는 대신, 실제 가격 움직임을 분석하여 매수 및 매도 압력이 집중되는 구간을 포착합니다. 이러한 구간은 실질적인 시장의 흐름을 주도하는 유동성 풀(liquidity pools)에 해당합니다. 이 지표는 해당 구간을 차트에 직접 시각화하여, 가격 반응이 실제로 나타나기 전에 이를 미리 예측할 수 있도록 돕습니다. 즉, 가격 추세가 전환될 가능성을 사전에 파악하게 해주는 것입니다. 결과적으로 이 지표는 가공되지 않은 가격 움직임(price action)을 시장의 핵심 가격대, 다시 말해 추세 전환점이 될 수 있는 지점들을 보여주는 명확하고 실용적인 로드맵
PRO Renko System
Oleg Rodin
5 (31)
PRO Renko System 은 RENKO 차트 거래를 위해 특별히 고안된 매우 정확한 거래 시스템입니다. 이것은 다양한 거래 상품에 적용될 수있는 보편적 인 시스템입니다. 체계는 효과적으로 당신에게 정확한 반전 신호에 접근을 주는 소위 시장 소음을 중화합니다. 이 표시기는 사용하기가 매우 쉽고 신호 생성을 담당하는 매개 변수가 하나만 있습니다. 당신은 쉽게 당신의 선택의 어떤 무역 계기에 공구를 적응시킬 수 있고 renko 막대기의 크기. 나는 항상 당신이 내 소프트웨어로 수익성있게 거래 할 수 있도록 추가 지원을 제공 할 준비가되어 있습니다! 나는 당신에게 행복하고 수익성있는 거래를 기원합니다! 구매 후 저에게 연락하십시오! 내 렌코 차트 생성기를 보내드립니다. 또한 내 개인 권장 사항 및 시스템의 다른 모듈을 무료로 공유 할 것입니다!
Gann Made Easy
Oleg Rodin
4.84 (172)
Gann Made Easy 는 mr.의 이론을 사용하여 최고의 거래 원칙을 기반으로 하는 전문적이고 사용하기 쉬운 Forex 거래 시스템입니다. W.D. 간. 이 표시기는 Stop Loss 및 Take Profit Levels를 포함하여 정확한 BUY 및 SELL 신호를 제공합니다. PUSH 알림을 사용하여 이동 중에도 거래할 수 있습니다. 구매 후 거래 방법 안내 및 유용한 추가 지표를 무료로 받으시려면 저에게 연락주세요! 아마도 Gann 거래 방법에 대해 이미 여러 번 들었을 것입니다. 일반적으로 Gann의 이론은 초보자 거래자뿐만 아니라 이미 거래 경험이 있는 사람들에게도 매우 복잡한 것입니다. Gann의 거래 방식은 이론적으로 적용하기 쉽지 않기 때문입니다. 나는 그 지식을 연마하고 Forex 지표에 최고의 원칙을 적용하기 위해 몇 년을 보냈습니다. 표시기는 적용하기가 매우 쉽습니다. 차트에 첨부하고 간단한 거래 권장 사항을 따르기만 하면 됩니다. 지표는 지속적으로 시장 분석
Miraculous Indicator Binary & Forex v3 StrategySafe Miraculous Indicator Binary & Forex v3 StrategySafe 는 명확한 신호, 강력한 확인 도구, 그리고 Binary 및 Forex 시장에서 사용할 수 있는 체계적인 거래 방식을 원하는 트레이더를 위한 전문 지표입니다. v3 버전에는 MIR Dashboard, Miraculous Confirmation Dashboard, GANN Law, Square of 9 레벨, GANN 각도, 그리고 더욱 강화된 Forex 모드가 포함되어 있습니다. 주요 기능 Binary 모드와 Forex 모드를 하나의 지표에서 지원. MIR Dashboard로 빠른 시장 흐름 확인. Miraculous Confirmation Dashboard로 진입 신호 확인. Forex 분석을 위한 GANN Law drawing lines. Square of 9 라인, 레벨, 방향 표시. 1x1 G

PTS Precision Index Oscillator V2
PrecisionTradingSystems
5 (1)
프리시전 트레이딩 시스템의 로저 메드칼프에 의한 프리시전 인덱스 오실레이터 (Pi-Osc) 버전 2는 차트에 신속하게 로드되도록 주의 깊게 다시 코딩되었으며 경험을 향상시키기 위해 몇 가지 다른 기술적 개선 사항이 통합되었습니다. Pi-Osc는 정확한 거래 타이밍 신호를 제공하도록 개발되었으며 시장이 모든 사람의 스톱을 청산하기 위해 가야 하는 극도의 고갈 지점을 찾는 데 목적이 있습니다. 이 제품은 극단적인 지점이 어디에 있는지 알고 있는 고전적인 문제를 해결하며 트레이더로서의 삶을 훨씬 간단하게 만듭니다. 이것은 업계 표준 오실레이터와는 상당히 다른 강력한 차이점을 가지고 있는 고도로 복잡한 합의 지표입니다. 사용하는 기능 중 일부는 수요 지수, 자금 흐름, RSI, 스토캐스틱, 패턴 인식, 거래량 분석, 표준 편차 극단점 및 다양한 길이에서 위와 유사한 변형을 갖습니다. 미숙한 눈에는 다른 오실레이터와 비슷해 보일 수 있지만 RSI 또는 모멘텀과 같은 다른 오실레이
Smart Trend Trading System
Issam Kassas
4.8 (10)
Smart Trend Trading System은 추세 정보, 진입·청산 신호, 가격 수준을 하나의 차트에 표시하는 MetaTrader 4용 지표입니다. 이 시스템은 추세 감지, 반전 구간, Smart Cloud, 트레일링 스톱 로직, 지지와 저항, 캔들 색상 표시, 알림, 다중 시간대 분석 등 10개 이상의 트레이딩 도구 를 하나의 시스템으로 결합합니다. 이 시스템은 다양한 시장 상황에서 거래를 돕도록 설계되었습니다: 추세장: 주요 추세를 식별하고, 되돌림을 감지하며, 모멘텀을 따라가고, 손절 가이드와 트레일링 스톱 옵션을 사용해 더 깔끔한 진입 지점을 찾습니다. 횡보장: 박스권 시장 상황을 감지하고, 반응 구간을 식별하며, 가격이 중요한 레벨에서 반응할 때 더 명확한 신호를 받을 수 있습니다. 스캘핑 및 인트라데이 거래: 빠른 신호, 캔들 색상, 알림, 다중 시간대 확인을 사용하여 단기 거래 결정을 지원합니다. 주요 기능: • 10개 이상의 인디케이터를 하나의 트레이딩 시스
Currency Strength Wizard
Oleg Rodin
4.85 (61)
통화 강도 마법사는 성공적인 거래를 위한 올인원 솔루션을 제공하는 매우 강력한 지표입니다. 표시기는 여러 시간 프레임의 모든 통화 데이터를 사용하여 이 또는 해당 외환 쌍의 힘을 계산합니다. 이 데이터는 특정 통화의 힘을 확인하는 데 사용할 수 있는 사용하기 쉬운 통화 지수 및 통화 전력선의 형태로 표시됩니다. 필요한 것은 거래하려는 차트에 표시기를 부착하는 것뿐입니다. 표시기는 거래하는 통화의 실제 강세를 보여줍니다. 지표는 또한 추세와 거래할 때 유리하게 사용할 수 있는 구매 및 판매 거래량 압력의 극한값을 보여줍니다. 지표는 또한 피보나치에 기반한 가능한 대상을 보여줍니다. 표시기는 PUSH 알림을 포함한 모든 유형의 알림을 제공합니다. 구매 후 연락주세요. 나는 당신과 거래 팁을 공유하고 당신에게 무료로 훌륭한 보너스 지표를 줄 것입니다! 나는 당신에게 행복하고 유익한 거래를 기원합니다!
M1 Sniper
Oleg Rodin
4.97 (30)
M1 SNIPER 는 사용하기 쉬운 거래 지표 시스템입니다. M1 시간대에 맞춰 설계된 화살표 지표입니다. 이 지표는 M1 시간대 스캘핑을 위한 단독 시스템으로 사용할 수 있으며, 기존 거래 시스템의 일부로도 사용할 수 있습니다. 이 거래 시스템은 M1 시간대 거래용으로 특별히 설계되었지만, 다른 시간대에도 사용할 수 있습니다. 원래는 XAUUSD와 BTCUSD 거래를 위해 이 방법을 설계했지만, 다른 시장 거래에도 유용하다는 것을 알게 되었습니다. 이 지표의 신호는 추세 방향과 반대로 거래될 수 있습니다. 저는 지표의 신호를 활용하여 양방향으로 거래할 수 있도록 돕는 특별한 거래 기법을 알려드립니다. 이 방법은 특별한 동적 지지선과 저항선 가격 영역을 활용하는 것을 기반으로 합니다. 구매하시면 M1 SNIPER 화살표 지표를 바로 다운로드하실 수 있습니다. 또한, 아래 스크린샷에 표시된 Apollo Dynamic SR 지표는 M1 SNIPER 도구를 사용하는 모든 사용자에게 무료로
Volume Break Oscillator는 가격 움직임을 오실레이터 형태로 볼륨 추세와 일치시키는 지표입니다. 저는 볼륨 분석을 제 전략에 통합하고 싶었지만 OBV, Money Flow Index, A/D, Volume Weighted Macd 및 기타 여러 지표와 같은 대부분의 볼륨 지표에 항상 실망했습니다. 그래서 저는 이 지표를 직접 작성했고, 얼마나 유용한지 만족스러워서 시장에 공개하기로 결정했습니다. 주요 기능: 가격이 볼륨 증가(브레이크)로 지원되는 방향으로 움직이는 단계를 강조합니다. 볼륨 증가가 멈추고 시장이 수축되는 단계를 강조합니다. 특히 시간 프레임(<=15분)이 있는 일중 거래에서 가격이나 볼륨이 움직이지 않아 시장이 향후 상승에 대비하는 단계를 강조합니다. 볼륨 증가로 지원되지 않는 다른 전문가 자문가의 거짓 신호를 걸러냅니다. 추세와 범위 단계를 시각화하는 것이 매우 쉽습니다. 입력 매개변수: 계산 설정: 계산 유형: FAST, NORMAL, S
Atomic Analyst
Issam Kassas
5 (13)
Atomic Analyst — MetaTrader 4 제품 문의, 설정 안내 또는 기술 지원이 필요하면 MQL5에서 직접 메시지를 보내 주세요. 이 인디케이터는 복잡한 시장 계산을 단순한 시각적 신호, 색상 표시 캔들, 추세 판독, 손절 레벨 및 여러 익절 구간으로 변환하여 트레이더가 빠르게 이해하고 실제 시장 상황에서 사용할 수 있게 합니다. 주요 거래 용도: 스캘핑 및 인트라데이 거래: 빠른 의사결정, 명확한 화살표, 알림, 캔들 색상 및 구조화된 진입/청산 구간을 위해 설계되었습니다. 데이 트레이딩 및 스윙 트레이딩: 추세 방향, 강도, 모멘텀 및 다중 시간대 분석을 사용하여 더 큰 시장 움직임을 따라갈 수 있도록 돕습니다. 주요 기능: • Price Action, 강도 및 모멘텀 분석 • 다중 시간대 추세 스캐너 • 전체 추세 비율 계산 • 매수 및 매도 화살표 • 손절 및 여러 익절 레벨 • 최대 5개의 피보나치 기반 익절 레벨 • 트레일링 스톱 로직 • 추세 및 모멘텀
Scalper Vault
Oleg Rodin
5 (39)
Scalper Vault 는 성공적인 스캘핑에 필요한 모든 것을 제공하는 전문 스캘핑 시스템입니다. 이 표시기는 외환 및 바이너리 옵션 거래자가 사용할 수 있는 완전한 거래 시스템입니다. 권장 시간 프레임은 M5입니다. 시스템은 추세 방향으로 정확한 화살표 신호를 제공합니다. 또한 상단 및 하단 신호와 Gann 시장 수준을 제공합니다.  이 시스템은 사용하기가 매우 쉽습니다. 원하는 시장 지역의 화살표만 따라가면 됩니다. 엑시트는 가격이 적정 수준에 도달하거나 시장의 고점 또는 저점 신호가 나타날 때 수행됩니다.  표시기는 PUSH 알림을 포함한 모든 유형의 경고를 제공합니다. 인디케이터 구매 후 연락주세요. 내 개인 거래 권장 사항과 훌륭한 보너스 지표를 무료로 공유합니다! 나는 당신에게 행복하고 유익한 거래를 기원합니다!
PZ Swing Trading
PZ TRADING SLU
5 (4)
Protect against whipsaws: revolutionize your swing trading approach Swing Trading is the first indicator designed to detect swings in the direction of the trend and possible reversal swings. It uses the baseline swing trading approach, widely described in trading literature. The indicator studies several price and time vectors to track the aggregate trend direction and detects situations in which the market is oversold or overbought and ready to correct. [ Installation Guide | Update Guide | Tro
Introduction to Fractal Pattern Scanner Fractal Indicator refers to the technical indicator that makes use of the fractal geometry found in the financial market. Fractal Pattern Scanner is the advanced Fractal Indicator that brings the latest trading technology after the extensive research and development work in the fractal geometry in the financial market. The most important feature in Fractal Pattern Scanner is the ability to measure the turning point probability as well as the trend probabi

This is a professional chart indicator designed for traders focused on stability and clear price action. It helps filter market noise and provides clear visual entry and exit zones for your trading decisions. Core Features: Strictly Non-Repainting: The system is built with strict non-repaint logic. What you see on the chart is the true historical performance. Confirmed Signals: Signals are triggered and confirmed only after the candle closes . Once a trading arrow appears on a closed candle, it

Advanced Supply Demand
Bernhard Schweigert
4.91 (302)
현재 30% 할인! 초보자나 전문 트레이더를 위한 최고의 솔루션! 이 보조지표는 우리가 다수의 독창적 기능과 새로운 공식을 통합한 독특하고 고품질이며 저렴한 거래 도구입니다. 이 업데이트를 통해 이중 시간대를 표시할 수 있습니다. 더 높은 TF를 표시할 수 있을 뿐만 아니라 차트 TF와 더 높은 TF 모두를 표시할 수 있습니다: 중첩 영역 표시. 모든 Supply Demand 트레이더들이 좋아할 것입니다. :) 중요한 정보 공개 Advanced Supply Demand의 잠재력을 극대화하려면 다음을 방문하십시오. https://www.mql5.com/ko/blogs/post/720245   진입 또는 목표의 명확한 트리거 포인트를 정확히 찾아냄으로 해서 거래가 어떻게 개선될지 상상해 보십시오. 새로운 알고리즘을 기반으로 매수자와 매도자 간의 잠재적인 불균형을 훨씬 더 쉽게 분간할 수 있습니다. 왜냐하면 가장 강한 공급영역과 가장 강한 수요 영역과 과거에 어떻게 진행 되었는지를(이전
Trend Catcher ind
Ramil Minniakhmetov
5 (11)
트렌드 캐처 인디케이터 트렌드 캐처 인디케이터는 개발자가 자체 개발한 맞춤형 적응형 트렌드 분석 지표들을 조합하여 시장 가격 움직임을 분석합니다. 단기적인 노이즈를 제거하고 근본적인 모멘텀 강도, 변동성 확대, 가격 구조 움직임에 집중하여 진정한 시장 방향을 파악합니다. 또한 이동 평균, RSI, 변동성 필터와 같은 맞춤형 지표들을 활용하여 가격을 평활화하고 트렌드를 필터링합니다. 실제 운영 모니터링 및 기타 제품은 다음 링크에서 확인하실 수 있습니다: https://www.mql5.com/en/users/mechanic/seller 텔레그램에서는 EA나 설정 파일을 판매하지 않습니다. 사기이니 주의하세요. 모든 설정 파일은 블로그에서 무료로 제공됩니다. 중요! 구매 후 즉시 연락 주시면 사용 방법 및 보너스를 드립니다!
DayTrader PRO MT4
Davit Beridze
4.6 (10)
DayTrader PRO MT5:  https://www.mql5.com/en/market/product/186222 DayTrader PRO는 존 에러스(John Ehlers)의 Laguerre 필터와 강력한 자동 최적화 엔진을 결합한 고급 트레이딩 지표입니다. 고정된 파라미터를 사용하는 대신, 최근 시장 상황을 바탕으로 최적의 설정을 자동으로 검색하므로 지속적인 수동 조정 없이도 변화하는 시장 변동성에 대응할 수 있습니다. 이 지표는 명확한 매수(BUY) 및 매도(SELL) 신호를 생성하며, 현재 시장 변동성을 기준으로 계산된 적응형 손절매(Stop Loss) 및 익절(Take Profit) 레벨을 제공합니다. 내장된 추세, 효율성 지수(Efficiency Ratio), 변동성 및 캔들 필터 기능은 저품질의 진입 신호를 제거하여 신호의 정확도를 높여줍니다. 실시간 성능 대시보드에서는 현재 최적화된 설정값, 수익 요인(Profit Factor), 승률(Win Rate), 최대 낙폭
Apollo SR Master
Oleg Rodin
5 (3)
Apollo SR Master는 지지/저항 구간에서의 거래를 더욱 쉽고 안정적으로 만들어 주는 특수 기능을 갖춘 지지/저항 지표입니다. 이 지표는 지역 가격의 고점과 저점을 감지하여 시간 지연 없이 실시간으로 지지/저항 구간을 계산합니다. 새롭게 형성된 저항 구간을 확인하기 위해 지표는 해당 저항 구간을 실제 매도 또는 매수 신호로 활용할 수 있음을 나타내는 특수 신호를 표시합니다. 이 경우, 저항 구간의 강도가 높아지고, 따라서 저항 구간에서의 성공적인 거래 가능성도 높아집니다. 이것이 바로 이 지표의 핵심 아이디어입니다. SR 존은 손절매와 이익실현을 더욱 쉽게 할 수 있도록 해줍니다. 신호 방향에 따라 SR 존 위 또는 아래 공간을 손절매로 활용할 수 있습니다. 또한, 반대쪽 SR 존은 잠재적 이익실현 영역으로 활용할 수 있습니다. 또한 Apollo SR Master 지표를 사용하는 모든 사용자에게 "Apollo Price Action System" 지표를 무료로 제공합니다.
Advanced Currency Strength28 Indicator

Bernhard Schweigert
4.91 (659)
현재 40% 할인 초보자 또는 전문가 트레이더를 위한 최고의 솔루션! 이 지표는 우리가 독점 기능과 새로운 공식을 통합했기 때문에 독특하고 고품질이며 저렴한 거래 도구입니다. 단 하나의 차트로 28 Forex 쌍의 통화 강도를 읽을 수 있습니다! 새로운 추세 또는 스캘핑 기회의 정확한 트리거 포인트를 정확히 찾아낼 수 있기 때문에 거래가 어떻게 개선될지 상상해 보십시오. 사용 설명서: 여기를 클릭  https://www.mql5.com/en/blogs/post/697384 그것이 첫 번째, 원본입니다! 쓸모없는 지망생 클론을 사지 마십시오. 더 스페셜  강력한 통화 모멘텀을 보여주는 하위 창의 화살표 GAP가 거래를 안내합니다! 기본 또는 호가 통화가 과매도/과매도 영역(외부 시장 피보나치 수준)에 있을 때 개별 차트의 기본 창에 경고 표시가 나타납니다. 통화 강도가 외부 범위에서 떨어질 때 풀백/반전 경고. 교차 패턴의 특별 경고 추세를 빠르게 볼 수 있는 다중 시간
Top Bottom Tracker MT4
Rodrigo Arana Garcia
탑 바텀 트래커는 시장 추세를 분석하고 추세의 고점과 저점을 감지할 수 있는 정교한 알고리즘을 기반으로 하는 지표입니다 / MT5 버전 . 가격은 500$에 도달할 때까지 점진적으로 상승합니다. 다음 가격 --> $99 특징 다시 칠하지 않음 이 표시기는 새 데이터가 도착해도 값을 변경하지 않습니다 거래 쌍 모든 외환 쌍 기간 모든 기간 파라미터 ==== 인디케이터 구성 ==== 구성 매개 변수 // 40 (값이 높을수록 신호가 적지만 더 정확한 신호가 제공됩니다) 상위 레벨 값 // 80 (상단 수평선의 값) 하단 레벨 값 // 20 (하단 수평선 값) 인디케이터 계산 막대 수 // 3000 (인디케이터를 계산할 막대 수). 값 0은 모든 막대에 대해 인디케이터를 계산합니다) ==== 알람 구성 ==== 팝업 알림 // 참(터미널에서 알람) 이메일 알림 // 참(이메일로 알람 전송) 알람 시간 간격 // 10 (분 단위의 알람 간격) 경고
KURAMA GOLD SIGNAL PRO (MT4) — 7중 필터 · 자동 TP/SL · 품질 점수 · 시그널 기록 저장 | XAUUSD 완전 트레이딩 시스템 실시간 리페인트 없음. 시그널이 나타나는 순간 화살표, 진입, TP, SL이 그 자리에 고정되어 이후 절대 움직이지 않습니다. 여러분이 거래하는 것은 바로 이 실시간 시그널입니다. 그리고 v7.20에서는 실제로 발신된 모든 시그널이 자동 저장되어 재시작 후에도 정확히 복원됩니다. 구매자 전용 보너스 평생 라이선스를 구매하시면 AI Zone Radar($59 상당) + 완전 PDF 매뉴얼을 무료로 드립니다. 제품 가격에 더해 $59 상당의 보너스가 따라옵니다. 구매 후 MQL5로 메시지를 보내주세요. AI Zone Radar: https://www.mql5.com/en/market/product/175834 골드 트레이더 커뮤니티에서 실제로 사용되며 정확성과
Scalping Points Pro
Andrey Kozak
5 (3)
Scalping Points Pro is an indicator that shows possible price reversal points on the chart and does not redraw its signals. Also, the indicator sends signals to the trader via Email and Push. The accuracy of the signals of this indicator is approximately 92-94% on the M5 timeframe and more than 95% on the H1 timeframe. Thus, this indicator allows the trader to accurately open trades and predict further price movement. The indicator does not redraw its signals.  The indicator works on timeframe


ARTEMIS 서브 윈도우 리버설 시스템 은 리페인트가 없는 강력한 외환(Forex) 지표로, Smart Money Concepts(스마트 머니 개념)와 스토캐스틱 모멘텀 분석을 결합하여 고확률의 반전 거래를 식별하도록 설계되었습니다. 정확한 진입을 원하는 트레이더를 위해 개발된 이 인디케이터는 유동성 스윕 탐지, 시장 구조 변화, 모멘텀 확인을 하나의 깔끔하고 전문적인 트레이딩 도구로 통합합니다. 이 인디케이터가 돋보이는 이유 대부분의 인디케이터는 무작위 신호를 제공합니다. 하지만 ARTEMIS는 실제 시장 움직임에 집중합니다: 유동성 스윕(스탑 헌팅) 감지 구조 변화(ChoCH) 확인 K/D 크로스를 통한 타이밍 결정 명확한 매수/매도 화살표 제공 리페인트 없는 로직 구조 이로 인해 불필요한 가짜 신호가 줄고, 더 높은 품질의 매매 기회가 생성됩니다. 완벽한 매수 신호 시스템 (핵심 강점) 이 인디케이터는 특히 매수 진입에서 강력합니다: 1단계: 약한 하락 모멘텀 스토캐스틱 K와
Currency Strength Matrix
Raymond Gilmour
4.5 (26)
THE ONLY CURRENCY STRENGTH INDICATOR BUILT ON PRICE ACTION Most currency strength meters average an oscillator, or measure how far price has travelled. But these are not accurate measures of trend, Currency Strength Matrix measures trend strength, not just if a currency price has gone up or down. Currency Strength Matrix reads market structure . For each of the 28 major pairs it finds the confirmed cycle highs and lows, and decides whether that pair is in an uptrend, a downtrend, or neither. A
Advanced Currency IMPULSE with ALERT
Bernhard Schweigert
4.9 (491)
현재 40% 할인!! 초보자 또는 전문가 트레이더를 위한 최고의 솔루션! 이 지표는 우리가 독점 기능과 비밀 공식을 통합했기 때문에 독특하고 고품질이며 저렴한 거래 도구입니다. 단 하나의 차트로 28개 통화 쌍 모두에 대한 경고를 제공합니다. 새로운 추세 또는 스캘핑 기회의 정확한 트리거 포인트를 정확히 찾아낼 수 있기 때문에 거래가 어떻게 개선될지 상상해 보십시오! 새로운 기본 알고리즘을 기반으로 구축되어 잠재적인 거래를 훨씬 더 쉽게 식별하고 확인할 수 있습니다. 이는 통화의 강세 또는 약세가 가속되는지 여부를 그래픽으로 표시하고 가속 속도를 측정하기 때문입니다. 자동차의 속도계처럼 생각하면 됩니다. 가속화할 때 Forex 시장에서 동일한 일이 분명히 더 빠르게 발생합니다. 즉, 반대 방향으로 가속화되는 통화를 페어링하면 잠재적으로 수익성 있는 거래를 식별한 것입니다. 통화 모멘텀의 수직선과 화살표가 거래를 안내합니다! 역동적인 Market Fibonacci 23 레벨은
Harmonic Pattern Plus MT4
Young Ho Seo
4.44 (18)
Introduction Harmonic Patterns are best used to predict potential turning point. Traditionally, Harmonic Pattern was identified manually connecting peaks and troughs points in the chart. Manual harmonic pattern detection is painfully tedious and not suitable for everyone. You are often exposed under subjective pattern identification with manual pattern detection. To avoid these limitations, Harmonic Pattern Plus was designed to automate your harmonic pattern detection process. The functionality
Scalper Inside PRO
Alexey Minkov
4.74 (69)
Scalper Inside PRO helps you read the intraday trend and plan a trade before you enter the market. It is built around three exclusive strategies for a sharper read of the market. The moment a signal appears, the indicator evaluates market direction and calculates the key levels, so you see the potential entry, the expected stop-loss and several profit-taking levels in advance. Detailed performance statistics show how different instruments and strategies performed in history and help you pick ass
GoldRush Trend Arrow Signal
Kirk Lee Holloway
5 (2)
GoldRush 트렌드 화살표 신호 GoldRush 트렌드 화살표 신호 지표는 XAU/USD 시장에서 고속 단기 스캘핑 트레이더를 위해 설계된 정밀한 실시간 트렌드 분석을 제공합니다. 1분 시간대에 특화되어 설계된 이 도구는 명확한 진입점을 표시하는 방향성 화살표를 제공하여 스캘퍼들이 변동성이 높은 시장 환경에서도 자신 있게 거래할 수 있도록 합니다. 이 지표는 PRIMARY 및 SECONDARY 경고 화살표로 구성됩니다. PRIMARY 신호는 추세 방향의 변화를 나타내는 흰색과 검은색 방향성 화살표이며, SECONDARY 신호는 PRIMARY 화살표가 지시하는 방향을 확인하고 잠재적인 거래 진입점을 표시하는 파란색과 빨간색 화살표입니다. 참고: 추세 방향이 변경된 후 PRIMARY 경고 화살표가 단 하나만 표시될 경우, 다수의 SECONDARY 파란색/빨간색 화살표가 표시될 수 있음을 유의해야 합니다. SECONDARY 신호는 신호 기준을 충족하는 어떤 캔들 이후에도 표시
Liquidity Scalper System
Stanislav Konin
5 (1)
Liquidity Scalper System  is a next-generation professional trading system that combines spectral market structure analysis, the dynamic  Liquidity Spectrum  liquidity heatmap, and an intelligent market imbalance assessment algorithm. The system continuously analyzes changes in price structure, identifies probable areas of limit and stop order concentration, detects potential liquidity pools, and evaluates the strength of breakout momentum. To achieve maximum accuracy, it additionally uses mul
제작자의 제품 더 보기
SWING DETECTOR WITH RSI AND FIBONACCI Structural Swing Points + Fibonacci Retracement + RSI Overlay -------------------------------------------------- FREE INDICATOR Identify swings. See Fibonacci levels. Check RSI. All in one free indicator. -------------------------------------------------- WHAT THIS INDICATOR DOES This indicator automatically detects structural swing highs and lows using configurable depth and deviation filtering. It connects swings with trend lines, overlays standard
FREE
Trend and Consolidation Matrix is an MT5 market structure and price action indicator combining a 6-layer adaptive trend ribbon, spatial consolidation zone mapping, and dynamic breakout-retest alerts for Forex, Gold (XAUUSD), and Indices. Engineered for scalping, day trading, and swing trading, this tool unifies multi-layer trend direction, volatility structure, and price density geometry calculated strictly on completed bars with zero historical repainting. Core Market Structure Architecture The
FREE
SWING DETECTOR WITH RSI AND FIBONACCI Structural Swing Points + Fibonacci Retracement + RSI Overlay -------------------------------------------------- FREE INDICATOR Identify swings. See Fibonacci levels. Check RSI. All in one free indicator. -------------------------------------------------- WHAT THIS INDICATOR DOES This indicator automatically detects structural swing highs and lows using configurable depth and deviation filtering. It connects swings with trend lines, overlays standard
FREE
SWING VOLUME PROFILE Swing-Based Volume Profile + Fibonacci + RSI -------------------------------------------------- Auto-detected swings. Volume profile. Fibonacci. RSI. All-in-one. -------------------------------------------------- WHAT THIS INDICATOR DOES Swing Volume Profile (SVP) automatically detects structural swings and displays a volume profile for the most recent completed swing — with Fibonacci retracement and RSI overlay. No manual range selection needed. The indicator finds
Fixed Range Volume Profile is an MT5 volume analysis tool that calculates and displays volume distribution across any custom price and time range using standard chart trendlines for Forex, Gold (XAUUSD), Indices, and Crypto. Designed for day trading, scalping, and swing trading, this indicator automatically maps the Point of Control (POC), Value Area boundaries (VAH/VAL), and high-volume support and resistance levels without requiring manual object naming or complex setup. Core Volume Profile Ar
SWING HIGHS LOWS DETECTOR Swing Detection with Divergence Analysis -------------------------------------------------- Identify swings. Spot divergences. Trade with confluence. -------------------------------------------------- WHAT THIS INDICATOR DOES This indicator automatically detects structural swing highs and lows using configurable depth and deviation filtering. It then analyzes RSI and MACD to detect regular and hidden divergences between consecutive swings of the same type. Diver
FREE
VWAP Ribbons
Charles Mwangi Ndungu
VWAP Ribbon Intelligence is an MT5 technical analysis indicator combining Volume-Weighted Average Price (VWAP), dynamic Wilder ATR volatility ribbons, and on-chart RSI momentum telemetry for Forex, Gold (XAUUSD), Indices, and Crypto. Engineered for day trading, scalping, and swing trading, this tool projects volatility expansion and momentum values directly onto the main price chart without requiring secondary subwindow oscillators. Core Analytical Architecture The indicator features a dual-mode
FREE
SWING HIGHS LOWS DETECTOR Swing Detection with Divergence Analysis -------------------------------------------------- Identify swings. Spot divergences. Trade with confluence. -------------------------------------------------- WHAT THIS INDICATOR DOES This indicator automatically detects structural swing highs and lows using configurable depth and deviation filtering. It then analyzes RSI and MACD to detect regular and hidden divergences between consecutive swings of the same type. Diver
FREE
VWAP Ribbon Intelligence is an MT4 technical analysis indicator combining Volume-Weighted Average Price (VWAP), dynamic Wilder ATR volatility ribbons, and on-chart RSI momentum telemetry for Forex, Gold (XAUUSD), Indices, and Crypto. Engineered for day trading, scalping, and swing trading, this tool projects volatility expansion and momentum values directly onto the main price chart without requiring secondary subwindow oscillators. Core Analytical Architecture The indicator features a dual-mode
FREE
Fixed Range Volume Profile MT4 Volume Profile Indicator — Auto-Detecting Trendline Tracking, POC, Value Area & High Volume Nodes in Real Time Fixed Range Volume Profile (FRVP) displays volume distribution over a user-defined range — automatically detecting the latest trendline you draw or drag on the chart. No manual range selection. No naming conflicts. Just draw a trendline and the profile appears. Update it live by dragging. MT4 Native • No Repainting • Real-Time Trendline Tracking • Fully Cu
CONSOLIDATION INTELLIGENCE PRO MT4 Consolidation Indicator | Automatic Range Detection + 5-Tier Price-Density Heatmaps + Re-Entry Alerts Consolidation Intelligence Pro is a MetaTrader 4 indicator designed to identify areas where price repeatedly overlaps and trades within a concentrated range. The indicator analyzes candle overlap, body-to-wick structure, zone strength, and price-density distribution, then displays detected consolidation areas as 5-tier heatmaps directly on the chart. It also su
DONCHIAN MARKET & TREND INTELLIGENCE ENGINE (MT4) Multi-Factor Volatility, Trend Structure & Institutional Breakout Validation Dashboard MOST BREAKOUT INDICATORS ARE TRAPPING YOU. They Tell You THAT Price Broke Out. They Never Tell You IF It Will Hold. You have lived this scenario dozens of times: Price spends days coiling inside a tight Donchian band on your MT4 chart. A massive candle punches above the 20-period high. You buy the breakout — expecting momentum. Three candles later, price colla
BOLLINGER MARKET & TREND INTELLIGENCE MT4 Bollinger Breakout Analysis • Volatility Regimes • Trend Structure • Breakout Validation • Post-Breakout Analysis STOP GUESSING WHICH BREAKOUTS ARE REAL. You've been here before. Price closes outside the upper Bollinger Band. You see the breakout. You hesitate for a second — then enter. Three candles later, price is back inside the band. The breakout failed. Now you're wondering whether you entered too early, whether you should have waited for a retest,
VWAP Sniper Reversal
Charles Mwangi Ndungu
VWAP Sniper Reversal Pro v3.00 MT4 Mean-Reversion Indicator — Rolling VWAP, Dual-Layer ATR Bands, Volume Exhaustion, RSI Gate & Confirmation Modes VWAP Sniper Reversal Pro identifies potential mean-reversion setups at statistical price extremes. It combines a rolling volume-weighted average price (VWAP) baseline, dual-layer ATR deviation bands, volume and wick exhaustion filters, and an RSI gate to confirm reversal signals on completed bars. Built for traders who want multi-factor confluence ra
Adaptive Swing Density Heat Map MT5 Structural Density Indicator — Swing Clustering, Participation Tracking, Acceptance vs Rejection & Color-Coded Heat Map Adaptive Swing Density Heat Map analyzes swing point density across price levels, then tracks how price actually interacts with each zone — measuring participation, acceptance, and rejection. The result is a heat map of structural zones, color-coded by density strength. Not all support and resistance levels are equal — this indicator quantif
Last Swing Volume Profile
Charles Mwangi Ndungu
Swing Volume Profile MT5 Swing Volume Profile Indicator — Auto Swing Detection, Volume Profile, Fibonacci Retracement & RSI Overlay in One Chart Tool Swing Volume Profile (SVP) automatically detects structural swings and displays a volume profile for the most recent completed swing — with Fibonacci retracement and RSI overlay. No manual range selection. No trendline required. The indicator finds the swings and builds the profile automatically. MT5 Native • No Repainting • Auto Swing Detection •
Consolidation Intelligence Pro MT5 Consolidation Indicator — Automatic Range Detection, 5-Tier Price-Density Heatmaps & Re-Entry Alerts Consolidation Intelligence Pro automatically identifies where price repeatedly overlaps and trades within a concentrated range — then renders that structure as a 5-tier price-density heatmap directly on your chart. No more manually drawing every consolidation box. The indicator analyzes historical price structure, measures candle overlap and body-to-wick charac
DONCHIAN MARKET & TREND INTELLIGENCE The Only Donchian Tool That Tells You WHY the Market Is Moving — Not Just Where Most Donchian indicators draw three lines and call it a day. You get an upper band. A middle band. A lower band. And when price pokes above the upper band, you're supposed to just... buy? That's not analysis. That's guessing with extra steps. THE PROBLEM EVERY DONCHIAN TRADER KNOWS You've seen it a hundred times. Price finally breaks above the 20-period high after days of compress
BOLLINGER MARKET & TREND INTELLIGENCE — MT5 STOP GUESSING WHAT A BOLLINGER BREAKOUT IS TELLING YOU You've been here before. It's 2 AM. You're staring at a chart. Price has just closed outside the upper Bollinger Band. You enter. Three candles later, price is back inside the band. Then the move reverses. You tell yourself: "I should have waited for a retest." But when you wait for the retest, sometimes price continues without giving you the entry you wanted. So you add another filter. RSI. Then M
VWAP Sniper Reversal Pro
Charles Mwangi Ndungu
VWAP Sniper Reversal Pro is an MT5 reversal and pullback indicator combining Volume-Weighted Average Price (VWAP), dual-layer ATR volatility bands, volume exhaustion spikes, and RSI momentum filters for Forex, Gold (XAUUSD), Indices, and Crypto. Designed for scalping, day trading, and swing trading, this tool identifies market turning points when price becomes overstretched from fair value, calculating all confirmed signals strictly on completed bars with zero historical repainting. Core 4-Facto
Super Trend and Consolidation Matrix is an MT5 market structure and price action indicator combining a 6-layer trend ribbon, volatility squeeze engine, dynamic consolidation zones, and a real-time confluence dashboard for Forex, Gold (XAUUSD), and Indices. Engineered for scalping, day trading, and swing trading, this system provides objective structural analysis calculated strictly on completed bars with zero historical repainting. Core Market Structure Engine The indicator synchronizes multiple
필터:
리뷰 없음
리뷰 답변