Smart Trend Matrix
- 지표
-
Sahib Ul Ahsan
 ⚡ Premium MT4 & MT5 EA Developer | MQL4/MQL5 Algo Programmer | Trading Bot & Indicator Architect
Are you serious about taking your trading to the next level with automation? - 버전: 1.0
- 활성화: 20
Smart Trend Matrix
Smart Trend Matrix is a professional market analysis indicator designed to give traders a clear and structured view of current market conditions directly on the chart.
Rather than relying on a single market signal, the indicator combines multiple areas of market analysis to help identify directional bias, trend strength, momentum, volatility, and overall market conditions. The results are presented through a clean dashboard and easy-to-understand visual signals.
Key Features
Smart Market Dashboard
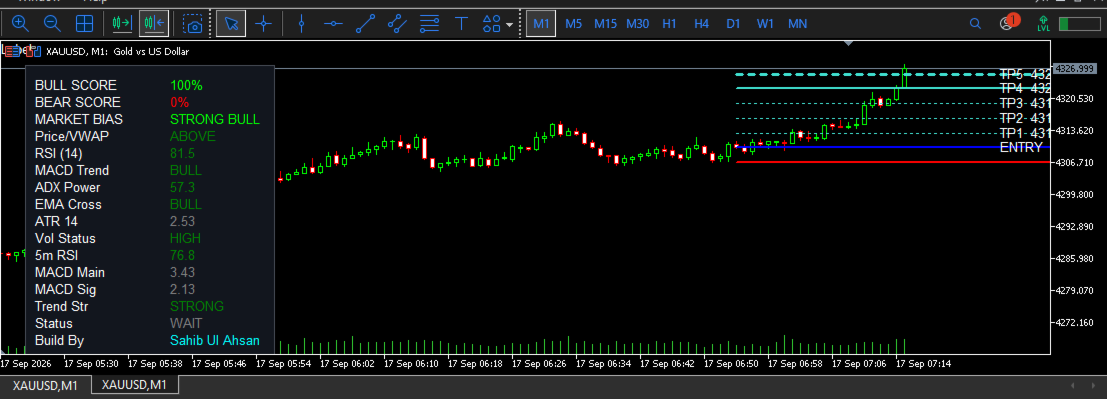
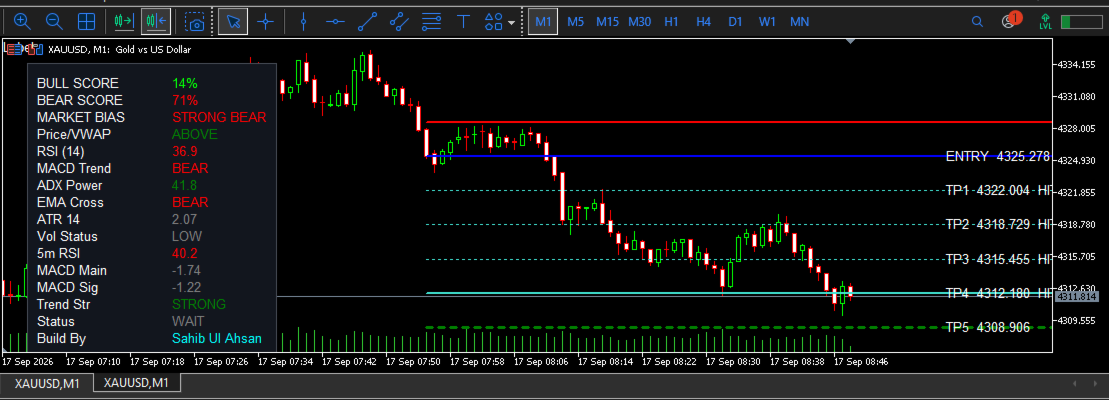
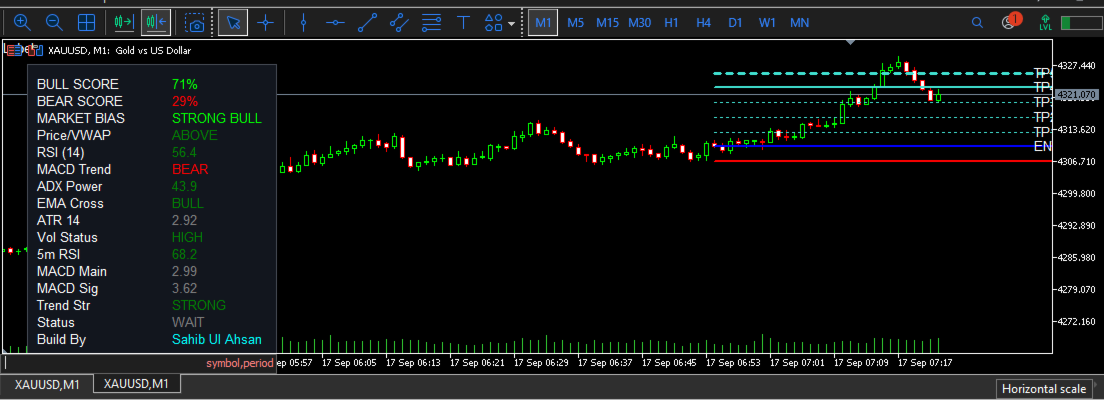
The on-chart dashboard provides a quick overview of important market information, including:
- Bull Score and Bear Score
- Current Market Bias
- Price and VWAP position
- RSI
- MACD Trend
- ADX Trend Strength
- EMA Cross
- ATR
- Volume Status
- 5-Minute RSI
- MACD Main and Signal values
- Trend Strength
- Current signal status
This allows traders to understand the broader market environment without having to monitor several separate indicators.
Visual Buy and Sell Signals
Smart Trend Matrix displays clear visual BUY and SELL signals directly on the chart when its internal market analysis identifies a potential directional setup.
The purpose is to make important market changes easier to recognize without requiring traders to constantly interpret multiple technical indicators manually.
Automatic Trade Level Visualization
One of the key features of Smart Trend Matrix is its visual trade setup.
When a new signal is generated, the indicator draws clearly defined levels directly on the chart:
- ENTRY — shows the reference entry price.
- SL — displays the calculated Stop Loss level.
- TP1 — first Take Profit target.
- TP2 — second Take Profit target.
- TP3 — third Take Profit target.
- TP4 — fourth Take Profit target.
- TP5 — fifth Take Profit target.
Each level is displayed with its corresponding price value and horizontal line, making the complete trade structure easy to see directly from the chart.
As price reaches the different Take Profit levels, the indicator visually updates the corresponding levels so traders can quickly see which targets have been reached.
Designed for Clear Decision Support
Smart Trend Matrix is designed to reduce chart clutter while providing meaningful market information in one place.
You can use the dashboard to understand the current market environment and the chart levels to visualize the potential trade structure.
The indicator's internal calculation methodology, scoring system, weighting, signal thresholds, and proprietary conditions are intentionally not disclosed. This keeps the underlying strategy protected while allowing users to benefit from the analysis and visualization it provides.
Important Information:
Smart Trend Matrix is an analytical and decision-support tool. Trading involves risk, and signals or projected levels should not be considered guarantees of future results.
Simple View. Structured Analysis. Clear Trade Levels.
Smart Trend Matrix brings market analysis and trade visualization together in a single indicator, helping traders spend less time interpreting scattered information and more time focusing on price action and risk management.
Smart Trend Matrix — Understand the Market. See the Structure. Plan the Trade.