Impulse Factor
- 지표
- 버전: 1.1
- 업데이트됨: 9 9월 2026

Indicator name: Impulse Factor 2.14/2.6.
Category: Indicators / Technical analysis / Trading panels
Brief description
A semi‑automatic professional tool for marking correction zones based on the author’s mathematical coefficients 2.14 and 2.6. The indicator instantly calculates the exact potential of the impulse wave, builds a target zone, sets Take Profit/Stop Loss levels, and automatically calculates the recommended lot for entry based on your balance and risk!
Full description
Impulse Factor 2.14/2.6 is an interactive graphical tool designed specifically for traders who use Price Action, Smart Money Concepts, and wave analysis of impulse movements in their trading. Instead of lagging and repainting indicators, this tool relies on pure market mathematics. It takes as its basis the range of the wave (impulse) you have selected and breaks it down into precise mathematical proportions: the 2.14 and 2.6 coefficients define the ideal zone for searching for a reversal or continuation of the trend.
How it works in 2 clicks:
1. You click the [+] DRAW ZONE button on the chart (the marking mode is activated).
2. You make just two regular mouse clicks: first, on the first extremum (the start of the wave), then on the second (its peak).
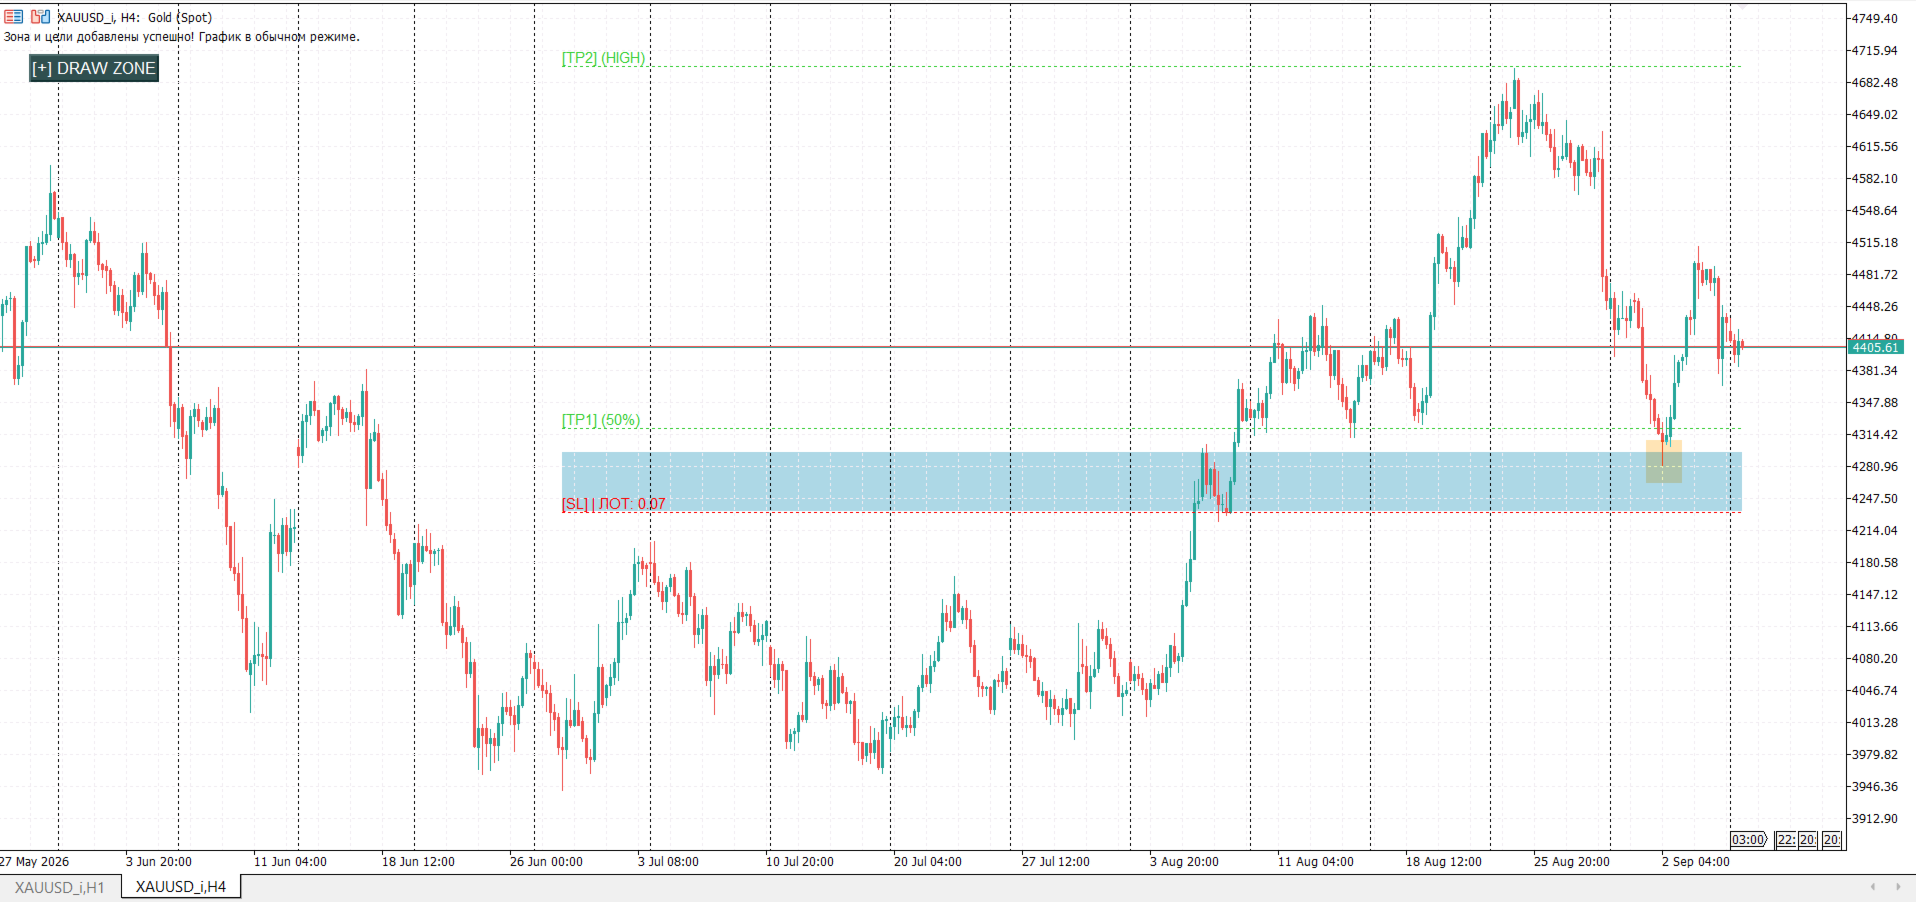
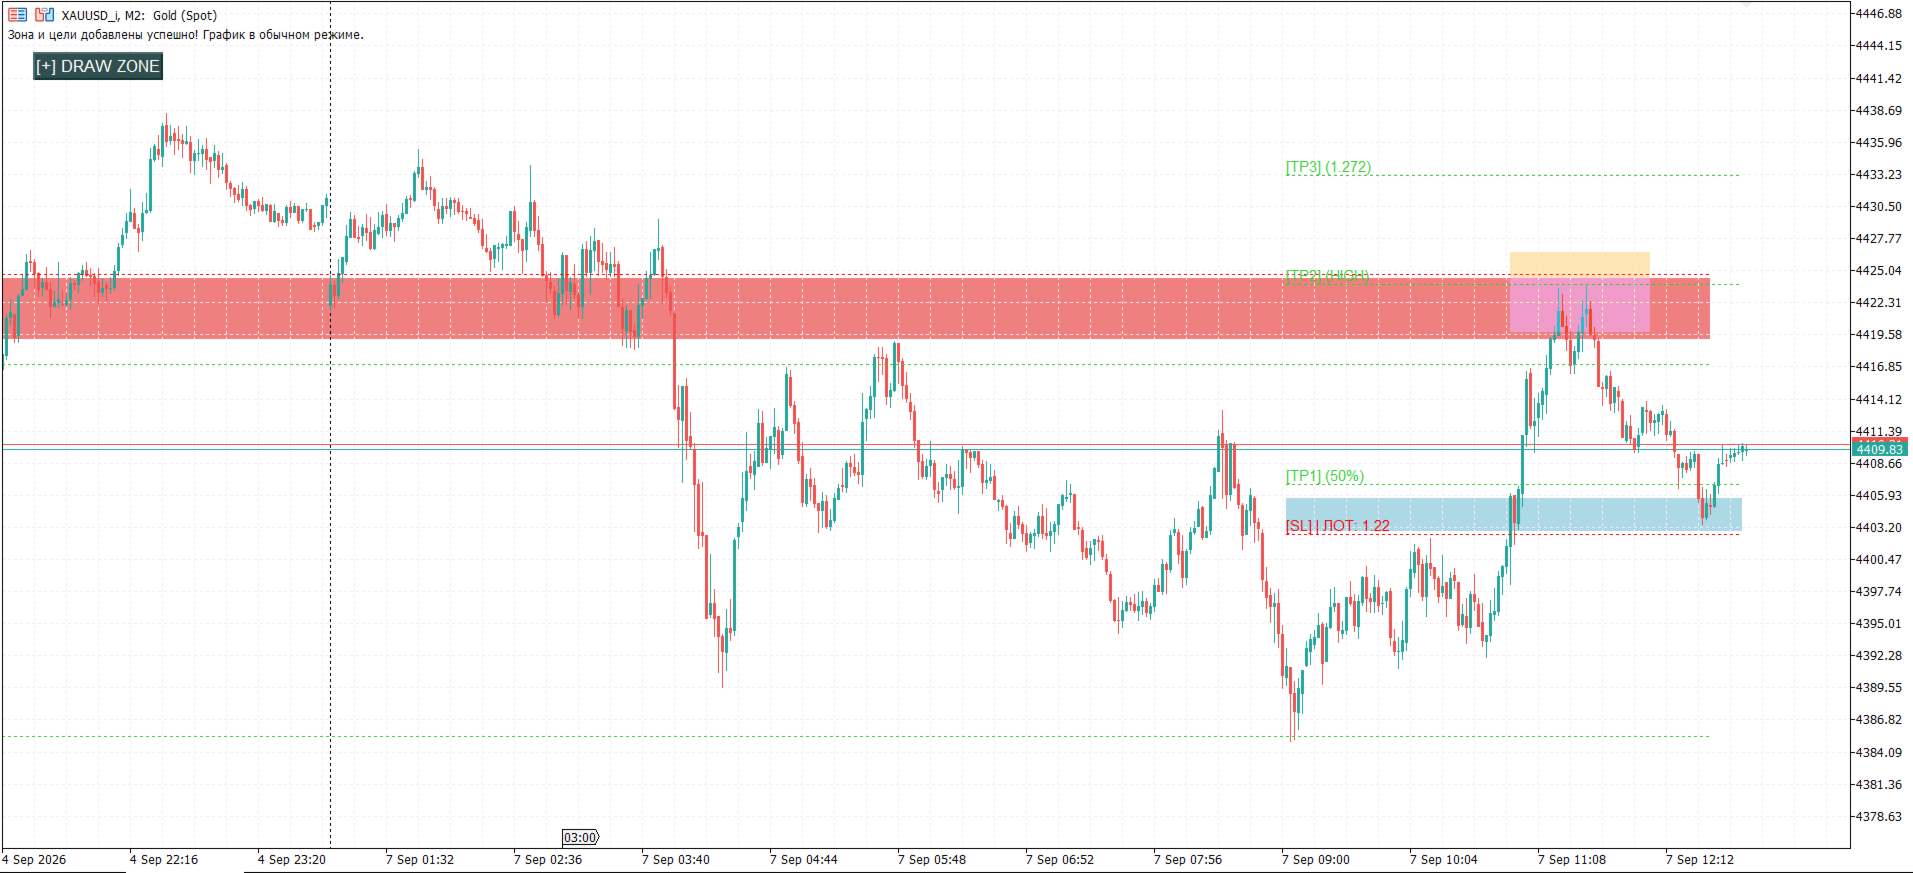
o Buy Zone (Buy Setup): If the second click is higher than the first (uptrend). The indicator will automatically magnet the starting point to the exact low (iLow) of the candle and build the zone from the extremum upwards.
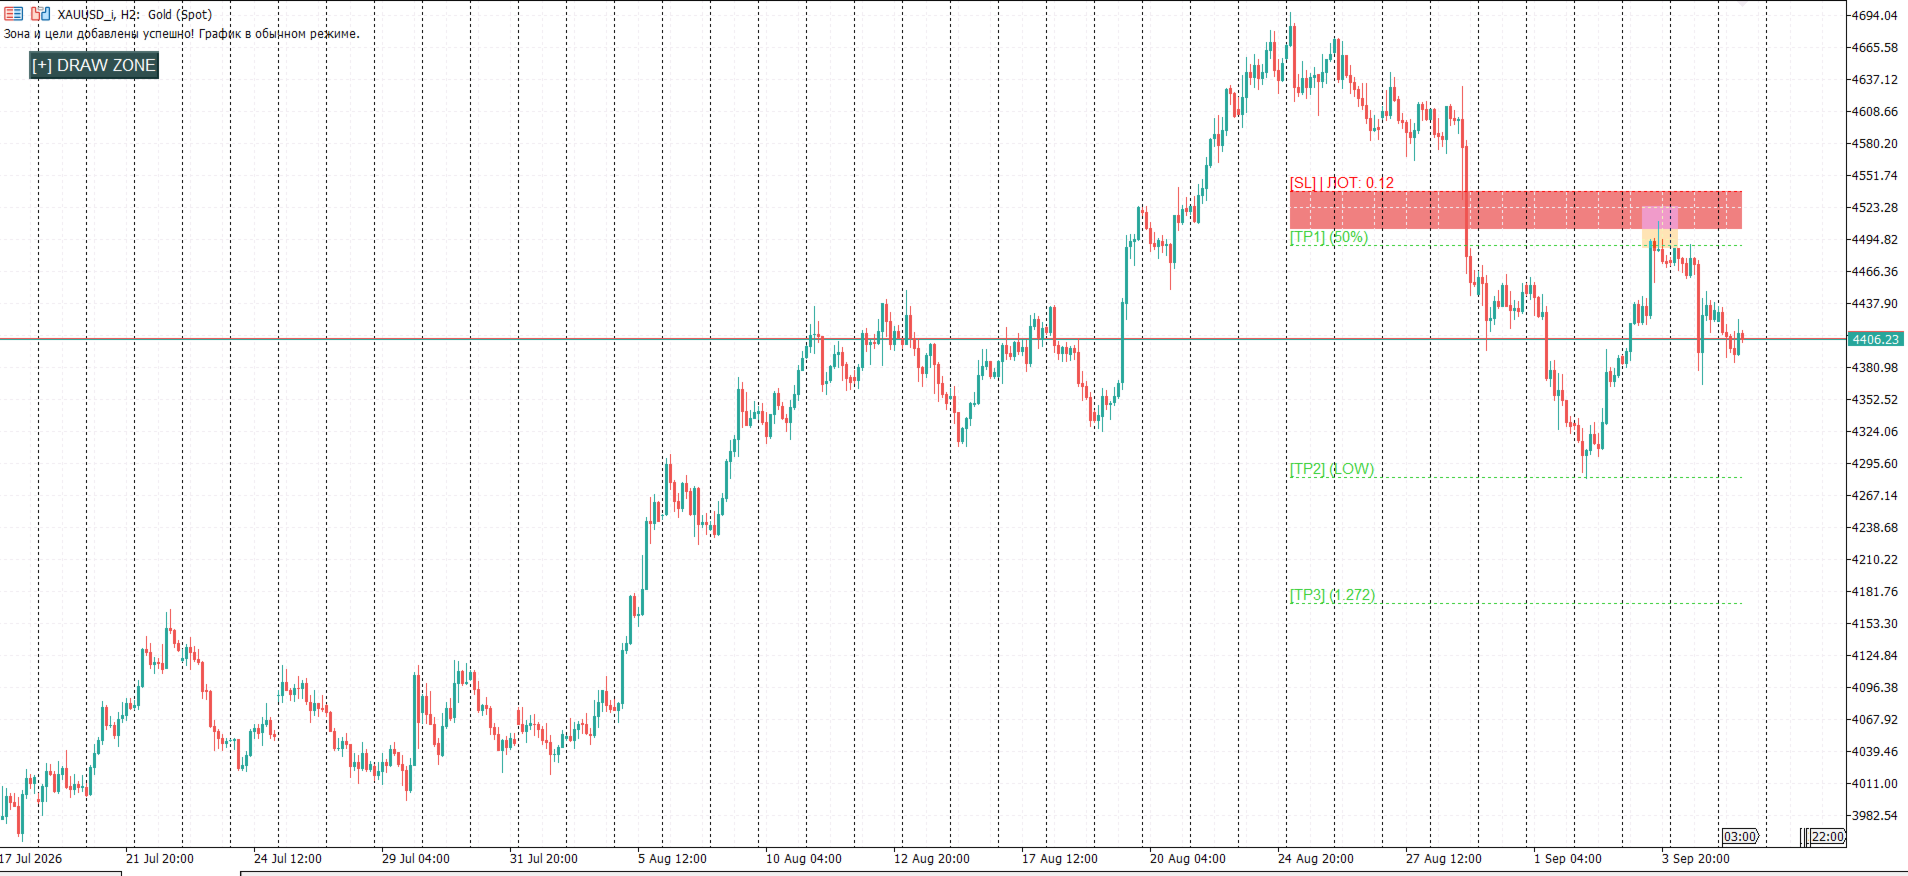
o Sales Zone (Sell Setup): If the second click is lower than the first (down trend). The indicator will automatically magnetize the starting point to the exact high (iHigh) of the candle and build a zone from the extreme point downward.
Key advantages and functionality:
• Automatic order volume calculation (Lot): The indicator reads your current balance and calculates the exact lot based on the risk set in the settings (for example, 1% per trade). The lot value is displayed right above the Stop‑Loss line!
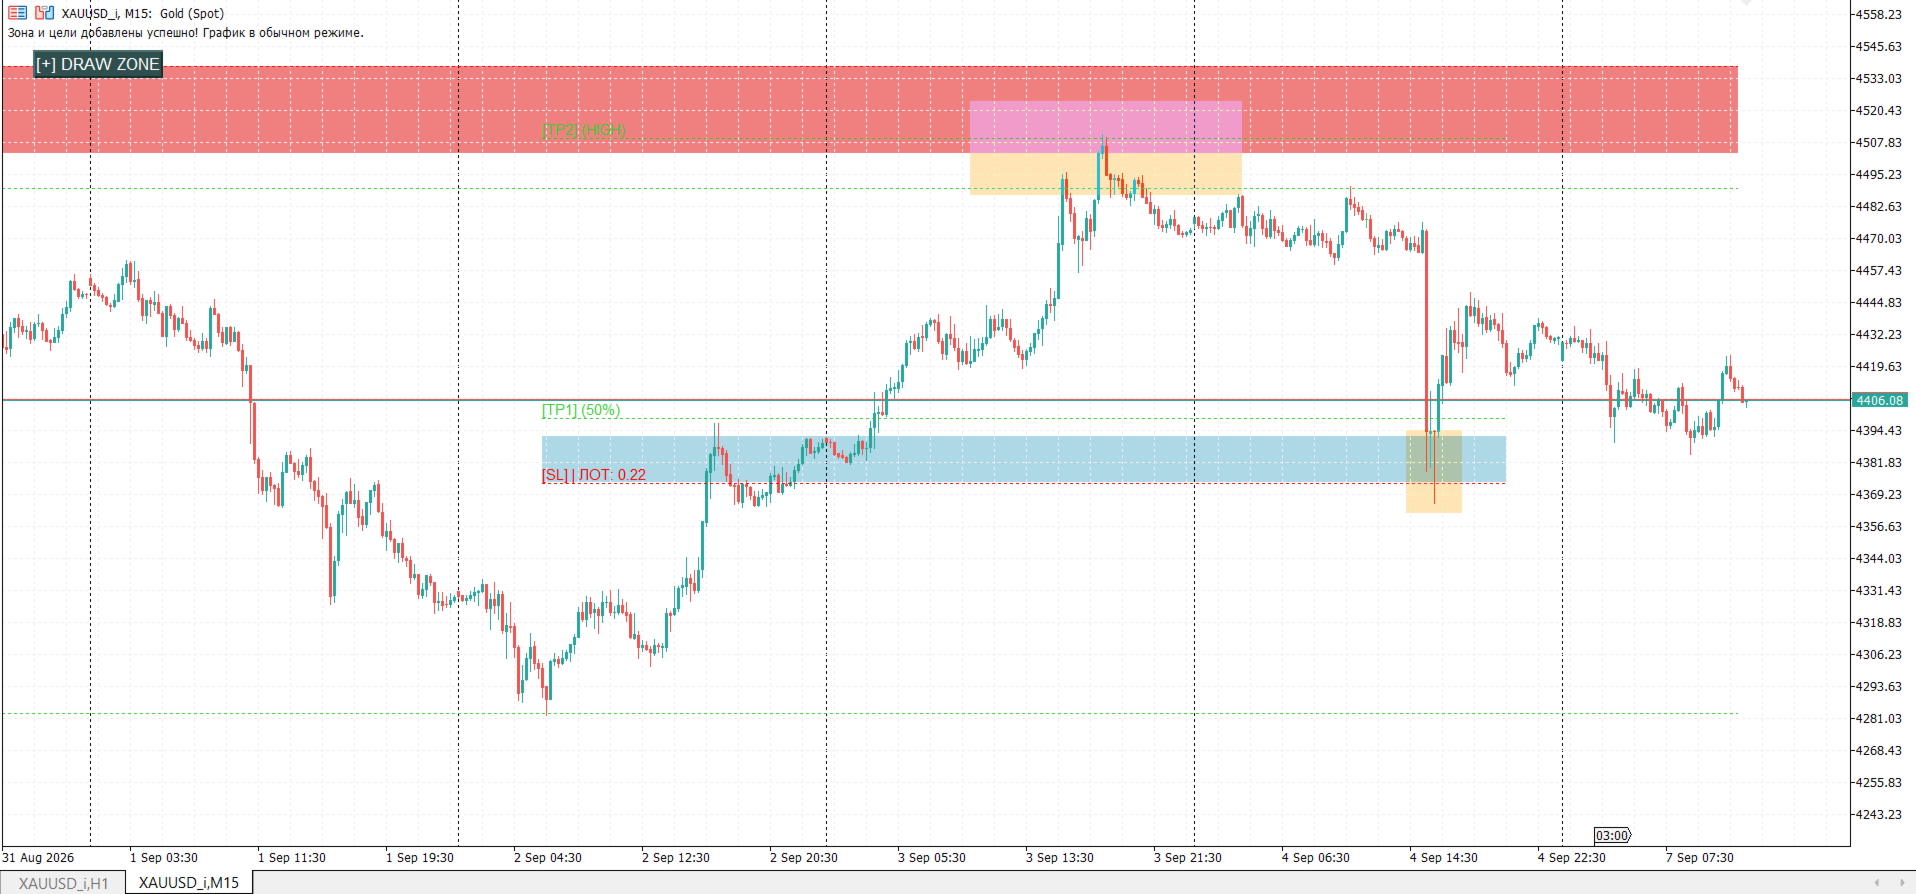
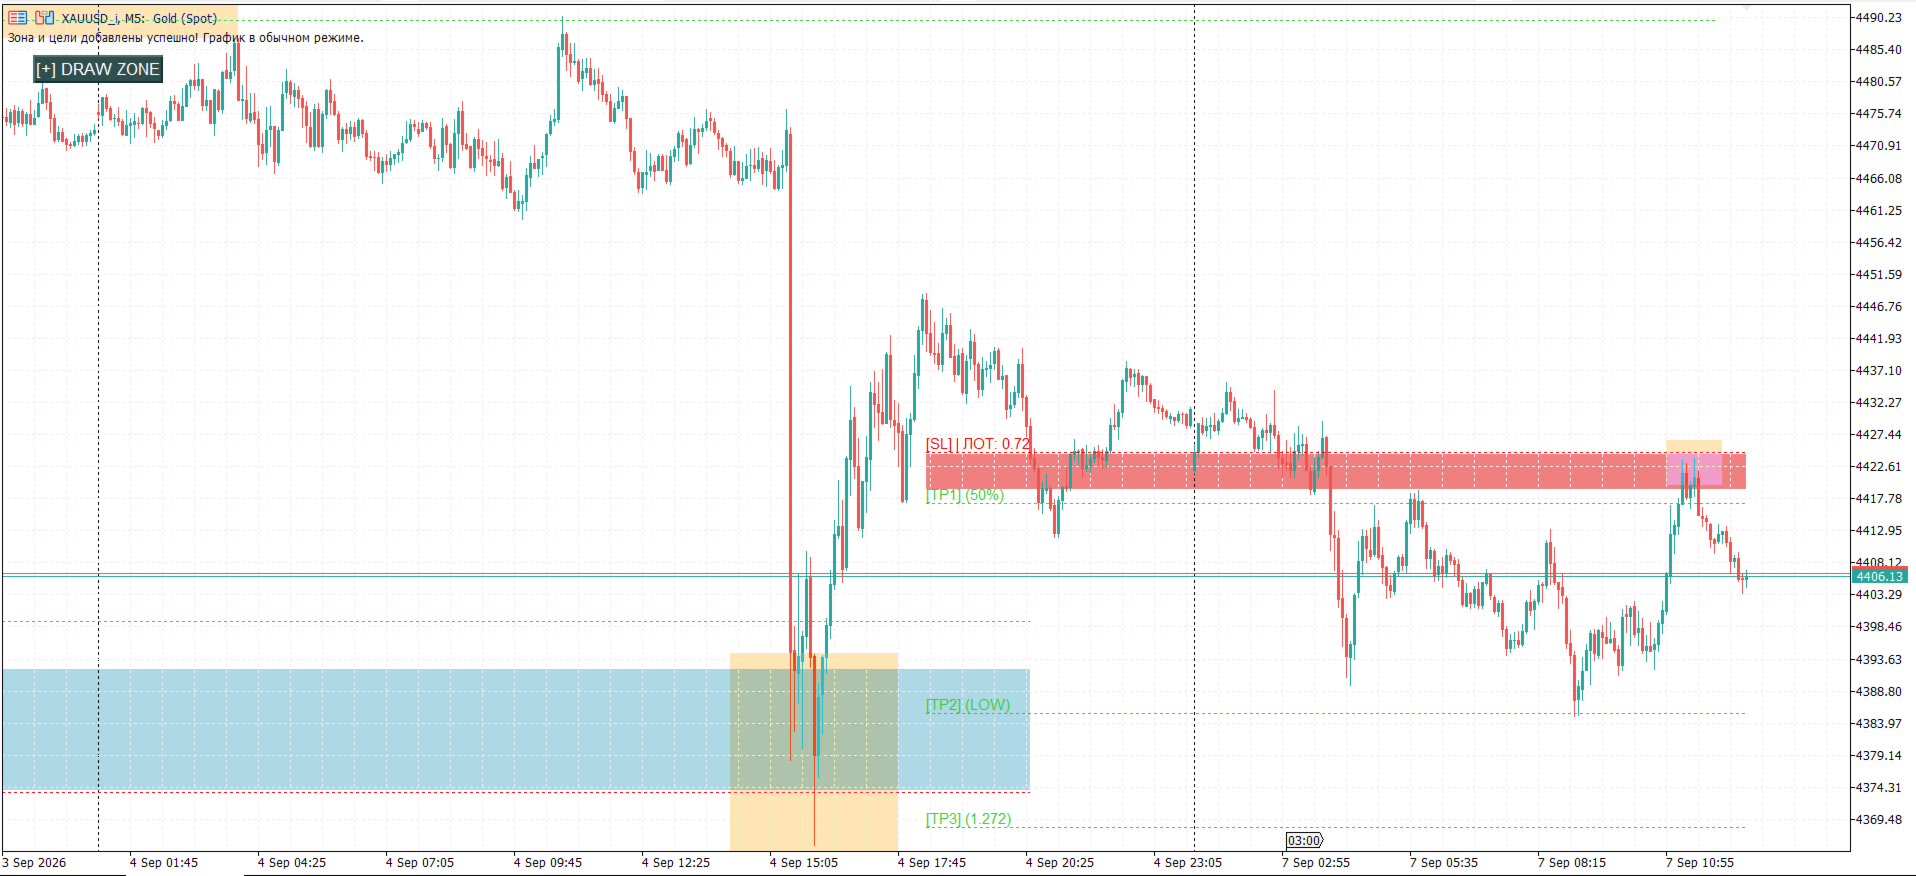
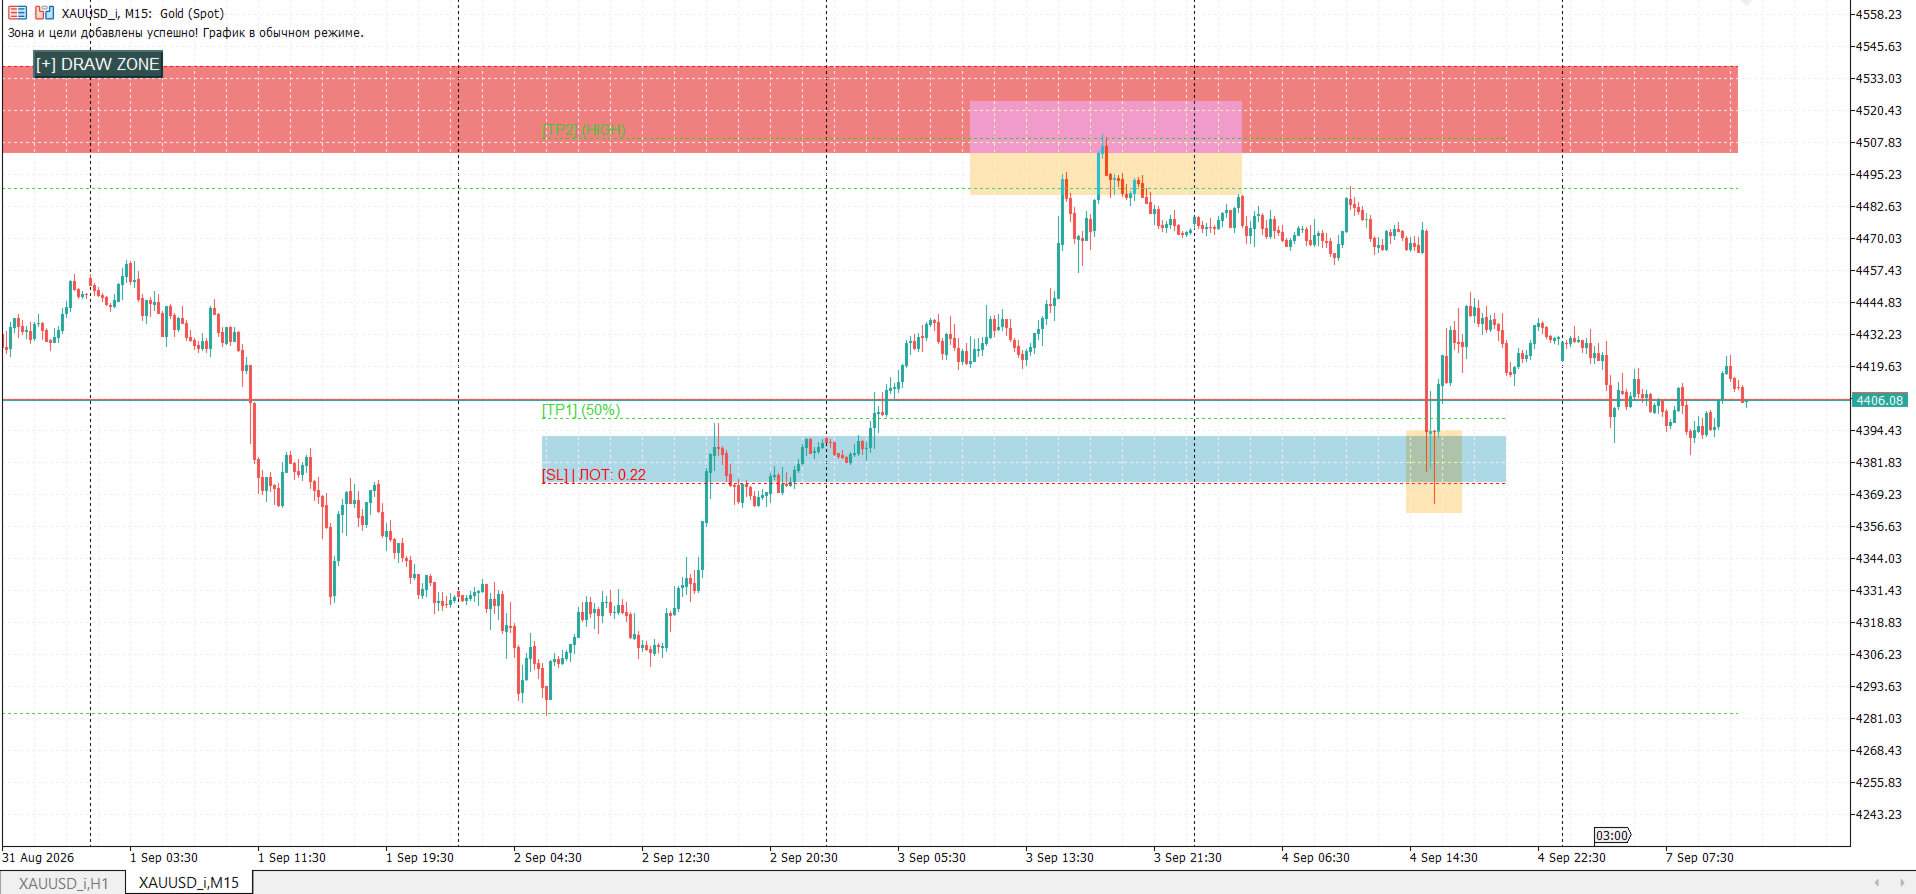
• Ready-made trading plan (TP1, TP2, TP3, SL): When a zone is created, the indicator instantly draws target levels.
o [SL] — beyond level 2.6 (break of structure).
o [TP1] — 50% of the wave range (partial fixation).
o [TP2] — test of the opposite extremum (High/Low of the wave).
o [TP3] — a mathematical extension of the 1.272 trend.
• Ideal interface separation: in normal mode (when the button is released), the indicator is completely “dormant”. You can calmly draw your trend lines, Fibonacci levels, select and delete any shapes — the indicator won’t create false zones and won’t interfere with the analysis.
• Smart timer‑based cleaner: you no longer need to manually delete dozens of accompanying lines. Simply delete the rectangle of the zone (with the Delete key), and the built-in timer will completely erase all associated TP/SL levels and text signatures from the graph in 300 ms.
Inputs
• The color of the purchase zone (Buy Zone Color) — the choice of color for the rectangle of purchases.
• Sell Zone Color — select the color for the sales rectangle.
• The length of the forward zone (Zone Bars Length) is the number of bars by which the rectangle and targets extend to the right.
• Fill Zones — enables/disables transparent filling.
• The color of the Take Profit lines (TP Color) is the color of the profit—taking levels.
• The color of the Stop Loss line (SL Color) is the color of the loss limit line.
• Font Size of captions (Font Size) — the scale of the target text on the screen.
• Transaction risk as a percentage of the balance (Risk Percent) is the percentage of the deposit that is included in the lot calculation formula.
• Horizontal/vertical offset (Button X / Button Y) — precise adjustment of the control button’s position on the screen so that it does not overlap the terminal text.