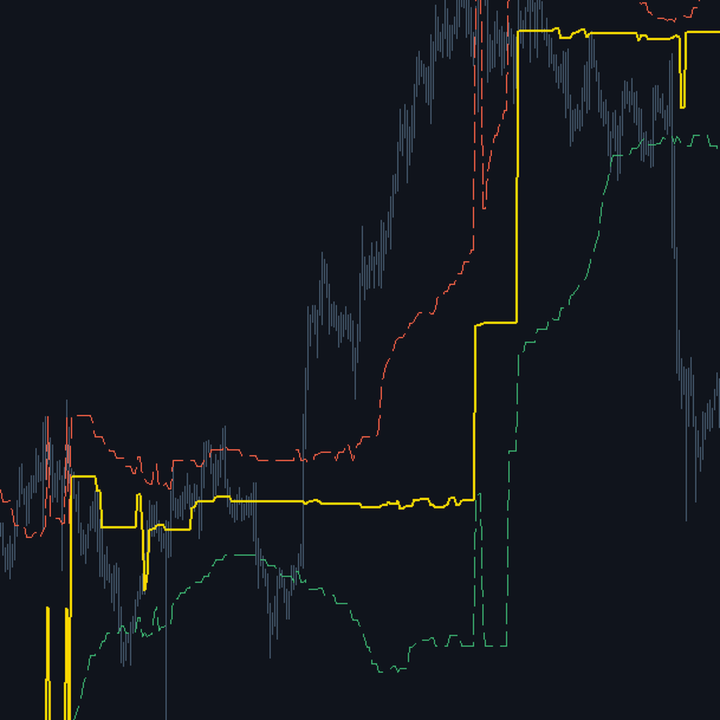
Volume Weighted Range Profile
- 지표
- 버전: 1.0
- 활성화: 5

# Volume Weighted Range Profile - Rolling window profile
*Category: Volume | Difficulty: advanced | Window: chart window (overlaid on price) | Markets: Universal (Forex, indices, commodities, crypto, stocks) | Suggested timeframes: M15, M30, H1, H4, D1*
## Short description
> Builds a volume profile on a rolling window and extracts the point of control and value area. Unlike session profiles, it does not reshape itself during the day.
### Overview
The volume profile identifies the levels where the market traded most, which are also the ones it tends to return to. This implementation extracts the three values that matter: the point of control, the band that gathered the most volume, and the two edges of the value area containing the configured share of total volume. The difference from session anchored profiles is substantial: those update during the day and reshape before your eyes, making an honest historical assessment impossible. This profile instead rolls over a fixed window of already closed bars: the levels shift bar by bar but no value printed in the past is ever rewritten. Each bar volume is distributed uniformly across the price bands it crosses, the standard approximation in the absence of per level volume data.
### How the calculation works
1. The window extremes define the profile scale, split into InpBins bands of equal width.
2. Each bar volume is split equally among all bands the bar crosses, from low to high.
3. The point of control is the band with the highest accumulated volume.
4. The value area is built starting from the point of control and adding, at each step, the richer adjacent band.
5. The expansion stops when the gathered volume reaches the InpValueAreaPct share of the total: the classic market profile method.
6. Band indices are converted into prices using the band centre as representative value.
### How to use it
- The point of control acts as an attractor: when price moves far from it, it tends to return, especially in sideways phases.
- The value area edges are natural reaction levels, because they bound the zone where the market considers price fair.
- Price leaving the value area and not returning signals the market is redefining where value lies.
- Raise InpBins for a more detailed profile, knowing that with too many bands the point of control becomes unstable.
- Use wide windows on low timeframes and shorter ones on high timeframes, to keep the covered time horizon constant.
### Who it is for and on which timeframes
It targets traders familiar with volume profile analysis who want a version usable on a rolling window rather than anchored to a session. It works from M15 to D1. It is the most computationally demanding of the group, because it rebuilds the entire profile on every bar: on very long histories the first pass takes a few seconds. Anyone unfamiliar with the point of control and value area concepts should study them first, otherwise the three drawn levels will look arbitrary.
### Practical example of reading a signal
On EURUSD H1 the point of control sits at 1.0850 and the value area runs from 1.0820 to 1.0885. Price rises to 1.0910, leaving the value area. This is not yet a signal: the market may be redefining value upwards. Over the next six hours price fails to build volume above 1.0900 and re-enters the area. The re-entry from outside is the operational moment: statistically price tends to traverse the value area to the opposite edge, and the natural target becomes 1.0820, with a stop above the high of the failed excursion.
## Input parameters
| Parameter | Default | Description |
|---|---|---|
| `InpWindow` | 120 | Bars of the profile window. It defines how much history contributes to level formation. Internally capped at 1000. |
| `InpBins` | 60 | Number of bands the price range is split into. More bands give a detailed profile but a less stable point of control. |
| `InpValueAreaPct` | 70.0 | Share of total volume contained in the value area. The value 70 is the classic market profile convention. |
| `InpUseRealVolume` | false | With true, real volume is used when available; with false, or in its absence, tick volume. |
## Advantages / strengths
- No repaint, a rare feature among profile indicators, which typically reshape during the session.
- It provides three levels with a precise and recognised meaning, not generic supports and resistances.
- The rolling window allows applying it on any timeframe, even where the session concept makes no sense.
- The value area construction algorithm follows the classic method, not a simplified approximation.
## Limitations and warnings
- Rebuilding the entire profile on every bar is computationally heavy: the first pass on long histories is not immediate.
- The uniform distribution of volume across bands is an approximation: real volume does not distribute uniformly inside a bar.
- The point of control can jump abruptly between bands when two of them hold almost identical volumes.
- The rolling window loses the session notion, which for some traders is an essential part of profile analysis.
**No repaint:** values printed on a closed bar are never modified afterwards.
**Disclaimer.** This product is a technical analysis tool, not an automated trading system, and it offers no profit guarantee whatsoever. Financial markets carry the risk of total loss of the invested capital. Past performance is not indicative of future results. Every signal must be confirmed with your own analysis, a money management plan and prior testing on a demo account. The author is not responsible for trading decisions taken on the basis of this indicator.
## Suggested tags / keywords for MQL5
`volume profile`, `point of control`, `value area`, `market profile`, `levels`, `support resistance`, `no repaint`, `rolling`