FiboPlusTrend
- 지표
-
Sergey Malysh
 Professional knowledge and experience:
- Programmer.
- Forex Trader
- Chief Accountant.
- Chief Financial Officer.
- CEO. - 버전: 3.1
- 업데이트됨: 14 11월 2020
- 활성화: 7
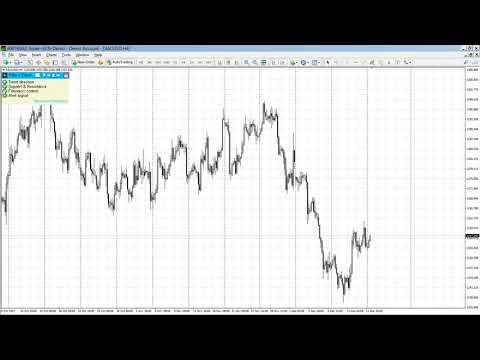
A ready-made trading system based on automatic construction and maintenance of Fibonacci levels for buying and selling on any instrument (symbol) and on any period of the chart. Determination of trend direction (14 indicators). The display of the trend strength and the values of the indicators that make up the direction of the trend. Construction of horizontal levels, support and resistance lines, channels. Choosing a variant for calculating Fibonacci levels (six different methods). Alert system (on screen, E-Mail, Push notifications).
Buttons
- Color scheme switching button.
- Arrow buttons. Moving menu to any random point on a chart.
- "Trend direction". Calculation of trend direction on each timeframe. Indicators are used (RSI, Stochastic, MACD, ADX, BearsPower, BullsPower, AO, WPR, MA - 5, 10, 20, 50, 100, 200).
- "The name of the timeframe M1, M5, ... "- pressing will show the value of the indicators on this timeframe.
- "Value Trend direction". The values of the indicators that make up the trend direction from the previously chosen timeframe (the default is the current timeframe)
- "Support & Resistance".
- "Horizontal line" Building horizontal levels (fractals and RSI)
- "Trend line" Building support and resistance trend lines (RSI)
- "SUP" support
- "RES" resistance
- "Chanel" Channeling
- "SUP" support
- "RES" resistance
- "Fibonacci control"
- "Сhange Fibonacci" choice of the option for calculating the Fibonacci levels for buying and selling between 6 different calculations (Best, Standard, debt of flow, Impulse, Zig_Zag, RSI)
- "Auto" by calculated trend
- "Flat" buying and selling
- "Up" only buying
- "Down" only selling
- View the algorithms (Change Fibonacci) of other variants:
- |< first
- < previous
- > next
- >| last
- "Alert signal ". Current trading signals.
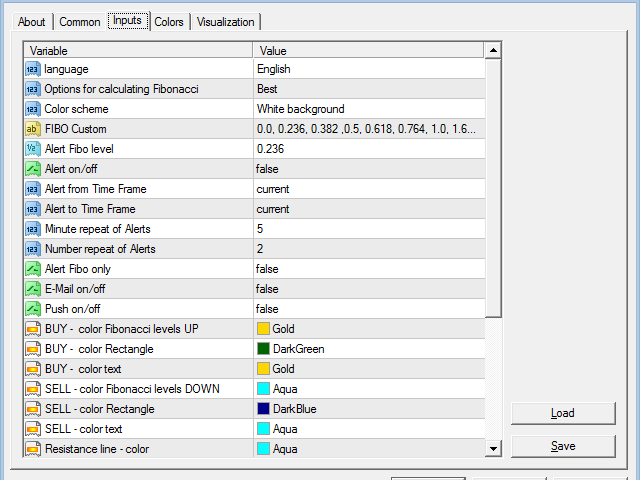
Parameters:
- Language (Russian, English, Deutsch, Espanol, Portugues)
- Fibo level options:
- Best - use same-color candles till the candle of an opposite color appears
- Standard - standard application
- debt of flow - dept flow of the Market Maker, obtained during the activation of strong market distortions
- Impulse based on the indicator Awesome Oscillator
- Zig_Zag based on the indicator Zig_Zag
- RSI based on the indicator Relative Strength Index
- Color scheme - Color scheme (preset colors):
- White background - for white background
- Black background - for black background
- Custom background - custom settings of all colors..
- FIBO Custom (level values separated by «,»)
- User Fibo level Alert - Custom Fibonacci level for alerts
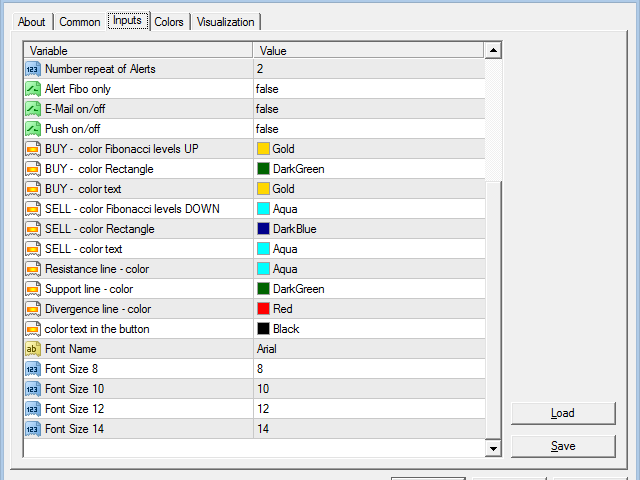
- Alert on/off - Alerts (enable/disable)
- Alert from Time Frame, Alert to Time Frame - Timeframes for alerts
- Minute repeat of Alerts - Number of minutes between alert repetitions
- Number repeat of Alerts - The number of alert repetitions
- Alert Fibo only - Alerts only by Fibonacci retracement
- E-Mail on/off - Send alerts to E-Mail
- Push on/off - Send alerts via Push notifications
- custom color settings:
- BUY - color Fibonacci levels UP, BUY - color of Rectangle, BUY - color of text,
- SELL - color Fibonacci levels DOWN, SELL - color of Rectangle, SELL - color of text,
- Resistance line - color, Support line - color,
- Divergence line - color, color text in the button
- Setting and font size
- Font Name - font name
- Font Size 8, 10, 12, 14 - font size
FiboPlusTrend based trading system
- Sell. Candle closes below level 100, stop loss exceeds 76.4, take profit minimum 161.8, take profit 1 - 261.8, take profit 2 - 423.6.
- Buy. Candle closes above level 100, stop loss is below level 76.4, take profit minimum 161.8, take profit 1 - 261.8, take profit 2 - 423.6.
- Buy/Sell in a rectangle area limited by level 0-100. Trading is performed from one level to another (no trend).
- Earlier entry into the market. Log on to the next candle, after the formation of a new Fibonacci retracement stop loss -23.6 (minus 23.6) or beyond the horizontal level.
- The "debt of flow" option. FiboPlusTrend plots the "debt of flow" levels of the Market Maker, the price has a high probability to return to these levels.
Trading from the level 100 to take profit 1 - 50, take profit 2 - 33. The second option is to place limit orders at the levels of 50% and 33% following the trend.
Well done Sergey, best Fibo Indicator on the Market, well presented and for the price you will not find a better solution for your trading