ArgosWatch Prop Consistency Guard

  • 지표
  • Antonios Kokkalis
    Antonios Kokkalis
    • MQL5 and NinjaScript Systems Developer 에  ArgosWatch
    • 스웨덴
    • 895
    Trader and systems developer. 12 years on MT4, MT5, and NinjaTrader 8.
    PUBLISHED WORK
    MQL5 Market — ArgosWatch Institutional Prop Suite:
    - Prop Challenge Guardian MT5-Daily and maximum drawdown barrier with on-chart SOS danger line and instant lot matrix
  • 버전: 1.23
  • 업데이트됨: 25 8월 2026

────────────────────────────────────────────────────────────────

Consistency Guard MT5 — your best trading day, and your best single

trade, as a share of total profit, against the cap you set.


Drawdown is visible: equity moves and the platform shows it moving.

Consistency is a property of the distribution of results across a whole

evaluation, and MetaTrader computes nothing of the kind.


THE ARITHMETIC


    best day    = largest single trading day's net realised result

    best trade  = largest single closing deal's net result

    total       = net realised result since the challenge start


    day ratio   = best day   / total x 100

    trade ratio = best trade / total x 100


Both are computed. Which one is gated is an input: best day, best trade,

or both - and "both" gates on whichever of the two is higher, because

that is the one that fails you.


Net means net. Profit, commission, fee and swap are all included. Fee is

a separate field from commission and some brokers charge there instead,

so a tool that reads only commission understates the cost of every trade

on those accounts.


Commission charged at entry is counted in the day it was charged. The

money left the account that day and belongs in that day's total.


Deposits, withdrawals, credits and corrections are also deals in the

history. They are excluded by deal type - counted as profit, a deposit

becomes the best day of the evaluation on its own.


Trades closed against an opposing position carry DEAL_ENTRY_OUT_BY rather

than DEAL_ENTRY_OUT. They are included in the best-trade comparison. On an

account that never uses close-by this changes nothing; on one that does,

whole trades would otherwise be invisible.


THE DAY BOUNDARY IS AN INPUT


Firms do not agree on when a trading day starts. Some use the broker

server's midnight, some a fixed hour. If this tool buckets from one

boundary and your firm audits from another, a trade closed in between

falls in a different day in each calculation and the two answers never

reconcile.


The reset hour is yours to set. Keep it identical to whatever your

drawdown monitor uses, or the two tools will disagree with each other as

well.


THE FIRST DAY READS 100% AND IT IS NOT A BREACH


On the first trading day, that day is the entire history. Best day equals

total profit and the ratio is exactly 100% the moment the day closes

positive:


    500 / 500 x 100 = 100.0%


Below two trading days no ratio is shown at all. Not a red 100% - the

field reads "-- / 30.0%", the status reads COLLECTING DATA, and the panel

says which it is: "No closed trades yet", or "Only 1 trading day so far.

Needs 2+ days before a consistency picture makes sense." The realised

result so far is shown instead, because that part is real.


No alert can fire below two days either.


Two days is the minimum for the ratio to be defined. It is not the

minimum for it to be stable, so the number of trading days is printed

next to it and the start date with it.


THE CHALLENGE START


Detected as the earliest deal in the account's history, or set by hand -

which is what you need after a phase reset, when the history still holds

the previous phase and you are being judged only on this one.


CORRELATED CURRENCY EXPOSURE


Long EURUSD, long GBPUSD and long AUDUSD is not three positions. It is

one short-USD position of three lots wearing three names.


Every open position is split into its base and quote currency, a buy

counting positive on the base and negative on the quote, and the lots are

netted per currency. What you see is your directional exposure to each

currency, with the number of positions producing it, against a cap in

lots that you set.


This covers instruments named as two three-letter currency codes. Broker

suffixes are fine - EURUSD.m works. Indices, most CFDs and anything that

does not split into two valid codes are left out of the exposure netting

rather than force-fitted into it, and still appear in the position table.


OPEN POSITIONS


Listed by how much they are moving the account, largest absolute result

first. Which position is dominating, at a glance.


ALERTS


Two watches - the consistency ratio, and the worst currency exposure -

each at a warning share of its cap and again at the cap itself.


An alert fires when the level rises, not while it sits there. Crossing

into warning rings once; staying in warning is silent. Popup, sound, push

and email are separate switches.


THE PANEL


Three sizes, and a button that collapses it to its title bar when the

chart is wanted back. X and Y offsets move it clear of the price. The

exposure section and the position table can each be switched off, and

every colour is an input.


WHAT IT CANNOT TELL YOU


The ratio is a lagging measurement of a distribution, not a live risk

gauge. Unlike drawdown, where the next tick can breach a limit,

consistency moves only when a day closes. A figure sitting at twenty

percent today can be past forty by tomorrow evening. It tells you where

you have been, and it constrains what you can safely do next. It does not

warn you in the moment.


The thresholds are not the tool's to assume. The share, what counts in

the denominator, whether the test applies to days or trades or both, the

daily boundary, and whether the rule is checked continuously or only at

payout - all of these vary by firm and change over time. Every one is an

input for exactly that reason. A tool that measures the wrong rule

correctly is worse than no tool, because it is believed.


It places no orders and modifies no positions.


REQUIREMENTS


MetaTrader 5. Currency netting expects standard FX naming; everything

else is monitored for consistency and shown in the position table.


────────────────────────────────────────────────────────────────

PART OF THE ARGOSWATCH SERIES

Free: Smart Session Breakout MT5 / MT4 - the session range on your chart ArgosWatch Drawdown Meter MT5 - live daily loss and maximum drawdown ArgosWatch Prop News and Volatility Guard MT5 - news windows, spread Full tools: ArgosWatch Session Range Breakout Scanner - 24 symbols, ranked ArgosWatch Prop Consistency Guard - the rule that fails passed challenges Prop Challenge Guardian MT5 - risk barrier and lot matrix

────────────────────────────────────────────────────────────────

추천 제품
Haven Volume Profile
Maksim Tarutin
4.64 (14)
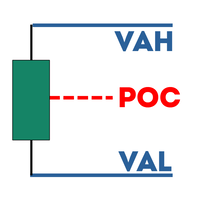
Haven Volume Profile은 거래량 분포를 기반으로 중요한 가격 수준을 식별하는 데 도움이 되는 다기능 볼륨 프로파일 분석 지표입니다. 시장을 더 잘 이해하고 중요한 진입 및 퇴장 지점을 식별하려는 전문 트레이더를 위해 설계되었습니다. 기타 제품 ->  여기 주요 기능: Point of Control (POC) 계산 - 최대 거래 활동 수준으로, 가장 유동성이 높은 수준을 식별하는 데 도움이 됩니다 Value Area 정의 (높은 활동 영역) 및 사용자 지정 가능한 거래량 비율로 거래 범위를 보다 정확하게 평가할 수 있습니다 틱 거래량과 실제 거래량 모두 지원, 다양한 시장 유형과 거래 전략에 적합 계산 기간(일 수)의 유연한 설정으로 모든 시간 프레임에 도구를 적용할 수 있습니다 터미널의 밝은 테마와 어두운 테마에 자동 적응하여 사용자 인터페이스의 시각적 경험을 향상시킵니다 레벨 시각화가 명확하고 스타일과 색상을 사용자 지정할 수 있어 빠른 의사 결정을 돕습니다 이 지표
FREE
Mirror Chart MT5
Andrej Hermann
5 (1)
The Mirror Chart MT5 is a overlay indicator specifically designed to project a second financial instrument directly onto the main chart window. This tool is invaluable for traders who rely on correlation analysis, as it visualizes the price movements of two different instruments in real time. Unlike traditional overlays, this indicator utilizes intelligent, dynamic centering and scaling logic. It continuously analyzes the visible price range in the current window for both symbols and calculates
FREE
Volume profile CVD Frato
Francisco Felipe Alves Da Silva Rocha
5 (2)
Frato Volume Profile Pro v7.5 Frato Academy 개발 이 지표는 MetaTrader 5용 가격-거래량 프로필을 표시합니다. 설정 가능한 기간 동안 가격 레벨별 거래량 분포를 계산하고 결과를 메인 차트에 직접 표시합니다. 주요 기능: 색상 그라데이션을 사용한 거래량 프로필 이 지표는 가격 범위를 레벨로 나누고 각 레벨에 해당하는 거래량을 할당합니다. 각 레벨의 색상은 거래량에 따라 연속적인 그라데이션으로 변합니다. 낮은 거래량 레벨은 차가운 색조(진한 파란색)를, 높은 거래량 레벨은 따뜻한 색조(노란색)를 나타냅니다. 최고 거래량 레벨인 POC(Point of Control)는 시각적으로 강조 표시됩니다. 참조선: POC, VAH, VAL 이 지표는 자동으로 세 개의 수평선을 그립니다. - POC(Point of Control): 최고 거래량 레벨 - VAH(Value Area High): 가치 영역의 상한선 - VAL(Value Area Low
FREE
AvgVolumes
Marco Montemari
5 (1)
This indicator is based on Volumes standard indicator, calculates the average of Volumes based on the last N bars set by users, and if the value of the volume is bigger then a set % respect the average a different color will be used. The indicator is shown in a separate indicator window. This version has now a limitation in setting the % about the threshold. If you are interested to set threshold consider to buy the PRO version ( https://www.mql5.com/en/market/product/35925 ) If you want to use
FREE
BoxInside MT5
Evgeny Shevtsov
5 (4)
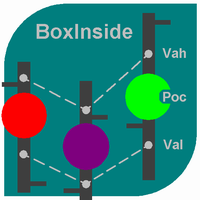
This indicator calculates the volume profile and places labels that correspond to the VAH, VAL and POC levels, for each candle individually. Indicator operation features The indicator works on the timeframes from M3 to MN, but it uses the history data of smaller periods: M1 - for periods from M3 to H1, M5 - for periods from H2 to H12, M30 - for the D1 period, H4 - for the W1 period, D1 - for the MN period. The color and location of the VAL, VAH and POC labels on the current candle are considere
FREE
MelloVWAP draws VWAP and volume profile on the chart from one indicator. Values on closed bars never change, so what you see in history is what you would have seen live. It needs no DLL and no external service. VWAP - Session, weekly and monthly VWAP - Anchored VWAP: drag the vertical line to any bar and the line recalculates - Two deviation bands on the session VWAP - Session start can be shifted from server midnight - Session VWAP is hidden on D1 and above, where it has no meaning Volume pro
FREE
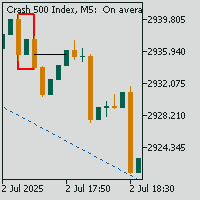
Here   our more valuable tools SMC Trend Trading   ,  Easy SMC Trading  ,  Institutional SMC Architect Volume Analysis Tools  ,  Volume flow Profile  ,  Market volume profile  , FVG with Volume  , Liquidity Heatmap Profile  ,  Volume Spread Analysis A professional spike pattern indicator built for synthetic traders who scalp and swing Crash 500/300/1000 with precision.  This indicator: Detects powerful 3-candle spike formations (Spike → Pullback → Spike) Automatically draws a clean box a
FREE
Market Profile 3 ForexArby com
Hussien Abdeltwab Hussien Ryad
4 (15)
Market Profile 3 MetaTrader 5 indicator  version 4.70— is a classic Market Profile implementation that can show the price density over time, outlining the most important price levels, value area, and control value of a given trading session. This indicator can be attached to timeframes between M1 and D1 and will show the Market Profile for daily, weekly, monthly, or even intraday sessions. Lower timeframes offer higher precision. Higher timeframes are recommended for better visibility. It is als
FREE
Gold Max pro
Israr Hussain Shah
4 (1)
Here   our more valuable tools SMC Trend Trading   ,  Easy SMC Trading  ,  Institutional SMC Architect Volume Analysis Tools  ,  Volume flow Profile  ,  Market volume profile  , FVG with Volume  , Liquidity Heatmap Profile  ,  Volume Spread Analysis Automatic Professional Theme:   Instantly applies a high-contrast "Color on White" theme with DeepSkyBlue bull candles and Black bear candles for maximum clarity. Interactive Timeframe Panel:   21 vertical buttons on the left side allow for one-clic
FREE
MicroScalper Timer
Gustavo Adolfo Ramirez
MicroScalper Timer is a premium, institutional-grade candle countdown utility designed for scalpers, day traders, and Prop Firm funded traders who demand absolute precision. Unlike standard timers that freeze when market volatility drops, this indicator is entirely independent of market ticks . Powered by an advanced OnTimer() engine, it updates flawlessly every real second, ensuring you know exactly when the next candle opens. What makes it truly unique is its built-in catalog of 10 Boutique Wa
BBMA with EMA50
Teeraporn Satitman
This indicator consist of Standard BBMA Standard signal Sign on chart added EMA50 Behavior Tracking: The chart background changes color based on the EMA50 (default is black) and shifts to white when a breakout of the Bollinger Bands occurs. Three Engulfing Color Change: Automatically adjusts colors to help you easily determine market zones. default yellow/white High-Low Line Sign: Highlights the potential trading range and key price levels for better visual  MHV
FREE
LM Volume Profile MT5 LM Volume Profile MT5 displays the distribution of calculated volume across price levels directly on the MetaTrader 5 chart. The indicator divides the selected price range into configurable price rows and displays the volume distribution as a horizontal histogram. It also calculates the Point of Control, Value Area High, Value Area Low, average profile price, and optional VWAP reference. Four profile modes are available: - Visible Range - Fixed Range - Session - Daily
FREE
Order Book, known also as Market Book, market depth, Level 2, - is a dynamically updated table with current volumes of orders to buy and to sell specific financial instument at price levels near Bid and Ask. MetaTrader 5 provides the means for receiving market book from your broker, but in real time only, without access to its history. The indicator OrderBook Cumulative Indicator accumulates market book data online and visualizes them on the chart. In addition, the indicator can show the market
The Horizontal Ray Tool is a lightweight, professional charting utility designed to streamline support and resistance mapping on MetaTrader 5. It brings rapid, one-click horizontal level placement directly to your live chart, eliminating the workspace clutter associated with infinite horizontal lines or manually drawn trendlines. Key Features: Interactive On-Screen Button: Spawns a clean, responsive "DRAW RAY" button docked directly on your chart canvas. A single click drops an independent hor
FREE
VP hidden
Emr Aljnaby
4.33 (12)
The indicator works to convert normal volume into levels and determine financial liquidity control points. It is very similar in function to Fixed Volume Profile. But it is considered more accurate and easier to use than the one found on Trading View because it calculates the full trading volumes in each candle and in all the brokers present in MetaTrade, unlike what is found in Trading View, as it only measures the broker’s displayed prices. To follow us on social media platforms: telegram
FREE
RM Volume Profile
Roberto Mazzardi
RM Volume Profile은 차트에 완전한 볼륨 프로파일과 마켓 프로파일(TPO)을 그려 줍니다. 거래 세션마다 하나의 프로파일을 표시하므로, 실제 거래가 집중된 구간과 POC(컨트롤 포인트)가 매일 어떻게 이동하는지 볼 수 있습니다. 각 세션은 POC와 밸류 에어리어(VAH/VAL), 그리고 선택적 볼륨 히스토그램을 표시합니다. 이전 세션 여러 개를 함께 표시해 POC 이동을 추적하고, 시장이 가격을 수용했는지 거부했는지 파악하세요. 주요 기능 - 볼륨 프로파일과 마켓 프로파일(TPO)을 하나의 지표에 — 한 번의 클릭으로 전환. - 세션 시작을 설정 가능: 뉴욕 종가(17:00), 브로커 자정, 유럽 자정, 또는 실제 거래소 개장(아시아/도쿄, 런던, 미국/NYSE, 미국 프리마켓). 서머타임은 내부에서 처리. - 이전 세션 여러 개를 나란히 표시해 POC 이동을 관찰. - POC, 밸류 에어리어(VAH/VAL), 밸류 에어리어 %는 설정 가능. - 발전 중 POC:
FREE
This indicator will mirror the assets in use in another metatrader, being able to choose the timeframe and a template. This is the Metatrader 5 Client, it needs the Metatrader 4 or 5 Server versions: Metatrader 4 Mirror Chart Server:   https://www.mql5.com/en/market/product/88644 Metatrader 5 Mirror Chart Server: https://www.mql5.com/en/market/product/88652 Details of how it works in the video.
FREE
Session Profiles
Basharat Umar Khan
5 (1)
Short Description Draws rolling Time-Price-Opportunity (TPO) and footprint volume profiles for the Asia, London, and New York sessions with POC/VAH/VAL levels, delta volume bias, order flow overlays, liquidity heatmaps, developing rolling lines, Naked POC (NPOC) tracking, Initial Balance breakouts, multi-session confluence zones, and automatic broker GMT-offset detection. Full Description Plots separate market-profile and volume-profile style histograms for the three major trading sessions (Asi
FREE
StopLoss Monitor
Jayesh Ashok Rode
In trading, capital protection is everything. A single trade without a Stop Loss can wipe out profits, breach a funded account, or cause unnecessary emotional and financial damage within seconds. Even experienced traders can forget to place an SL during volatile market conditions or while managing multiple trades simultaneously. Since many Prop Firms enforce strict mandatory Stop Loss rules, one missing SL can instantly violate account conditions regardless of position size. STOP LOSS MONITOR is
FREE
DBS Time
Dmitriy Burlachenko
5 (3)
A small utility displays the time in five time zones. You can customize the display of one to five time zones. For each time it is configured: show or not; name; time offset from GMT; color; In general settings, you can change: date / time format ("hh: mi", "hh: mi: ss", "yyyy.mm.dd hh: mi", "yyyy.mm.dd hh: mi: ss") font name; font size; offset from the left edge of the chart; offset from the top edge of the chart;
FREE
Pips Hunter PRO MT5
Rodrigo Arana Garcia
5 (2)
핍스 헌터 프로는 수년에 걸쳐 개발되었으며 이전 버전보다 개선된 버전입니다. 이 강력한 지표는 시장과 가격 이력을 분석하여 매수 및 매도 항목을 생성합니다. 이러한 항목의 계산을 위해 함께 작동하는 다양한 지표와 덜 유리한 항목을 필터링하고 제거하는 복잡한 통계 로그를 사용합니다 /   MT4 버전 . 특징 다시 칠하지 않음 이 인디케이터는 새 데이터가 도착해도 값이 변경되지 않습니다 지연 없음  이 표시기는 지연되지 않습니다 거래 쌍 모든 외환 쌍  (가급적 EURGBP) 타임프레임  모든 차트주기 매개변수 ===== 표시 ===== 화살표 거리 // 신호(화살표)와 캔들스틱 사이의 거리 ===== 알림 ===== 팝업 알림 // MT4 터미널용 알림 푸시 알림 알림 // 휴대폰용 알림 이메일 알림 // 이메일 알림 ===== 차트 설정 ===== 차트에서 캔들 스틱의 색상을 변경하는 옵션 경고 저는 MQL5.com에서만 제품을 판매합니다. 누군가
FREE
Deriv Synthetic HTF Candle Projection GMT2 Higher Timeframe Candle Projection & Previous Levels Tool for Deriv Synthetic Indices (MT5) Overview Deriv Synthetic HTF Candle Projection GMT2 is a professional MetaTrader 5 indicator built specifically for Deriv Synthetic indices . It projects the current forming Higher Timeframe (HTF) candle onto the chart and automatically draws key reference levels from previous candles. This indicator is designed to help traders maintain higher timeframe context
FREE
AI Relative Volume Indicator
Fadi Hassan Khaled Ghanem
각 봉의 틱 거래량을 조회 기간 평균으로 나눈 값입니다. 스파이크 레벨을 넘는 봉은 강조 표시되어 비정상적인 활동을 보여줍니다. 주요 기능 마감된 봉에서 계산되며, 값이 리페인트되지 않음 모든 심볼과 타임프레임에서 작동 모든 기간, 레벨, 색상을 입력값에서 변경 가능 최대 봉 수 설정으로 가벼운 리소스 사용 자체 Expert Advisor에서 사용할 수 있는 버퍼(iCustom) 버퍼 0 상대 거래량, 1 색상(0 보통, 1 높음, 2 스파이크). 입력값 상대 거래량: 평균 기간, 높은 활동 레벨, 스파이크 레벨. 표시: 계산할 최대 봉 수. 참고 이 제품은 분석 도구입니다. 거래를 실행하지 않습니다. 본인의 전략에 맞게 이 도구를 맞춤 제작하거나, 필터와 알림이 추가된 고급 버전이 필요하신가요? MQL5에서 개인 메시지를 보내 주시면 견적을 회신해 드리겠습니다. 먼저 데모 계좌에서 충분히 테스트해 보시기를 권장합니다.
FREE
Value Chart Candlesticks
Flavio Javier Jarabeck
4.57 (14)
The idea of a Value Chart indicator was presented in the very good book I read back in 2020 , " Dynamic Trading Indicators: Winning with Value Charts and Price Action Profile ", from the authors Mark Helweg and David Stendahl. The idea is simple and the result is pure genius: Present candlestick Price analysis in a detrended way! HOW TO READ THIS INDICATOR Look for Overbought and Oversold levels. Of course, you will need to test the settings a lot to find the "correct" one for your approach. It
FREE
Ospe POC Volume Profile
Nur Azureen Binti Ab Aziz
A volume-at-price heatmap with POC, value area, estimated buy/sell pressure, confirmed signals and alerts. POC Volume Profile Heatmap is a MetaTrader 5 indicator that organizes historical volume across price levels. It identifies the Point of Control, displays the selected value area, and estimates buying and selling pressure at the POC. The indicator is intended for traders who use volume-at-price structure to study acceptance, rejection and interaction around high-activity price levels. It c
FREE
JT360 DNA Mini PnL Pointer V1.04 Public 컴팩트하게. 명확하게. 언제나 한눈에. JT360 DNA Mini PnL Pointer는 MetaTrader 5용 경량 지표로, 현재 차트 심볼에서 열려 있는 모든 포지션의 합산 실시간 손익(PnL)을 표시합니다. 컴팩트한 차트 표시 방식으로 R 단위의 위험 대비 손익, 슬림한 미니 바, 사용자 설정이 가능한 색상 매트릭스를 제공합니다. JT360의 시그니처 컬러인 터키석과 마젠타는 극단적인 손익 구간을 강조하여 수익과 손실 수준을 빠르게 파악할 수 있도록 도와줍니다. 주요 기능 동일 심볼의 여러 열린 포지션에 대한 합산 PnL R 단위의 위험 대비 손익 표시 PnL 값 옆에 표시되는 컴팩트 미니 바 7단계로 구성된 사용자 설정 가능 위험 색상 매트릭스 JT360 DNA PBO Fusion Template 없이 독립적으로 사용 가능 차트를 깔끔하게 유지하면서 거래 성과를 빠르게 확인할 수 있도록 설계된 작고 실용
FREE
Enhanced Volume Profile: The Ultimate Order Flow & Liquidity Analysis Tool Overview Enhanced Volume Profile is an indicator for MetaTrader 5 that displays the traded volume at specific price levels over a defined period. It separates the total volume into buy and sell components, presenting them as a side-by-side histogram on the chart. This allows users to observe the volume distribution and the proportion of buy and sell volumes at each price level. Graphics Rendering The indicator uses the
FREE
Aggression Volume
Flavio Javier Jarabeck
4.29 (17)
Aggression Volume Indicator is the kind of indicator that is rarely found in the MQL5 community because it is not based on the standard Volume data provided by the Metatrader 5 platform. It requires the scrutiny of all traffic Ticks requested on the platform... That said, Aggression Volume indicator requests all Tick Data from your Broker and processes it to build a very special version of a Volume Indicator, where Buyers and Sellers aggressions are plotted in a form of Histogram. Additionally,
FREE
Orange Indicator by Quant Atlas Creator:  https://www.quant-atlas.com/ Orange Indicator is a clean reversal focused indicator for MetaTrader 5, designed to highlight potential turning points directly on the chart using simple orange buy and sell markers. The indicator focuses on moments where price may be transitioning out of short term exhaustion and into a possible reaction phase. When a bullish setup appears, an orange upward triangle is displayed below the candle. When a bearish setup appear
FREE
Session CVD
Riccardo Moreo
5 (1)
This is the Cumulative Volume Delta (CVD) , it's an indicator that calculates the long and short volumes plotting it then as a line on the chart, the most efficient way to use this indicator is by comparing the CVD line to the current chart and looking at the Divergence beetween the two of them, so that you can identify fake-outs and liquidty sweeps. for example in the picture that i put below you can see that the price has made a lower low but the CVD didn't, that means the volumes didn't suppo
FREE
이 제품의 구매자들이 또한 구매함
Trend Sniper X
Sarvarbek Abduvoxobov
4.86 (44)
Trend Sniper X 는 트레이더가 추세 방향과 잠재적 반전 지점을 명확하고 정확하게 포착할 수 있도록 도와주는 MetaTrader 5용 멀티 타임프레임 추세 추종 지표입니다. MT4용: https://www.mql5.com/en/market/product/193245 가격 정보: 현재 가격은 프로모션 할인가이며, 향후 업데이트 및 새로운 기능이 출시됨에 따라 변동될 수 있습니다. 보너스 혜택: 본 지표 전용 무료 자동매매 Assistant EA를 받으시려면 구매 후 작성자에게 메시지를 보내주시기 바랍니다. Code2Profit 채널 멀티 타임프레임 분석으로 시장을 마스터하세요! Trend Sniper X로 승률을 극대화하는 방법: 핵심 규칙 및 세션 팁 기술 사양 플랫폼 MetaTrader 5 지표 유형 멀티 타임프레임 추세 지표 운용 타임프레임 모든 차트 타임프레임 지원, 독립적으로 선택 가능한 상위 타임프레임(M1–MN1) 주요 상품 외환, 금(XAUUSD) 및 기타 C
새로운 왕의 등장 - 인디케이터 + 주문 관리 표시(TP1 + TP2 + TP3) + 선택형 텔레그램 시그널 전송 기능 포함 (무료) (완전한 트레이딩 및 시그널 시스템) 골드를 위한 최고의 EA: Gold Slayer 이 인디케이터는 고급 전략, 사용자 지정 가능한 주문 관리 시스템, 그리고 엔벨로프 확장을 결합한 평균 회귀(mean reversion) 시스템을 포함하고 있습니다. 또한 RSI와 같은 여러 지능형 확인 필터를 통해 높은 확률의 반전 진입 구간을 포착하여 BUY 및 SELL 시그널을 제공합니다. 단순히 거래 방법만 배우는 것이 아니라, 여러 포지션을 효과적으로 관리하고 이전에 수익 중인 오픈 포지션으로 손실 거래를 커버하는 방법까지 익힐 수 있습니다. M5 전용으로 설계 및 최적화되었으며, 유동성이 풍부해 시그널이 더 깔끔하고 신뢰도 높은 BTCUSD와 XAUUSD에서 뛰어난 성능을 발휘합니다. 이 인디케이터는 ATR 기반으로 자동 계산된 진입가, 손절가, 익절가와
Smart Trend Trading System — MetaTrader 5 구매 후 MQL5에서 저에게 메시지를 보내시면 Smart Universal Expert Advisor를 무료로 받으실 수 있으며, 온라인 강좌, PDF 매뉴얼 및 비공개 그룹 이용 권한도 함께 제공됩니다. STTS는 추세 방향, 진입·청산 신호, 반전 구간, 주요 가격 수준을 차트에 모아 보여줍니다. 시스템을 참고해 수동으로 거래하거나, 별도의 호환 EA를 연결하여 선택한 설정에 따라 자동으로 거래를 실행할 수 있습니다. 하나의 시스템, 네 가지 트레이딩 접근법 STTS의 트레이딩 접근법은 크게 네 가지로 나뉩니다. • 스캘핑 — 단기 신호와 시장 움직임을 살펴봅니다. • 추세 매매 — 방향을 평가하고 추세 안에서 기회를 찾습니다. • 반전 매매 — 잠재적인 전환 구간과 방향 변화를 파악합니다. • 거래량 매매 — 거래량 기반 정보로 시장 활동을 평가합니다. 진입·청산 화살표, 추세 정보, 지지·저항 수
Entry Points Pro for MT5
Yury Orlov
4.55 (152)
Entry Points Pro는 주문을 넣기 전에 어디에서 진입하고, 스탑을 어디에 두고, 어떤 랏으로 거래할지 보여 줍니다. 가격 지금 199 USD이며, 이 가격으로는 8카피입니다. 이후 가격은 249 USD, 최종 가격은 349 USD입니다. 저는 시장에서 트레이딩으로 돈을 벌고 그것을 보여 드립니다. 그래서 이 인디케이터를 모두에게 팔 필요가 없습니다. 스스로 생각하는 트레이더를 위한 도구이지, 마법 버튼이 아닙니다. 돌파가 없으면 거래도 없습니다. 회색 화살표는 취소된 신호입니다. 가격이 신호 캔들을 돌파하지 못했으므로 진입도 손실도 없습니다. 화살표는 캔들이 마감될 때 나타나며 리페인팅되지 않습니다. 설정은 두 가지: 예치금과 거래당 리스크. 결제 전에 확인하세요: 무료 데모는 MT5 전략 테스터에서 작동하며 2분이면 됩니다. 구매 후에는 제가 직접 설정을 도와 드리겠습니다. 2019년, 저는 이 지표가 무엇을 할 수 있는지 전 세계에 보여 주었습니다. 실계좌에서 지표의
Zoryk Gold
Reda El Koutbane
4.79 (19)
ZORYK — MetaTrader 5용 XAUUSD 전문 신호 및 트레이드 플래닝 시스템 이런 경험이 있을 것입니다. 골드를 분석하고 진입을 기다린 뒤 마침내 포지션을 열었지만 가격이 곧바로 반대 방향으로 움직입니다. 너무 일찍 청산하거나 Stop Loss를 옮기거나 몇 초 동안 망설입니다. 그 후 시장은 내가 없이도 처음 예상했던 목표까지 정확히 움직입니다. 문제는 항상 방향이 아니었습니다. 진짜 문제는 불확실성이었습니다. 정확한 진입 위치를 몰랐습니다. 어느 지점에서 원래의 트레이드 아이디어가 무효가 되는지 몰랐습니다. 가까운 수익을 확보해야 할지 더 큰 움직임을 기다려야 할지 판단하기 어려웠습니다. 현재 setup이 정말 강한지 아니면 단지 새로운 거래를 억지로 찾고 있는지도 확신하기 어려웠습니다. 골드는 매우 빠르게 움직입니다. 명확한 계획이 없다면 좋은 분석도 몇 초 만에 나쁜 결정으로 바뀔 수 있습니다. ZORYK는 이 문제를 해결하기 위해 개발되었습니다.
M5 Sniper
MeanFX
5 (4)
당신의 트레이딩 우위를 한눈에 확인하세요! M5 Sniper 는 MeanFX의 새로운 지표입니다. 정확한 트레이딩 신호 와 적응형 TP/SL 레벨 을 결합하여, 결과적으로 가능한 최고의 통계적 트레이딩을 만들어냅니다! 5회 구매마다 가격이 인상되며, 다음 가격은 69$입니다. 구매 후 저에게 메시지를 보내주시면 팁/가이드와 보너스 EA를 제공해 드립니다. 무엇이 이 지표를 특별하게 만들까요? Gold XAUUSD에서 검증된 통계적 성과 ( 거의 모든 자산에서 작동 하며, 일관된 결과 없이 모든 것을 다루려고 하기보다는 하나의 타임프레임을 완전히 익히는 데 집중합니다) 각 심볼당 하루 1~8회의 트레이드 와 높은 승률을 제공하며, 모든 통계적 우위를 우리의 편으로 가져갑니다. 차트에는 확인된 BUY 및 SELL 신호만 표시됩니다. 각 트레이드에 대해 지표가 생성하는 적응형 TP 및 SL 레벨 평균 승률 75%+ 평균 Signal Ratio 최소 1.1+ 알람 및 알림이 휴대폰 으로도
Gann Made Easy MT5
Oleg Rodin
5 (13)
Gann Made Easy 는 mr.의 이론을 사용하여 최고의 거래 원칙을 기반으로 하는 전문적이고 사용하기 쉬운 Forex 거래 시스템입니다. W.D. 간. 이 표시기는 Stop Loss 및 Take Profit Levels를 포함하여 정확한 BUY 및 SELL 신호를 제공합니다. PUSH 알림을 사용하여 이동 중에도 거래할 수 있습니다. 구매 후 거래 방법 안내 및 유용한 추가 지표를 무료로 받으시려면 저에게 연락주세요! 아마도 Gann 거래 방법에 대해 이미 여러 번 들었을 것입니다. 일반적으로 Gann의 이론은 초보자 거래자뿐만 아니라 이미 거래 경험이 있는 사람들에게도 매우 복잡한 것입니다. Gann의 거래 방식은 이론적으로 적용하기 쉽지 않기 때문입니다. 나는 그 지식을 연마하고 Forex 지표에 최고의 원칙을 적용하기 위해 몇 년을 보냈습니다. 표시기는 적용하기가 매우 쉽습니다. 차트에 첨부하고 간단한 거래 권장 사항을 따르기만 하면 됩니다. 지표는 지속적으로 시장 분석
SuperScalp Pro
Van Minh Nguyen
4.54 (37)
SuperScalp Pro - Professional Multi-Layer Confluence Scalping System SuperScalp Pro는 기존 Supertrend에 여러 지능형 확인 필터를 추가하여 기능을 강화한 고급 스캘핑 지표입니다. 잘못된 신호를 크게 줄이면서 성공 가능성이 더 높은 Buy/Sell 거래 기회를 식별하는 데 도움을 줍니다. 명확한 Buy 및 Sell 화살표가 차트에 직접 표시되며, ATR 기반 Stop Loss 및 Take Profit 레벨도 실시간으로 자동 계산됩니다. 구매 후 MQL5 메시지로 저에게 연락하시면 SuperScalp Pro Auto Trader EA를 무료로 받으실 수 있으며, 사용자 가이드와 비공개 그룹 이용 권한도 제공됩니다. 권장 설정 파일 다운로드: [Set File] 전체 문서는 제품 블로그에서 확인할 수 있습니다: [User Guide] 업데이트를 받으려면 공식 채널에 참여하세요: [Official Channel]
Ultra Indicator
Ihor Otkydach
5 (1)
ULTRA는 “올인원” 방식으로 작동하는 기술적 지표로, 시장을 독자적으로 분석하고, 매매 신호를 생성하며, 손절매 주문 설정 수준을 표시하고, 이익을 실현하거나 손실을 최소화하기 위해 포지션을 청산해야 할 시점을 제안합니다. 다시 말해, 시장을 분석하는 법을 모르거나, 가격 수준(손절매를 어디에 설정할지)을 파악하지 못하거나, 자금 관리에 어려움을 겪더라도 상관없습니다. ULTRA가 그 모든 것을 대신 해줄 테니까요! 구매자 특전 : ULTRA 지표를 구매하신 후, 저에게 비공개 메시지를 보내주시면 “ULTRA BOT”을 무료 선물로 드립니다. 이 도구는 해당 지표의 신호를 바탕으로 개설한 거래를 관리하는 데 도움을 주는 특별한 도구입니다(각 거래에 대해 손절매를 설정하고, 최상의 결과를 얻을 수 있도록 전략의 규칙에 따라 거래를 자동으로 청산해 줍니다).  또한 구매자분들께 다양한 자산에 바로 적용할 수 있는 설정값을 제공해 드리고 있으며, 이를 통해 지표가 최대 효율로 작동할
Gold Trend Coach MT5
Cristhian Alexander Gaibor Cuasquer
4.27 (11)
MetaTrader 5용 골드(XAUUSD) 매수·매도 신호, 리페인팅 없음. 모든 신호에 손절가와 세 개의 익절가가 함께 나옵니다. BOS와 CHoCH를 활용한 Smart Money Concepts 필터로 구조를 거스르지 않고 구조를 따라 매매합니다. 패널의 실시간 멘토가 진입부터 TP3까지 모든 단계를 안내합니다. 알림은 휴대폰과 나만의 Telegram 채널로 바로 옵니다. 이것이 Gold Trend Coach입니다. 이제 혼자 매매하지 마세요. 구매 시 무료 구매자 키트 제공: 1. Telegram Alert Bridge: 신호가 차트 스크린샷, 일일 리포트와 함께 나만의 Telegram 채널로 전송됩니다. 2. 사용자 매뉴얼과 설정 가이드. 받는 방법: 키트는 다운로드 파일에 들어 있지 않습니다. 구매 후 MQL5 메시지로 연락 주시면 당일에 보내드립니다. $39, $45 런칭가 물량은 매진되었습니다. 지금은 다음 10카피까지 $59, 이후 $79입니다. 먼저, 솔직한 이야
GoldenX Entry MT5
VividMind Digital Solutions
5 (17)
GoldenX Entry는 MT5용 인디케이터로, 적응형 Smart Entry Trend 알고리즘, 신호 스코어링 시스템, 시장 레짐 감지 기능, 그리고 변동성 필터를 포함합니다. 각 신호에는 계산된 진입 레벨, 3개의 익절(TP1, TP2, TP3) 레벨, 그리고 손절(Stop-Loss) 레벨이 포함됩니다. 이 인디케이터는 다양한 시장 환경에 적응하도록 설계된 다중 분석 레이어 구조 위에 구축되어 있으며, 내장 최적화기와 통계 추적 시스템을 결합합니다. 또한 Risk-to-Reward(RR) 지표와 과거 거래 행동 기반의 정량 분석을 제공합니다. 시작은 간단합니다 — 선택한 타임프레임에서 최적화기를 실행한 뒤 차트에서 바로 인디케이터를 사용하면 됩니다. 핵심 기능 GoldenX Entry는 하나의 차트에서 신호 엔진, 트레이드 관리 기능, 그리고 과거 통계 추적을 통합합니다: - 내장 최적화기: 최적화기는 차트에서 원클릭으로 실행됩니다. 200개의 파라미터 조합을 두 단계 탐색
SMC Intraday Formula
VividMind Digital Solutions
5 (26)
먼저 솔직하게 말하겠습니다. 어떤 인디케이터도 단독으로 당신을 수익성 있게 만들어주지 않습니다. 누군가 그렇게 말한다면, 그는 당신에게 꿈을 파는 것입니다. 완벽한 매수/매도 화살표를 보여주는 모든 인디케이터는 완벽하게 보이도록 만들 수 있습니다 — 단지 올바른 과거 구간을 확대하고 승리한 거래만 캡처하면 됩니다. 우리는 그렇게 하지 않습니다.  SMC Intraday Formula는 도구입니다. 시장 구조를 읽고, 가장 높은 확률의 가격 구간을 표시하며, 현재 스마트 머니의 흐름이 어떻게 보이는지 아주 단순한 언어로 보여줍니다. 최종 결정은 여전히 당신이 합니다. 실행도 당신이 합니다. 하지만 이제는 희망이 아니라 정확성으로 거래하게 됩니다. 우리는 이 인디케이터를 지난 약 3년 동안 골드(XAUUSD) 및 주요 외환 통화쌍의 데이 트레이딩 스캘핑에 사용해 왔습니다. M1, M5, M15, M30에서 우리의 핵심 도구입니다. 이 도구는 미래를 예측하려 하지 않습니다 — 지금 형성
Boba Analysis Suite
Trade Ready Solutions LLC
5 (2)
Boba Analysis Suite Boba Analysis Suite는 MetaTrader 5용 분석 지표입니다. 시장 구조, 주요 가격 영역, 전반적인 시장 상황을 하나의 차트 화면에 통합하여 표시합니다. 트레이더이자 트레이딩 코치로서의 실무 경험을 바탕으로 개발되었으며, 시장 방향 평가, 주요 가격 수준 식별, 여러 시간대의 종합적인 분석 등 체계적인 분석 과정을 지원합니다. 시장 맥락을 고려한 분석 개별 신호의 의미는 시장 상황에 따라 달라집니다. Boba Analysis Suite는 현재 차트 상황을 더 넓은 시장 구조와 연결하고, 사전에 정한 규칙에 따라 매매 아이디어를 검토할 수 있도록 돕습니다. 주요 분석 기능은 다음과 같습니다. 추세 및 시장 구조: 시장 방향과 관련 구조적 맥락을 평가합니다. 주요 가격 영역 및 수준: 추가 분석이 필요한 중요한 영역을 차트에 시각적으로 표시합니다. 여러 시간대: 서로 다른 시간대의 정보를 통합하여 전반적인 시장 상황을 평가합니다.
FX Power MT5 NG
Daniel Stein
5 (33)
FX Power: 통화 강세 분석으로 더 스마트한 거래 결정을 개요 FX Power 는 어떤 시장 상황에서도 주요 통화와 금의 실제 강세를 이해하기 위한 필수 도구입니다. 강한 통화를 매수하고 약한 통화를 매도함으로써 FX Power 는 거래 결정을 단순화하고 높은 확률의 기회를 발견합니다. 트렌드를 따르거나 극단적인 델타 값을 사용해 반전을 예측하고자 한다면, 이 도구는 귀하의 거래 스타일에 완벽히 적응합니다. 단순히 거래하지 말고, FX Power 로 더 스마트하게 거래하세요. 1. FX Power가 거래자에게 매우 유용한 이유 통화와 금의 실시간 강세 분석 • FX Power 는 주요 통화와 금의 상대적 강세를 계산하고 표시하여 시장 역학에 대한 명확한 통찰력을 제공합니다. • 어떤 자산이 앞서고 있고 어떤 자산이 뒤처지는지 모니터링하여 보다 현명한 거래 결정을 내릴 수 있습니다. 포괄적인 멀티 타임프레임 뷰 • 단기, 중기 및 장기 타임프레임에서 통화와 금의 강세를
Gold Entry Sniper
Tahir Mehmood
5 (23)
Gold Entry Sniper – 골드 스캘핑 & 스윙 트레이딩을 위한 전문 다중 시간 프레임 ATR 대시보드 Gold Entry Sniper 는 XAUUSD 및 기타 종목에 대해 정확한 매수/매도 신호 를 제공하는 고급 MetaTrader 5 지표입니다. ATR 트레일링 스톱 로직 과 다중 시간 프레임 분석 을 기반으로 설계되어 스캘핑과 스윙 트레이딩 모두에 적합합니다. 주요 기능 및 장점 다중 시간 프레임 분석 – M1, M5, M15 추세를 한눈에 확인. ATR 기반 트레일링 스톱 – 변동성에 따라 자동 조정. 전문 차트 대시보드 – 신호 상태, ATR 레벨, 회귀선, 매매 방향 표시. 명확한 매수/매도 마커 – 자동 화살표와 텍스트 라벨. 종료 알림 & 거래 관리 – 수익 보호를 위한 자동 종료 감지. 완전 사용자 설정 가능 – 대시보드 위치, 색상, ATR/회귀선 파라미터 조정. 골드(XAUUSD) 최적화 – M1~M15 스캘핑에 완벽, 외환/지수/암호화폐에도 적용 가능.
M1 Sniper MT5
Oleg Rodin
5 (7)
M1 SNIPER 는 사용하기 쉬운 거래 지표 시스템입니다. M1 시간대에 맞춰 설계된 화살표 지표입니다. 이 지표는 M1 시간대 스캘핑을 위한 단독 시스템으로 사용할 수 있으며, 기존 거래 시스템의 일부로도 사용할 수 있습니다. 이 거래 시스템은 M1 시간대 거래용으로 특별히 설계되었지만, 다른 시간대에도 사용할 수 있습니다. 원래는 XAUUSD와 BTCUSD 거래를 위해 이 방법을 설계했지만, 다른 시장 거래에도 유용하다는 것을 알게 되었습니다. 이 지표의 신호는 추세 방향과 반대로 거래될 수 있습니다. 저는 지표의 신호를 활용하여 양방향으로 거래할 수 있도록 돕는 특별한 거래 기법을 알려드립니다. 이 방법은 특별한 동적 지지선과 저항선 가격 영역을 활용하는 것을 기반으로 합니다. 구매하시면 M1 SNIPER 화살표 지표를 바로 다운로드하실 수 있습니다. 또한, 아래 스크린샷에 표시된 Apollo Dynamic SR 지표는 M1 SNIPER 도구를 사용하는 모든 사용자에게 무료로
FiboSniper Pro
Van Minh Nguyen
5 (4)
FiboSniper Pro – Multi-Filter Fibonacci System with Auto SL/TP and Control Panel FiboSniper Pro는 동적 Fibonacci Envelopes와 여러 확인 필터를 결합하여 선별된 Buy 및 Sell 신호를 생성하는 기술적 지표입니다. Fibonacci 레벨은 Moving Average와 ATR을 기반으로 계산된 후 ADX, EMA, RSI, ATR, Volume, Time 및 Candle 구조를 통해 필터링됩니다. 이 지표는 ATR 기반의 자동 Stop Loss 및 Take Profit 레벨을 차트에 직접 표시하며, 빠른 설정 조정을 위한 인터랙티브 Control Panel을 제공합니다. 구매 후 MQL5 메시지로 저에게 연락하시면 Auto Trader X를 무료로 받으실 수 있으며, 이 지표의 거래 신호를 자동화하는 방법에 대한 안내도 제공됩니다. User Guide 및 Set Files: [Click here
Apex Patterns PRO 인디케이터 구매 시 - 기반 Expert Advisor 무료 제공. 자체 최적화 차트 패턴 및 브레이크아웃 분석 시스템 기존의 패턴 스캐너는 고정된 파라미터에 의존하므로 시장 변동성과 구조가 변화할 때 성능이 저하되는 경우가 많습니다. Apex Patterns PRO는 구조적 차트 패턴 인식, 모멘텀 필터링, 통계적 자체 최적화를 하나의 분석 프레임워크로 결합하여 변화하는 시장 환경에 적응하도록 설계되었습니다. 적응형 스캐닝 엔진 자체 최적화 패턴 모드 최근 과거 데이터를 바탕으로 적절한 패턴 파라미터를 자동으로 탐색하여, 정적인 설정 대신 현재 시장 행보에 맞춰 인디케이터의 구조 감지 방식을 적응시킵니다. 스마트 브레이크아웃 필터링 클래식 패턴 인식과 모멘텀, 거래량, 프라이스 액션 지표를 결합합니다. 모든 브레이크아웃을 동일하게 다루는 대신, 시장의 기저 구조를 평가하여 현재 통계적 환경에 부합하는 셋업을 식별합니다. 주요 기능 리페인트 없는 고
Auto Optimized SpeedAngle 은 지속적인 워크포워드 최적화(Walk-Forward Optimization, WFO)를 통해 곡선 적합(curve-fitting)을 제거한 기관 수준의 모멘텀 벡터화 시스템입니다. 시장 체제가 바뀔 때 성능이 떨어지는 정적 입력에 의존하는 대신, 이 지표는 표본 외(Out-of-Sample, OOS) 검증을 사용하여 매개변수를 동적으로 재보정하며, 표시되는 신호가 과거의 우연이 아닌 진정한 통계적 우위를 나타내도록 보장합니다. 핵심 기관용 프레임워크 워크포워드 최적화 엔진: 핵심 알고리즘은 수천 가지의 룩백(lookback) 및 임계값 조합을 지속적으로 스캔하며, 데이터를 인샘플(in-sample)과 표본 외(out-of-sample) 세트로 엄격하게 분리합니다. 미지의 데이터 환경에서 수학적 우수성이 증명된 경우에만 새로운 매개변수 구성을 채택합니다. 정량적 목적 함수: 순수한 총이익을 쫓는 대신, 최적화 엔진은 기관 수준의 안정성
SQN Max indicator for MT5 by ITC
Renaud Herve Francois Candel
Sqn Max Indicator Sqn Max is an exclusive indicator to trade the market with high effectiveness. The indicator is based on price action, volatility and trend. This indicator is as simple as possible but not too simple. The indicator can generate alerts to ease the trading process. You don't have to stay all day in front of your screen. The indicator can be used with any class of assets and with any time frame. It is possible to achieve better results trading our list of selected assets. We achi
다음 업데이트 — 버전 2.52 곧 출시! [신규] 시장 분석 및 트레이딩 워크플로를 향상시키기 위해 설계된 4가지 주요 신규 기능을 기대해 주세요. 트레이딩 요구 사항을 충족하도록 설계된 4가지 새로운 기능으로 시장 분석을 한 단계 더 발전시킵니다. 다음 기능을 소개합니다: 1. TRADE OVERVIEW DASHBOARD 2. CONFLUENCE AT ZONE 3. STRONG & WEAK HIGH/LOW 4. OTE 1. TRADE OVERVIEW DASHBOARD 시장 전체 상황을 더 쉽게 파악할 수 있도록 도와주는 대시보드입니다. 트레이딩 의사결정을 지원하는 가이드를 제공하며, 하나의 화면에서 시장을 분석하고 체계적으로 트레이딩을 계획할 수 있도록 도와줍니다. 멀티 타임프레임 시장 개요 (Multi-Timeframe Market Overview) 시장 방향과 가격 구조를 더욱 명확하게 파악 시장 상황을 빠르게 확인 체계적인 시장 분석 및 진입 계획을 위한 가이드 2. CO
Divergence Bomber
Ihor Otkydach
4.89 (94)
이 지표를 구매하신 분께는 다음과 같은 혜택이 무료로 제공됩니다: 각 거래를 자동으로 관리하고, 손절/익절 수준을 설정하며, 전략 규칙에 따라 거래를 종료하는 전용 도우미 툴 "Bomber Utility" 다양한 자산에 맞게 지표를 설정할 수 있는 셋업 파일(Set Files) "최소 위험", "균형 잡힌 위험", "관망 전략" 모드로 설정 가능한 Bomber Utility의 셋업 파일 이 전략을 빠르게 설치, 설정, 시작할 수 있도록 돕는 단계별 영상 매뉴얼 주의: 위의 모든 보너스를 받기 위해서는 MQL5 개인 메시지 시스템을 통해 판매자에게 연락해 주세요. 독창적인 커스텀 지표인 “Divergence Bomber(다이버전스 봄버)”를 소개합니다. 이 지표는 MACD 다이버전스(괴리) 전략을 기반으로 한 올인원(All-in-One) 거래 시스템입니다. 이 기술 지표의 주요 목적은 가격과 MACD 지표 간의 다이버전스를 감지하고, **향후 가격이 어느 방향으로 움직일지를 알려주
Power Candles MT5
Daniel Stein
4.58 (12)
Power Candles V3 - 자체 최적화 강도 지표 파워 캔들 V3는 적용된 모든 차트에서 통화 및 상품의 강세를 실행 가능한 거래 계획으로 전환합니다. 단순히 캔들에 색상을 입히는 대신, 백그라운드에서 실시간 자동 최적화를 수행하여 현재 보고 있는 종목에 대한 최적의 손절매, 익절 및 신호 임계값을 제공합니다. 한 번의 클릭으로 실시간 거래에 적용할 수 있으며, 진입점, 손절매 및 익절 선이 정확한 가격에 맞춰 차트에 표시되고, 방향과 함께 알림이 발령됩니다. 이 도구는 Stein Investments 에코시스템의 일부입니다. 18개 이상의 도구와 함께 당신의 1대1 AI 트레이딩 멘토 Max.  항상 대기 중, 모든 인디케이터를 깊이 있게 이해, 무언가를 차근차근 생각해보고 싶은 순간에 도움을 줍니다.  https://stein.investments 에서 만나보세요 매 종가 바마다 3,000회 이상의 트레이딩 시뮬레이션. 9가지 강도 상태. 2가지 전략을 병렬로 테스트.
통화 강도 마법사는 성공적인 거래를 위한 올인원 솔루션을 제공하는 매우 강력한 지표입니다. 표시기는 여러 시간 프레임의 모든 통화 데이터를 사용하여 이 또는 해당 외환 쌍의 힘을 계산합니다. 이 데이터는 특정 통화의 힘을 확인하는 데 사용할 수 있는 사용하기 쉬운 통화 지수 및 통화 전력선의 형태로 표시됩니다. 필요한 것은 거래하려는 차트에 표시기를 부착하는 것뿐입니다. 표시기는 거래하는 통화의 실제 강세를 보여줍니다. 지표는 또한 추세와 거래할 때 유리하게 사용할 수 있는 구매 및 판매 거래량 압력의 극한값을 보여줍니다. 지표는 또한 피보나치에 기반한 가능한 대상을 보여줍니다. 표시기는 PUSH 알림을 포함한 모든 유형의 알림을 제공합니다. 구매 후 연락주세요. 나는 당신과 거래 팁을 공유하고 당신에게 무료로 훌륭한 보너스 지표를 줄 것입니다! 나는 당신에게 행복하고 유익한 거래를 기원합니다!
Atomic Analyst MT5
Issam Kassas
4.51 (65)
Atomic Analyst — MetaTrader 5 구매 후 MQL5에서 저에게 메시지를 보내시면 Smart Universal Expert Advisor를 무료로 받으실 수 있으며, 온라인 강좌, PDF 매뉴얼 및 비공개 그룹 이용 권한도 함께 제공됩니다. Atomic Analyst는 가격 움직임 분석, 추세 방향, 진입·청산 신호, 손절 수준, 여러 익절 수준을 차트에 모아 보여줍니다. 신호를 확인하고 매매 상황을 이해하세요 Atomic Analyst는 분석 결과를 명확한 시각 정보로 정리합니다. • 잠재적인 진입 기회를 확인할 수 있는 매수·매도 화살표. • 거래 계획에 도움이 되는 손절 수준과 여러 익절 수준. • 시장 방향을 평가할 수 있는 추세, 강도, 모멘텀 수치. • 더 넓은 시장 맥락을 비교할 수 있는 여러 시간대 분석. • 변화하는 시장 상황을 따라갈 수 있는 색상별 캔들과 알림. 신호와 보조 분석을 함께 검토한 다음, 해당 매매 상황이 자신의 거래 규칙에
Unix Scalper
Issam Kassas
4 (4)
Unix Scalper — MetaTrader 5 구매 후 MQL5에서 저에게 메시지를 보내시면 Smart Universal Expert Advisor를 무료로 받으실 수 있으며, 온라인 강좌, PDF 매뉴얼 및 비공개 그룹 이용 권한도 함께 제공됩니다. 매매 기회를 찾고, 거래 계획을 확인하고, 실행 방법을 선택하세요. UNIX Scalper는 시장 분석, BUY/SELL/WAIT 판단, Entry, Stop Loss, TP1 및 TP2 가격 수준을 하나의 정돈된 패널에 제공합니다. 신호와 거래 계획을 한눈에 • 명확한 판단: BUY, SELL 또는 WAIT. • 구체적인 가격 수준: Entry, Stop Loss, TP1 및 TP2. • 다중 시간대 개요: 패널의 여러 시간대 신호를 비교하세요. • 판단을 돕는 분석: 추세, 모멘텀, 거래량, 변동성, 지지와 저항, 시장 품질. • 다양한 레이아웃: Minimized, Compact, Standard 또는 Full. 신호와
Astral Structure
Ottaviano De Cicco
Astral Structure 셋업을 평가하고 초기 계획을 확인하세요. 출시 특별가 - $99. 출시 행사 종료 후 $149. 시장 구조 셋업에는 여러 질문이 따릅니다. 더 넓은 시각에서도 일치하는지, 스톱 기준은 어디인지, 목표는 어떻게 정하는지 살펴봐야 합니다. Astral Structure는 시장 구조를 바탕으로 판단하는 재량 트레이더를 위해 이 질문들을 한 작업 공간에 모아 줍니다. 관련 셋업에 집중하세요. 최근의 적격 셋업과 방향, 조건 충족 여부를 함께 검토하세요. 시간대 간 일치를 확인하세요. 평가 중인 셋업을 놓치지 않고 선택한 시간대의 값을 비교하세요. 초기 계획을 연결해 두세요. 각 요소를 따로 조합하지 않고 해당 셋업에 연결된 스톱 및 목표 기준값을 검토하세요. Structure를 사용하면 최근 조건을 충족한 셋업을 일관된 방식으로 검토할 수 있습니다. 맥락과 초기 가격 계획을 한곳에서 함께 확인하세요. 맥락 속에서 셋업 읽기 최신 BUY 또는 SELL 셋업, 해
Tokyo mt5 Indicator
Vasiliy Strukov
5 (15)
Tokyo Indicator는 추세 방향, 잠재적 거래 신호 및 시장 상황을 명확하고 시각적으로 보여줍니다. 색상으로 구분된 계단식 추세선은 강세 구간(파란색)과 약세 구간(자홍색)을 명확히 구별해 줍니다. 추세가 전환될 때 나타나는 방향성 화살표는 잠재적인 매수 및 매도 기회를 강조하여 보여줍니다. 통합 대시보드는 현재 신호, 시장 성향(bias), 모멘텀, 변동성, 신호 품질 등의 정보를 한눈에 파악할 수 있도록 구성되어 있습니다. 이를 통해 트레이더는 별도의 패널을 오갈 필요 없이 가격 움직임(price action)과 지표의 데이터를 동시에 분석할 수 있습니다. 깔끔한 차트 화면과 간결한 시장 개요를 제공하는 Tokyo Indicator는 체계적인 추세 분석과 거래 결정을 지원합니다. 모든 시간대와 다양한 자산(특히 금)에서 활용할 수 있습니다. 추세 방향, 잠재적 거래 신호 및 시장 상황을 명확하고 시각적으로 보여줍니다. 색상으로 구분된 계단식 추세선은 강세 구간(파란색)
Dynamic Forex28 Navigator MT5
Bernhard Schweigert
5 (1)
다중 통화 강도 및 모멘텀 지표 MT5 Dynamic Forex28 Navigator는 오랫동안 사랑받아 온 인기 지표들의 진화형으로, 다섯 가지의 힘을 하나로 결합했습니다. Advanced Currency Strength28 Indicator (리뷰 700개) Advanced Currency IMPULSE with ALERT (리뷰 530개) Currency Strength EXOTICS GOLD Impulse with Alert CS28 Combo Signals (최근 보너스) 지표 네 개를 따로 구매해 차트에 겹쳐 놓을 필요가 없습니다. 28개 Forex 페어의 강도, 이를 이끄는 시장의 모멘텀, 그리고 두 가지 모두의 알림이 하나의 강력한 지표로 통합되어 한 창, 한 차트에서 확인할 수 있습니다. 위 프로그램들은 MQL5 Market에서 1,200개 이상의 리뷰를 받았으며 2016년부터 MT4 커뮤니티의 필수 지표로 자리잡았습니다. Dynamic Forex28 Navigato
Scalper Vault MT5
Oleg Rodin
5 (1)
Scalper Vault는 당일 매매(intraday trading)에서 일관된 성과를 내고자 하는 트레이더를 위해 설계된, 강력하고 모든 기능을 갖춘 트레이딩 시스템입니다. 이 고정밀 지표는 외환(Forex) 및 바이너리 옵션 트레이더 모두에게 기관급 분석을 제공하는 독립적인 종합 트레이딩 시스템 역할을 합니다. 구매 후 저에게 연락해 주시면, 트레이딩 팁과 함께 특별한 보너스를 제공해 드립니다! Scalper Vault는 추측에 의존하거나 복잡한 수동 분석을 할 필요를 없애주며, 사용하기 쉬운 트레이딩 기법을 통해 오직 매매 실행에만 집중할 수 있도록 돕습니다. 정확한 추세 추종 신호: 핵심 알고리즘이 시장 구조를 분석하여, 지배적인 시장 추세 방향과 일치하는 고확률 신호만을 제공함으로써 잘못된 진입을 획기적으로 줄여줍니다. 정밀한 고점 및 저점 탐지: 시장의 움직임이 소진되는 지점을 스캔하여 잠재적인 반전 구간을 식별합니다. 간(Gann) 이론 기반의 매수/매도 구간: 수학적
제작자의 제품 더 보기
Smart Session Breakout MT5 — Precision Range Accumulation & Volatility Expansion Signals Markets spend part of the trading day accumulating volume inside a tight range, and part of the day breaking out with explosive momentum. Smart Session Breakout draws the exact accumulation range of any session you choose (Asian, London, New York), carries its high and low levels forward as dynamic support/resistance, and marks genuine breakout candles. Key Features: - Session Accumulation Box: Draws the
FREE
Smart Session Breakout MT4 — Precision Range Accumulation & Volatility Expansion Signals Markets spend part of the day building a range and part of the day leaving it. This indicator draws the range of a session you choose, keeps its high and low on the chart as levels, and marks the bars that close outside it. That is the whole scope. It is a way of seeing session structure, not a trading system, and it does not tell you when to buy or sell. What it does: - Draws the high and low of your c
FREE
ArgosWatch Drawdown Meter MT5 — Daily Loss & Maximum Drawdown Live Monitor Most trading accounts and prop challenge attempts are not lost to a bad strategy. They are lost to arithmetic performed under pressure: trying to calculate mid-trade how much of today's loss allowance is already gone and whether the next position still fits inside it. ArgosWatch Drawdown Meter answers that question continuously in real time, and adds something a simple readout cannot give you: an on-chart daily history
FREE
ArgosWatch Prop News and Volatility Guard MT5 — Institutional News and Spread Restriction Monitor Many prop trading firms enforce a High-Impact News Trading Restriction: no opening or closing trades within a set window (commonly 2 minutes) before or after red-folder news events (NFP, CPI, FOMC, Rate Decisions). The exact rule and window length vary by firm — always verify against your firm's rulebook and configure the inputs accordingly. ArgosWatch Prop News & Volatility Guard is engineered s
FREE
Compression Scanner MT5 — watches up to 24 symbols for session-range compression and the expansion that follows, and ranks them by how close each one is to moving. Every state it reports has an arithmetic definition, printed below. None of them is a forecast. WHAT IT DOES One panel, one chart, up to 24 symbols. For each one it measures the range of the session window you set, compares that range against what the symbol normall
필터:
리뷰 없음
리뷰 답변