ArgosWatch Prop Consistency Guard

  • Indicateurs
  • Antonios Kokkalis
    Antonios Kokkalis
    • MQL5 and NinjaScript Systems Developer à  ArgosWatch
    • Suède
    • 895
    Trader and systems developer. 12 years on MT4, MT5, and NinjaTrader 8.
    PUBLISHED WORK
    MQL5 Market — ArgosWatch Institutional Prop Suite:
    - Prop Challenge Guardian MT5-Daily and maximum drawdown barrier with on-chart SOS danger line and instant lot matrix
  • Version: 1.23
  • Mise à jour: 25 août 2026

────────────────────────────────────────────────────────────────

Consistency Guard MT5 — your best trading day, and your best single

trade, as a share of total profit, against the cap you set.


Drawdown is visible: equity moves and the platform shows it moving.

Consistency is a property of the distribution of results across a whole

evaluation, and MetaTrader computes nothing of the kind.


THE ARITHMETIC


    best day    = largest single trading day's net realised result

    best trade  = largest single closing deal's net result

    total       = net realised result since the challenge start


    day ratio   = best day   / total x 100

    trade ratio = best trade / total x 100


Both are computed. Which one is gated is an input: best day, best trade,

or both - and "both" gates on whichever of the two is higher, because

that is the one that fails you.


Net means net. Profit, commission, fee and swap are all included. Fee is

a separate field from commission and some brokers charge there instead,

so a tool that reads only commission understates the cost of every trade

on those accounts.


Commission charged at entry is counted in the day it was charged. The

money left the account that day and belongs in that day's total.


Deposits, withdrawals, credits and corrections are also deals in the

history. They are excluded by deal type - counted as profit, a deposit

becomes the best day of the evaluation on its own.


Trades closed against an opposing position carry DEAL_ENTRY_OUT_BY rather

than DEAL_ENTRY_OUT. They are included in the best-trade comparison. On an

account that never uses close-by this changes nothing; on one that does,

whole trades would otherwise be invisible.


THE DAY BOUNDARY IS AN INPUT


Firms do not agree on when a trading day starts. Some use the broker

server's midnight, some a fixed hour. If this tool buckets from one

boundary and your firm audits from another, a trade closed in between

falls in a different day in each calculation and the two answers never

reconcile.


The reset hour is yours to set. Keep it identical to whatever your

drawdown monitor uses, or the two tools will disagree with each other as

well.


THE FIRST DAY READS 100% AND IT IS NOT A BREACH


On the first trading day, that day is the entire history. Best day equals

total profit and the ratio is exactly 100% the moment the day closes

positive:


    500 / 500 x 100 = 100.0%


Below two trading days no ratio is shown at all. Not a red 100% - the

field reads "-- / 30.0%", the status reads COLLECTING DATA, and the panel

says which it is: "No closed trades yet", or "Only 1 trading day so far.

Needs 2+ days before a consistency picture makes sense." The realised

result so far is shown instead, because that part is real.


No alert can fire below two days either.


Two days is the minimum for the ratio to be defined. It is not the

minimum for it to be stable, so the number of trading days is printed

next to it and the start date with it.


THE CHALLENGE START


Detected as the earliest deal in the account's history, or set by hand -

which is what you need after a phase reset, when the history still holds

the previous phase and you are being judged only on this one.


CORRELATED CURRENCY EXPOSURE


Long EURUSD, long GBPUSD and long AUDUSD is not three positions. It is

one short-USD position of three lots wearing three names.


Every open position is split into its base and quote currency, a buy

counting positive on the base and negative on the quote, and the lots are

netted per currency. What you see is your directional exposure to each

currency, with the number of positions producing it, against a cap in

lots that you set.


This covers instruments named as two three-letter currency codes. Broker

suffixes are fine - EURUSD.m works. Indices, most CFDs and anything that

does not split into two valid codes are left out of the exposure netting

rather than force-fitted into it, and still appear in the position table.


OPEN POSITIONS


Listed by how much they are moving the account, largest absolute result

first. Which position is dominating, at a glance.


ALERTS


Two watches - the consistency ratio, and the worst currency exposure -

each at a warning share of its cap and again at the cap itself.


An alert fires when the level rises, not while it sits there. Crossing

into warning rings once; staying in warning is silent. Popup, sound, push

and email are separate switches.


THE PANEL


Three sizes, and a button that collapses it to its title bar when the

chart is wanted back. X and Y offsets move it clear of the price. The

exposure section and the position table can each be switched off, and

every colour is an input.


WHAT IT CANNOT TELL YOU


The ratio is a lagging measurement of a distribution, not a live risk

gauge. Unlike drawdown, where the next tick can breach a limit,

consistency moves only when a day closes. A figure sitting at twenty

percent today can be past forty by tomorrow evening. It tells you where

you have been, and it constrains what you can safely do next. It does not

warn you in the moment.


The thresholds are not the tool's to assume. The share, what counts in

the denominator, whether the test applies to days or trades or both, the

daily boundary, and whether the rule is checked continuously or only at

payout - all of these vary by firm and change over time. Every one is an

input for exactly that reason. A tool that measures the wrong rule

correctly is worse than no tool, because it is believed.


It places no orders and modifies no positions.


REQUIREMENTS


MetaTrader 5. Currency netting expects standard FX naming; everything

else is monitored for consistency and shown in the position table.


────────────────────────────────────────────────────────────────

PART OF THE ARGOSWATCH SERIES

Free: Smart Session Breakout MT5 / MT4 - the session range on your chart ArgosWatch Drawdown Meter MT5 - live daily loss and maximum drawdown ArgosWatch Prop News and Volatility Guard MT5 - news windows, spread Full tools: ArgosWatch Session Range Breakout Scanner - 24 symbols, ranked ArgosWatch Prop Consistency Guard - the rule that fails passed challenges Prop Challenge Guardian MT5 - risk barrier and lot matrix

────────────────────────────────────────────────────────────────

Produits recommandés
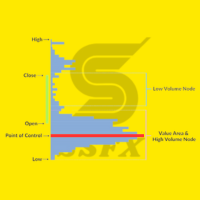
Haven Volume Profile
Maksim Tarutin
4.64 (14)
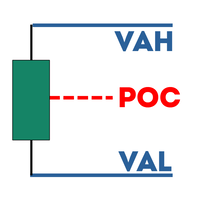
Haven Volume Profile est un indicateur multifonctionnel pour l'analyse du profil de volume qui aide à identifier les niveaux de prix clés basés sur la répartition du volume de négociation. Il a été conçu pour les traders professionnels qui souhaitent mieux comprendre le marché et identifier les points d'entrée et de sortie importants pour leurs transactions. Autres produits ->  ICI Fonctionnalités principales : Calcul du Point of Control (POC) - le niveau d'activité commerciale maximal, ce qui a
FREE
Mirror Chart MT5
Andrej Hermann
5 (1)
The Mirror Chart MT5 is a overlay indicator specifically designed to project a second financial instrument directly onto the main chart window. This tool is invaluable for traders who rely on correlation analysis, as it visualizes the price movements of two different instruments in real time. Unlike traditional overlays, this indicator utilizes intelligent, dynamic centering and scaling logic. It continuously analyzes the visible price range in the current window for both symbols and calculates
FREE
Volume profile CVD Frato
Francisco Felipe Alves Da Silva Rocha
5 (2)
Frato Volume Profile Pro v7.5 Développé par Frato Academy Cet indicateur affiche le profil prix-volume pour MetaTrader 5. Il calcule la distribution du volume échangé par niveau de prix sur une période configurable et présente les résultats directement sur le graphique principal. Fonctionnalités : Profil de volume avec dégradé de couleurs L'indicateur divise la plage de prix en niveaux et attribue un volume correspondant à chaque niveau. La couleur de chaque niveau varie selon un dégradé c
FREE
AvgVolumes
Marco Montemari
5 (1)
This indicator is based on Volumes standard indicator, calculates the average of Volumes based on the last N bars set by users, and if the value of the volume is bigger then a set % respect the average a different color will be used. The indicator is shown in a separate indicator window. This version has now a limitation in setting the % about the threshold. If you are interested to set threshold consider to buy the PRO version ( https://www.mql5.com/en/market/product/35925 ) If you want to use
FREE
BoxInside MT5
Evgeny Shevtsov
5 (4)
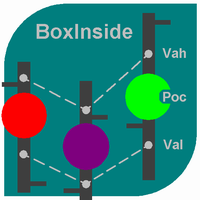
This indicator calculates the volume profile and places labels that correspond to the VAH, VAL and POC levels, for each candle individually. Indicator operation features The indicator works on the timeframes from M3 to MN, but it uses the history data of smaller periods: M1 - for periods from M3 to H1, M5 - for periods from H2 to H12, M30 - for the D1 period, H4 - for the W1 period, D1 - for the MN period. The color and location of the VAL, VAH and POC labels on the current candle are considere
FREE
MelloVWAP draws VWAP and volume profile on the chart from one indicator. Values on closed bars never change, so what you see in history is what you would have seen live. It needs no DLL and no external service. VWAP - Session, weekly and monthly VWAP - Anchored VWAP: drag the vertical line to any bar and the line recalculates - Two deviation bands on the session VWAP - Session start can be shifted from server midnight - Session VWAP is hidden on D1 and above, where it has no meaning Volume pro
FREE
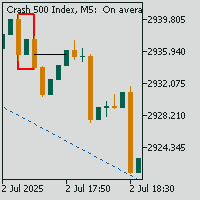
Here   our more valuable tools SMC Trend Trading   ,  Easy SMC Trading  ,  Institutional SMC Architect Volume Analysis Tools  ,  Volume flow Profile  ,  Market volume profile  , FVG with Volume  , Liquidity Heatmap Profile  ,  Volume Spread Analysis A professional spike pattern indicator built for synthetic traders who scalp and swing Crash 500/300/1000 with precision.  This indicator: Detects powerful 3-candle spike formations (Spike → Pullback → Spike) Automatically draws a clean box a
FREE
Market Profile 3 ForexArby com
Hussien Abdeltwab Hussien Ryad
4 (15)
Market Profile 3 MetaTrader 5 indicator  version 4.70— is a classic Market Profile implementation that can show the price density over time, outlining the most important price levels, value area, and control value of a given trading session. This indicator can be attached to timeframes between M1 and D1 and will show the Market Profile for daily, weekly, monthly, or even intraday sessions. Lower timeframes offer higher precision. Higher timeframes are recommended for better visibility. It is als
FREE
Gold Max pro
Israr Hussain Shah
4 (1)
Here   our more valuable tools SMC Trend Trading   ,  Easy SMC Trading  ,  Institutional SMC Architect Volume Analysis Tools  ,  Volume flow Profile  ,  Market volume profile  , FVG with Volume  , Liquidity Heatmap Profile  ,  Volume Spread Analysis Automatic Professional Theme:   Instantly applies a high-contrast "Color on White" theme with DeepSkyBlue bull candles and Black bear candles for maximum clarity. Interactive Timeframe Panel:   21 vertical buttons on the left side allow for one-clic
FREE
MicroScalper Timer
Gustavo Adolfo Ramirez
MicroScalper Timer is a premium, institutional-grade candle countdown utility designed for scalpers, day traders, and Prop Firm funded traders who demand absolute precision. Unlike standard timers that freeze when market volatility drops, this indicator is entirely independent of market ticks . Powered by an advanced OnTimer() engine, it updates flawlessly every real second, ensuring you know exactly when the next candle opens. What makes it truly unique is its built-in catalog of 10 Boutique Wa
BBMA with EMA50
Teeraporn Satitman
This indicator consist of Standard BBMA Standard signal Sign on chart added EMA50 Behavior Tracking: The chart background changes color based on the EMA50 (default is black) and shifts to white when a breakout of the Bollinger Bands occurs. Three Engulfing Color Change: Automatically adjusts colors to help you easily determine market zones. default yellow/white High-Low Line Sign: Highlights the potential trading range and key price levels for better visual  MHV
FREE
LM Volume Profile MT5 LM Volume Profile MT5 displays the distribution of calculated volume across price levels directly on the MetaTrader 5 chart. The indicator divides the selected price range into configurable price rows and displays the volume distribution as a horizontal histogram. It also calculates the Point of Control, Value Area High, Value Area Low, average profile price, and optional VWAP reference. Four profile modes are available: - Visible Range - Fixed Range - Session - Daily
FREE
Order Book, known also as Market Book, market depth, Level 2, - is a dynamically updated table with current volumes of orders to buy and to sell specific financial instument at price levels near Bid and Ask. MetaTrader 5 provides the means for receiving market book from your broker, but in real time only, without access to its history. The indicator OrderBook Cumulative Indicator accumulates market book data online and visualizes them on the chart. In addition, the indicator can show the market
The Horizontal Ray Tool is a lightweight, professional charting utility designed to streamline support and resistance mapping on MetaTrader 5. It brings rapid, one-click horizontal level placement directly to your live chart, eliminating the workspace clutter associated with infinite horizontal lines or manually drawn trendlines. Key Features: Interactive On-Screen Button: Spawns a clean, responsive "DRAW RAY" button docked directly on your chart canvas. A single click drops an independent hor
FREE
VP hidden
Emr Aljnaby
4.33 (12)
The indicator works to convert normal volume into levels and determine financial liquidity control points. It is very similar in function to Fixed Volume Profile. But it is considered more accurate and easier to use than the one found on Trading View because it calculates the full trading volumes in each candle and in all the brokers present in MetaTrade, unlike what is found in Trading View, as it only measures the broker’s displayed prices. To follow us on social media platforms: telegram
FREE
RM Volume Profile dessine un veritable Volume Profile et Market Profile (TPO) sur votre graphique — un profil par seance de trading — pour voir ou les transactions ont vraiment eu lieu et comment le POC (Point of Control) migre d'un jour a l'autre. Chaque seance affiche son POC et la Value Area (VAH/VAL), ainsi qu'un histogramme de volume optionnel. Affichez plusieurs seances precedentes a la fois pour suivre la migration du POC et reperer ou le marche a accepte ou rejete le prix. CARACTERIST
FREE
This indicator will mirror the assets in use in another metatrader, being able to choose the timeframe and a template. This is the Metatrader 5 Client, it needs the Metatrader 4 or 5 Server versions: Metatrader 4 Mirror Chart Server:   https://www.mql5.com/en/market/product/88644 Metatrader 5 Mirror Chart Server: https://www.mql5.com/en/market/product/88652 Details of how it works in the video.
FREE
Session Profiles
Basharat Umar Khan
5 (1)
Short Description Draws rolling Time-Price-Opportunity (TPO) and footprint volume profiles for the Asia, London, and New York sessions with POC/VAH/VAL levels, delta volume bias, order flow overlays, liquidity heatmaps, developing rolling lines, Naked POC (NPOC) tracking, Initial Balance breakouts, multi-session confluence zones, and automatic broker GMT-offset detection. Full Description Plots separate market-profile and volume-profile style histograms for the three major trading sessions (Asi
FREE
In trading, capital protection is everything. A single trade without a Stop Loss can wipe out profits, breach a funded account, or cause unnecessary emotional and financial damage within seconds. Even experienced traders can forget to place an SL during volatile market conditions or while managing multiple trades simultaneously. Since many Prop Firms enforce strict mandatory Stop Loss rules, one missing SL can instantly violate account conditions regardless of position size. STOP LOSS MONITOR is
FREE
DBS Time
Dmitriy Burlachenko
5 (3)
A small utility displays the time in five time zones. You can customize the display of one to five time zones. For each time it is configured: show or not; name; time offset from GMT; color; In general settings, you can change: date / time format ("hh: mi", "hh: mi: ss", "yyyy.mm.dd hh: mi", "yyyy.mm.dd hh: mi: ss") font name; font size; offset from the left edge of the chart; offset from the top edge of the chart;
FREE
Pips Hunter PRO MT5
Rodrigo Arana Garcia
5 (2)
Pips Hunter PRO   a été développé sur plusieurs années et est une version améliorée de son prédécesseur. Ce puissant indicateur analyse le marché et l'historique des prix pour générer des entrées d'achat et de vente. Pour le calcul de ces entrées, il utilise différents indicateurs qui travaillent ensemble ainsi qu'un logarithme statistique complexe qui filtre les entrées les moins favorables et les élimine /   version MT4 . Fonctionnalités Pas de repeinture Cet indicateur ne change pas ses va
FREE
Deriv Synthetic HTF Candle Projection GMT2 Higher Timeframe Candle Projection & Previous Levels Tool for Deriv Synthetic Indices (MT5) Overview Deriv Synthetic HTF Candle Projection GMT2 is a professional MetaTrader 5 indicator built specifically for Deriv Synthetic indices . It projects the current forming Higher Timeframe (HTF) candle onto the chart and automatically draws key reference levels from previous candles. This indicator is designed to help traders maintain higher timeframe context
FREE
Volume de ticks de chaque barre divisé par sa moyenne sur l'historique. Les barres au-dessus du niveau de pic sont mises en évidence, montrant une activité inhabituelle. Caractéristiques principales Calculé sur les barres clôturées, les valeurs ne se redessinent pas Fonctionne sur tous les symboles et toutes les unités de temps Toutes les périodes, tous les niveaux et toutes les couleurs peuvent être modifiés dans les paramètres Léger en ressources grâce à un réglage du nombre maximal de barres
FREE
Value Chart Candlesticks
Flavio Javier Jarabeck
4.57 (14)
The idea of a Value Chart indicator was presented in the very good book I read back in 2020 , " Dynamic Trading Indicators: Winning with Value Charts and Price Action Profile ", from the authors Mark Helweg and David Stendahl. The idea is simple and the result is pure genius: Present candlestick Price analysis in a detrended way! HOW TO READ THIS INDICATOR Look for Overbought and Oversold levels. Of course, you will need to test the settings a lot to find the "correct" one for your approach. It
FREE
Ospe POC Volume Profile
Nur Azureen Binti Ab Aziz
A volume-at-price heatmap with POC, value area, estimated buy/sell pressure, confirmed signals and alerts. POC Volume Profile Heatmap is a MetaTrader 5 indicator that organizes historical volume across price levels. It identifies the Point of Control, displays the selected value area, and estimates buying and selling pressure at the POC. The indicator is intended for traders who use volume-at-price structure to study acceptance, rejection and interaction around high-activity price levels. It c
FREE
JT360 DNA Mini PnL Pointer V1.04 Public Компактно. Наглядно. Всегда перед глазами. JT360 DNA Mini PnL Pointer — это лёгкий индикатор для MetaTrader 5, который отображает суммарную текущую прибыль или убыток по всем открытым позициям текущего символа графика. Компактная индикация непосредственно на графике объединяет PnL относительно первоначального риска в формате R, тонкую мини-полоску и настраиваемую цветовую матрицу. Фирменные цвета JT360 — бирюзовый и пурпурный — выделяют крайние значения и
FREE
Enhanced Volume Profile: The Ultimate Order Flow & Liquidity Analysis Tool Overview Enhanced Volume Profile is an indicator for MetaTrader 5 that displays the traded volume at specific price levels over a defined period. It separates the total volume into buy and sell components, presenting them as a side-by-side histogram on the chart. This allows users to observe the volume distribution and the proportion of buy and sell volumes at each price level. Graphics Rendering The indicator uses the
FREE
Aggression Volume
Flavio Javier Jarabeck
4.29 (17)
Aggression Volume Indicator is the kind of indicator that is rarely found in the MQL5 community because it is not based on the standard Volume data provided by the Metatrader 5 platform. It requires the scrutiny of all traffic Ticks requested on the platform... That said, Aggression Volume indicator requests all Tick Data from your Broker and processes it to build a very special version of a Volume Indicator, where Buyers and Sellers aggressions are plotted in a form of Histogram. Additionally,
FREE
Orange Indicator by Quant Atlas Creator:  https://www.quant-atlas.com/ Orange Indicator is a clean reversal focused indicator for MetaTrader 5, designed to highlight potential turning points directly on the chart using simple orange buy and sell markers. The indicator focuses on moments where price may be transitioning out of short term exhaustion and into a possible reaction phase. When a bullish setup appears, an orange upward triangle is displayed below the candle. When a bearish setup appear
FREE
Session CVD
Riccardo Moreo
5 (1)
This is the Cumulative Volume Delta (CVD) , it's an indicator that calculates the long and short volumes plotting it then as a line on the chart, the most efficient way to use this indicator is by comparing the CVD line to the current chart and looking at the Divergence beetween the two of them, so that you can identify fake-outs and liquidty sweeps. for example in the picture that i put below you can see that the price has made a lower low but the CVD didn't, that means the volumes didn't suppo
FREE
Les acheteurs de ce produit ont également acheté
Trend Sniper X
Sarvarbek Abduvoxobov
4.86 (44)
Trend Sniper X est un indicateur de suivi de tendance multi-unités de temps pour MetaTrader 5 qui aide les traders à identifier la direction de la tendance et les points d'inversion potentiels avec clarté et précision. pour MT4: https://www.mql5.com/en/market/product/193245 Informations sur le prix : Le prix actuel est un prix promotionnel et est susceptible de changer lors des prochaines mises à jour et nouvelles fonctionnalités. Offre bonus : Pour obtenir GRATUITEMENT l'Auto-Trade Assistant E
Un nouveau Roi en ville - Indicateur + Gestion des ordres (TP1 + TP2 + TP3) + Envoi optionnel de signaux Telegram INCLUS (GRATUIT) (SYSTÈME COMPLET DE TRADING et DE SIGNAUX) Notre meilleur EA pour l’Or : Gold Slayer Cet indicateur inclut une stratégie avancée, un système de trading avec gestion des ordres personnalisable ainsi qu’un système de retour à la moyenne combinant des extensions d’enveloppes, soutenu par plusieurs filtres intelligents de confirmation comme le RSI afin de détecter des en
Smart Trend Trading System — MetaTrader 5 Après votre achat, envoyez-moi un message sur MQL5 pour recevoir GRATUITEMENT Smart Universal Expert Advisor, ainsi que le cours en ligne, le manuel PDF et l’accès au groupe privé. STTS réunit la direction de la tendance, les signaux d’entrée et de sortie, les zones de retournement et les niveaux de prix importants directement sur votre graphique. Suivez le système manuellement ou connectez un EA compatible distinct pour une exécution automatique selon l
Entry Points Pro vous montre où entrer, où placer le stop et avec quel lot trader — avant que vous ne passiez l'ordre. PRIX Actuellement 199 USD : 8 exemplaires à ce prix, ensuite 249 USD. Le prix final est de 349 USD. Je gagne ma vie en tradant sur les marchés, et je le montre, donc je n'ai pas besoin de vendre cet indicateur à tout le monde. C'est un outil pour les traders qui réfléchissent par eux-mêmes, pas un bouton magique. Pas de cassure, pas de trade. Une flèche grise est un signal annu
Zoryk Gold
Reda El Koutbane
4.79 (19)
ZORYK — Système avancé de signaux XAUUSD pour MetaTrader 5 Vous connaissez certainement cette sensation. Vous passez du temps à analyser l’or. Vous attendez le bon point d’entrée. Vous ouvrez enfin la position, puis le prix commence immédiatement à évoluer contre vous. Vous fermez trop tôt, déplacez le Stop Loss ou hésitez pendant quelques secondes. Ensuite, le marché atteint exactement l’objectif que vous aviez initialement prévu, mais sans vous dans la position. Le problème n’était pas toujour
Gardez votre avantage de trading dans votre ligne de mire ! M5 Sniper est un nouvel indicateur de MeanFX. Il combine des signaux de trading précis avec des niveaux de TP/SL adaptatifs — créant ainsi les meilleures opportunités de trading statistiques possibles ! Le prix augmente tous les 5 achats, le prochain prix est de 69$ Envoyez-moi un message après l’achat pour recevoir des conseils/un guide et un EA bonus Qu’est-ce qui le distingue ? Performance statistique éprouvée sur Gold XAUUSD ( fonct
Gann Made Easy   est un système de trading Forex professionnel et facile à utiliser qui est basé sur les meilleurs principes de trading en utilisant la théorie de mr. WD Gann. L'indicateur fournit des signaux d'ACHAT et de VENTE précis, y compris les niveaux Stop Loss et Take Profit. Vous pouvez échanger même en déplacement en utilisant les notifications PUSH. VEUILLEZ ME CONTACTER APRÈS L'ACHAT POUR RECEVOIR GRATUITEMENT DES INSTRUCTIONS DE TRADING ET D'EXCELLENTS INDICATEURS SUPPLÉMENTAIRES! V
SuperScalp Pro
Van Minh Nguyen
4.54 (37)
SuperScalp Pro - Professional Multi-Layer Confluence Scalping System SuperScalp Pro est un indicateur de scalping avancé qui améliore le Supertrend classique grâce à plusieurs filtres intelligents de confirmation. Il vous aide à identifier des opportunités de trading Buy/Sell présentant une probabilité de réussite plus élevée, tout en réduisant considérablement les faux signaux. Des flèches Buy et Sell bien visibles apparaissent directement sur le graphique, avec des niveaux de Stop Loss et de T
Ultra Indicator
Ihor Otkydach
5 (1)
ULTRA est un indicateur technique « tout-en-un » : il analyse le marché de manière autonome, génère des signaux de trading, affiche les niveaux permettant de définir des ordres stop-loss et suggère le moment opportun pour clôturer les positions afin de sécuriser les bénéfices ou de minimiser les pertes. En d'autres termes, peu importe que vous ne sachiez pas analyser le marché, déterminer les niveaux (où placer votre stop-loss) ou que vous ayez du mal à gérer votre capital. ULTRA s'occupera de t
Gold Trend Coach MT5
Cristhian Alexander Gaibor Cuasquer
4.27 (11)
Des signaux d'achat et de vente sans repaint pour l'or (XAUUSD) sur MetaTrader 5. Chaque signal arrive avec un stop loss et trois take profits. Un filtre Smart Money Concepts avec BOS et CHoCH, pour trader dans le sens de la structure, pas contre elle. Un Mentor en direct sur votre panneau qui vous guide à chaque étape, de l'entrée jusqu'au TP3. Et des alertes directement sur votre téléphone et sur votre propre canal Telegram. C'est ça, Gold Trend Coach. Ne tradez plus jamais seul. KIT ACHETEUR
GoldenX Entry MT5
VividMind Digital Solutions
5 (17)
GoldenX Entry est un indicateur MT5 doté d’un algorithme adaptatif Smart Entry Trend, d’un système de scoring des signaux, d’un détecteur de régime de marché et d’un filtre de volatilité. Chaque signal inclut un niveau d’entrée calculé, trois niveaux de Take-Profit (TP1, TP2, TP3) ainsi qu’un niveau de Stop-Loss. Il est construit sur plusieurs couches analytiques conçues pour s’adapter à différentes conditions de marché, combinant un système analytique multicouche avec un optimiseur intégré et u
SMC Intraday Formula
VividMind Digital Solutions
5 (26)
Commençons par être honnêtes. Aucun indicateur ne vous rendra rentable à lui seul. Si quelqu’un vous dit le contraire, il vous vend un rêve. Tout indicateur qui affiche des flèches parfaites d’achat/vente peut être rendu impeccable — il suffit de zoomer sur la bonne partie de l’historique et de capturer uniquement les trades gagnants. Nous ne faisons pas cela.  SMC Intraday Formula est un outil. Il lit la structure du marché pour vous, identifie les zones de prix à la probabilité la plus élevée
Boba Analysis Suite
Trade Ready Solutions LLC
5 (2)
Boba Analysis Suite Boba Analysis Suite est un indicateur d’analyse pour MetaTrader 5. Il réunit la structure du marché, les zones de prix pertinentes et le contexte général du marché dans une même vue graphique. Développé à partir de l’expérience pratique d’un trader et formateur en trading, il accompagne une démarche d’analyse structurée : évaluer la direction du marché, identifier les niveaux importants et analyser plusieurs unités de temps conjointement. Une analyse en contexte La significat
FX Power MT5 NG
Daniel Stein
5 (33)
FX Power : Analysez la force des devises pour des décisions de trading plus intelligentes Aperçu FX Power est l'outil essentiel pour comprendre la force réelle des principales devises et de l'or, quelles que soient les conditions du marché. En identifiant les devises fortes à acheter et les faibles à vendre, FX Power simplifie vos décisions de trading et révèle des opportunités à forte probabilité. Que vous suiviez les tendances ou anticipiez les retournements à l'aide de valeurs extrêmes de D
Gold Entry Sniper
Tahir Mehmood
5 (23)
Gold Entry Sniper – Tableau de Bord ATR Multi-Unités de Temps pour Scalping et Swing Trading sur l'Or Gold Entry Sniper est un indicateur avancé pour MetaTrader 5 qui fournit des signaux d'achat/vente précis sur XAUUSD et autres actifs, basé sur la logique de Trailing Stop ATR et l' analyse multi-unités de temps . Caractéristiques et Avantages Clés Analyse Multi-Unités de Temps – Affiche les tendances en M1, M5, M15 sur un seul tableau. Trailing Stop Basé sur l'ATR – Ajuste automatiquement selon
M1 Sniper MT5
Oleg Rodin
5 (7)
M1 SNIPER   est un système d'indicateurs de trading facile à utiliser. Il s'agit d'un indicateur à flèche conçu pour l'unité de temps M1. Cet indicateur peut être utilisé seul pour le scalping sur l'unité de temps M1 ou intégré à votre système de trading existant. Bien que conçu spécifiquement pour le trading sur l'unité de temps M1, ce système peut également être utilisé avec d'autres unités de temps. Initialement, j'avais conçu cette méthode pour le trading du XAUUSD et du BTCUSD. Cependant, j
FiboSniper Pro
Van Minh Nguyen
5 (4)
FiboSniper Pro – Multi-Filter Fibonacci System with Auto SL/TP and Control Panel FiboSniper Pro est un indicateur technique qui combine des Fibonacci Envelopes dynamiques avec plusieurs filtres de confirmation afin de générer des signaux Buy et Sell sélectionnés. Les niveaux de Fibonacci sont calculés à partir de Moving Average et ATR, puis filtrés par ADX, EMA, RSI, ATR, Volume, Time et la structure des bougies. L’indicateur affiche directement sur le graphique les niveaux automatiques de Stop
Apex Patterns PRO Achetez l'indicateur - Obtenez GRATUITEMENT l'Expert Advisor basé sur celui-ci. Intelligence auto-optimisée des figures chartistes et des cassures Les scanners de figures traditionnels s'appuient sur des paramètres fixes, sous-performant souvent lorsque la volatilité et les structures du marché changent. Apex Patterns PRO est conçu pour s'adapter aux conditions changeantes du marché en combinant la reconnaissance des figures chartistes structurelles, le filtrage du momentum et
Auto Optimized SpeedAngle est un système de vectorisation du momentum de niveau institutionnel qui élimine l'ajustement de courbe ( curve-fitting ) grâce à une optimisation continue par avancement ( Walk-Forward Optimization , WFO). Plutôt que de s'appuyer sur des entrées statiques qui se dégradent lorsque les régimes de marché changent, l'indicateur recalibre dynamiquement ses paramètres en utilisant une validation hors échantillon ( Out-of-Sample , OOS), garantissant ainsi que les signaux affi
SQN Max indicator for MT5 by ITC
Renaud Herve Francois Candel
Sqn Max Indicator Sqn Max is an exclusive indicator to trade the market with high effectiveness. The indicator is based on price action, volatility and trend. This indicator is as simple as possible but not too simple. The indicator can generate alerts to ease the trading process. You don't have to stay all day in front of your screen. The indicator can be used with any class of assets and with any time frame. It is possible to achieve better results trading our list of selected assets. We achi
Prochaine mise à jour — Version 2.52 bientôt disponible ! [NOUVEAU] Préparez-vous à découvrir 4 nouvelles fonctionnalités majeures conçues pour améliorer votre analyse du marché et votre flux de travail de trading Nous faisons passer l’analyse du marché au niveau supérieur avec 4 nouvelles fonctionnalités conçues pour répondre à vos besoins en trading. Découvrez : 1. TRADE OVERVIEW DASHBOARD 2. CONFLUENCE AT ZONE 3. STRONG & WEAK HIGH/LOW 4. OTE 1. TRADE OVERVIEW DASHBOARD Un tableau de bord qu
Divergence Bomber
Ihor Otkydach
4.89 (94)
Chaque acheteur de cet indicateur reçoit également gratuitement : L’outil exclusif « Bomber Utility », qui accompagne automatiquement chaque opération de trading, fixe les niveaux de Stop Loss et de Take Profit, et clôture les positions selon les règles de la stratégie Des fichiers de configuration (set files) pour adapter l’indicateur à différents actifs Des set files pour configurer le Bomber Utility selon différents modes : « Risque Minimum », « Risque Équilibré » et « Stratégie d’Attente »
Power Candles MT5
Daniel Stein
4.58 (12)
Power Candles V3 - Indicateur de force à optimisation automatique Power Candles V3 transforme la force des devises et des instruments en un plan de trading exploitable sur chaque graphique auquel il est associé. Au lieu de se contenter de colorer les bougies, il effectue une optimisation automatique en temps réel en arrière-plan et vous fournit les meilleurs niveaux de Stop Loss, Take Profit et seuils de signal pour le symbole que vous avez sous les yeux. Un simple clic suffit pour l'adopter en
Currency Strength Wizard   est un indicateur très puissant qui vous offre une solution tout-en-un pour un trading réussi. L'indicateur calcule la puissance de telle ou telle paire de devises en utilisant les données de toutes les devises sur plusieurs périodes. Ces données sont représentées sous la forme d'un indice de devise facile à utiliser et de lignes électriques de devise que vous pouvez utiliser pour voir la puissance de telle ou telle devise. Tout ce dont vous avez besoin est d'attacher
Atomic Analyst MT5
Issam Kassas
4.51 (65)
Atomic Analyst — MetaTrader 5 Après votre achat, envoyez-moi un message sur MQL5 pour recevoir GRATUITEMENT Smart Universal Expert Advisor, ainsi que le cours en ligne, le manuel PDF et l’accès au groupe privé. Atomic Analyst réunit l’action des prix, la direction de la tendance, les signaux d’entrée et de sortie, le Stop Loss et plusieurs niveaux de Take Profit directement sur votre graphique. REPÉREZ LE SIGNAL. COMPRENEZ LA CONFIGURATION. Atomic Analyst présente son analyse sous forme d’inform
Unix Scalper
Issam Kassas
4 (4)
Unix Scalper — MetaTrader 5 Après votre achat, envoyez-moi un message sur MQL5 pour recevoir GRATUITEMENT Smart Universal Expert Advisor, ainsi que le cours en ligne, le manuel PDF et l’accès au groupe privé. Repérez la configuration. Consultez le plan. Choisissez comment intervenir. UNIX Scalper réunit l’analyse du marché, les décisions BUY/SELL/WAIT et les niveaux Entry, Stop Loss, TP1 et TP2 dans un panneau organisé. VISUALISEZ LE SIGNAL ET LE PLAN • Des décisions claires : BUY, SELL ou WAIT.
Astral Structure
Ottaviano De Cicco
Astral Structure Évaluez la configuration. Consultez le plan initial. Offre de lancement - $99. $149 après le lancement. Une configuration de structure soulève plusieurs questions : la vue plus large concorde-t-elle, où se situe la référence de stop et comment les objectifs sont-ils définis ? Astral Structure réunit ces questions dans un espace de travail pour les traders discrétionnaires qui fondent leurs décisions sur la structure du marché. Concentrez-vous sur la configuration pertinente. Exa
Tokyo mt5 Indicator
Vasiliy Strukov
5 (15)
Le Tokyo Indicator offre une vue d'ensemble visuelle et claire de l'orientation de la tendance, des signaux de trading potentiels et des conditions du marché. Sa ligne de tendance en escalier, codée par couleur, distingue les phases haussières (en bleu) des phases baissières (en magenta). Des flèches directionnelles associées mettent en évidence les opportunités d'achat et de vente potentielles lors des changements de tendance. Un tableau de bord intégré regroupe le signal actuel, l'orientation
Indicateur multi-devises de force et de momentum MT5 Dynamic Forex28 Navigator est l'évolution de nos indicateurs populaires de longue date, qui réunit la puissance de cinq en un : Advanced Currency Strength28 Indicator (700 avis) Advanced Currency IMPULSE with ALERT (530 avis) Currency Strength EXOTICS GOLD Impulse with Alert CS28 Combo Signals (bonus actuel) Pas besoin d'acheter quatre indicateurs et de les empiler sur vos graphiques. Tout est réuni dans un seul indicateur puissant : la force
Scalper Vault est un système de trading puissant et complet, conçu pour les traders en quête de régularité dans le cadre du trading intrajournalier. Cet indicateur de haute précision constitue un système de trading autonome et exhaustif, offrant des analyses de qualité institutionnelle, aussi bien pour le Forex que pour les options binaires. VEUILLEZ ME CONTACTER APRÈS VOTRE ACHAT POUR OBTENIR MES CONSEILS DE TRADING AINSI QU'UN EXCELLENT BONUS ! En éliminant les incertitudes et les analyses man
Plus de l'auteur
Smart Session Breakout MT5 — Precision Range Accumulation & Volatility Expansion Signals Markets spend part of the trading day accumulating volume inside a tight range, and part of the day breaking out with explosive momentum. Smart Session Breakout draws the exact accumulation range of any session you choose (Asian, London, New York), carries its high and low levels forward as dynamic support/resistance, and marks genuine breakout candles. Key Features: - Session Accumulation Box: Draws the
FREE
Smart Session Breakout MT4 — Precision Range Accumulation & Volatility Expansion Signals Markets spend part of the day building a range and part of the day leaving it. This indicator draws the range of a session you choose, keeps its high and low on the chart as levels, and marks the bars that close outside it. That is the whole scope. It is a way of seeing session structure, not a trading system, and it does not tell you when to buy or sell. What it does: - Draws the high and low of your c
FREE
ArgosWatch Drawdown Meter MT5 — Daily Loss & Maximum Drawdown Live Monitor Most trading accounts and prop challenge attempts are not lost to a bad strategy. They are lost to arithmetic performed under pressure: trying to calculate mid-trade how much of today's loss allowance is already gone and whether the next position still fits inside it. ArgosWatch Drawdown Meter answers that question continuously in real time, and adds something a simple readout cannot give you: an on-chart daily history
FREE
ArgosWatch Prop News and Volatility Guard MT5 — Institutional News and Spread Restriction Monitor Many prop trading firms enforce a High-Impact News Trading Restriction: no opening or closing trades within a set window (commonly 2 minutes) before or after red-folder news events (NFP, CPI, FOMC, Rate Decisions). The exact rule and window length vary by firm — always verify against your firm's rulebook and configure the inputs accordingly. ArgosWatch Prop News & Volatility Guard is engineered s
FREE
Compression Scanner MT5 — watches up to 24 symbols for session-range compression and the expansion that follows, and ranks them by how close each one is to moving. Every state it reports has an arithmetic definition, printed below. None of them is a forecast. WHAT IT DOES One panel, one chart, up to 24 symbols. For each one it measures the range of the session window you set, compares that range against what the symbol normall
Filtrer:
Aucun avis
Répondre à l'avis