Break And Retreace MT5

Break & Retrace is a smart price action indicator designed to help traders identify the most important market events after a support or resistance level is formed. Instead of drawing countless lines on your chart, the indicator automatically highlights key breakout opportunities, detects fake breakouts, and confirms retracement entries with a clean and easy-to-read interface.

Whether you're a breakout trader or prefer waiting for pullbacks, Break & Retrace gives you the signals you need without unnecessary complexity.

 Key Features

- Breakout Detection

Automatically detects when price successfully breaks a Support or Resistance (SNR) zone.

  • Instant BREAK signal after a confirmed breakout.
  • Ideal for momentum and breakout trading strategies.
  • Helps traders catch strong market moves early.

Fake Breakout Detection

Avoid entering false breakouts.

The indicator identifies situations where price briefly breaks an SNR level but quickly returns inside the zone, helping you filter out low-quality signals and reduce unnecessary losses.

Retrace Detection

Never miss a second entry opportunity.

After a valid breakout, the indicator monitors price retracements back to the broken SNR level and generates a RETRACE signal when price revisits the zone.

Perfect for traders who prefer confirmation entries instead of chasing the breakout candle.

Additional Features

  • Clean & easy-to-read chart visualization.
  • Automatic Support & Resistance (SNR) zones.
  • Breakout, Fake Breakout & Retrace labels.
  • Alert notifications.
  • Push notifications for MetaTrader mobile.
  • Buffer outputs available for EA development, automation, and custom strategies.
추천 제품
Chart Candle Timer Pro
Alireza Gholamreza Mohammadi
Chart Candle Timer Pro is a professional candle countdown panel for MetaTrader 5. It displays a compact, elegant dashboard on your chart that shows the time remaining until the next candle opens, along with essential market data at a glance. The panel updates every 200 milliseconds, ensuring a smooth and accurate countdown. It works on all standard timeframes from M1 to MN and adapts its time format automatically, showing HH:MM:SS for higher timeframes and MM:SS for shorter ones. User Guide
FREE
Aussenstab Markttechnik
Alexander Josef Zeidler
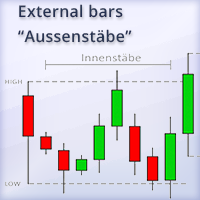
This indicator shows external bars ("Aussenstäbe") in the chart in candle form. The colors of the candles can be set individually. Also different colors for bearish and bullish bars are possible. In addition, the color of the wicks or outlines is also adjustable. Outside bars are mentioned e.g. by Michael Voigt in the book "Das große Buch der Markttechnik". All other candles are inner bars.
BLADE Candle Timer
Mohammad Abu Abdullah
BLADE Candle Timer – Free MT5 Indicator A simple and lightweight indicator that displays the remaining time until the current candle closes. Features: Live countdown in hours, minutes, and seconds. Works on all timeframes. Customizable text color, font, size, and position. Updates every second. Easy to use. Free to download. No trading signals or automatic trades.
FREE
LT Support Resistance - 지지와 저항을 100% 자동으로 식별 수동으로 지지와 저항선을 그리느라 귀중한 시간을 낭비하는 데 지치셨나요? 아니면 매번 중요한 레벨을 놓쳐서 답답하셨나요? LT Support Resistance는 이러한 번거로운 작업을 없애기 위해 개발되었습니다. 여러 타임프레임(시간족)을 동시에 분석하여, 거래 중인 자산의 가장 중요한 구역을 자동으로 식별하고 차트에 표시해 줍니다. == 중요 레벨의 스마트 자동화 == 주관적이고 시간이 오래 걸리는 수동 라인 작도 대신, 본 지표는 과거 가격 데이터를 분석하여 유의미한 반전 포인트를 식별하고, 가격이 '실제'로 신뢰하고 반응하는 지지 및 저항선을 그려줍니다. 그 결과 데이터에 기반한 객관적이고 신속한 분석이 가능해집니다. == 주요 특징 == 100% 자동 감지: 수동 분석 없이도 지지/저항 레벨 식별 멀티 타임프레임(MTF): M5 차트에서 H1, H4, D1, W1 레벨을 동시에 시각화 스마트 알
Previous Candle Levels MT5
Wachinou Lionnel Pyrrhus Sovi Guidi
1 (1)
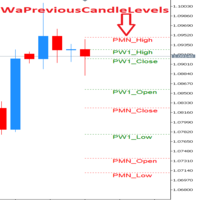
Previous Candle Levels MT5 shows the previous candle levels, it shows the previous candle Open High Low Close levels (OHLC Levels) in different time frame. It's designed to help the trader to analyse the market and pay attention to the previous candle levels in different time frame.  We all know that the OHLC Levels in Monthly, Weekly and Daily are really strong and must of the time, the price strongly reacts at those levels. In the technical analysis, the user can use them as a support and res
FREE
E2C Lines
Eduardo Cristian De Carvalho
Descubra o poder do nosso indicador de alta precisão, projetado para identificar as regiões de alvo e exaustão de qualquer ativo. Testado e validado por mais de 3 anos nos mercados de mini dólar e mini índice, ele oferece confiabilidade e eficácia incomparáveis. Transforme sua estratégia de trading e alcance novos patamares de sucesso com nossa ferramenta inovadora.
Elektra Power Law
AMMIRELLA GROUP (PTY) LTD
Elektra Power Law draws a trendline where you ask for one, and fits it to the whole population of swing points inside your selection instead of to the two points under your cursor.   You hold CTRL and drag across the stretch of chart you want measured. The indicator finds every swing pivot in that range and fits a line through them using a repeated median of the slopes between all pairs of pivots. A single unusual bar therefore moves the line very little, which is the difference between this and
강세 및 약세 3선 스트라이크 형성을 찾는 것 외에도 이 다중 기호 및 다중 시간 프레임 표시기는 다음 촛대 패턴을 스캔할 수도 있습니다(패턴 설명은 스크린샷 참조). 백병 3명(역전>연속 패턴) 검은 까마귀 3마리(역전>연속 패턴) 지표 설정의 엄격한 옵션이 활성화된 경우 대형은 더 높은 시간 프레임에 자주 나타나지 않습니다. 그러나 그렇게 할 때 그것은 매우 높은 가능성의 설정입니다. Thomas Bulkowski(국제적으로 알려진 촛대 패턴의 저자이자 선도적인 전문가)에 따르면 Three line strike는 모든 촛대 패턴의 전체 성능 순위가 가장 높습니다. 고유한 규칙 및 기술과 결합하여 이 표시기를 사용하면 강력한 시스템을 생성(또는 강화)할 수 있습니다. 특징 Market Watch 창에 표시되는 모든 기호를 동시에 모니터링할 수 있습니다. 하나의 차트에만 지표를 적용하고 전체 시장을 즉시 모니터링하십시오. M1에서 MN까지 모든 시간 프레임을 모니터링할 수 있으며 패
Trading Session MT5
Kevin Schneider
3 (1)
Trading Session Indicator The Trading Session Indicator visualizes the high and low points as well as the start and end times of the Asian, London, and New York trading sessions directly on your chart. Features: Visualization of major trading sessions Highlighting of high and low points Display of start and end times for each session Customizable session times User-friendly and efficient Customizability: Each trading session (Asian, London, New York) can be individually customized to match speci
FREE
MetaTrader 5용 스마트 다층 브레이크아웃 및 풀백 탐지기 Better Trading. Better Tools. The Indicator Evolved into  Break Pullback Utilities : https://www.mql5.com/en/market/product/205163 "스마트하고, 간단하고, 빠르게!" 고확률 브레이크아웃 진입을 놓치는 것에 지치셨나요? 여러 차트를 몇 시간씩 스캔하면서 브레이크아웃을 추세 방향과 통화 모멘텀에 맞추려고 하지만 — 결국 움직임을 놓치고 마나요? Break Pullback은 하나의 지표로 이 모든 문제를 해결합니다. Break Pullback이란 무엇인가요? Break Pullback은 시장 구조, 브레이크아웃, 추세 지속 설정을 거래하는 트레이더를 위해 특별히 설계된 전문가급 MetaTrader 5 지표입니다. 실시간으로 여러 통화 쌍에 걸쳐 Break와 Pullback 형성을 자동으로 감지하고 — 세 가지 확인 레
Apex Point
Marco Engstermann
Apex Point is a trend-following indicator for MetaTrader 5, transforming complex market data into signals for traders. It displays blue dots for uptrends, red dots for downtrends, and yellow crosses at potential reversals, helping users identify momentum shifts quickly. Key features include a confirmation system requiring multiple bars (default: 3) to validate changes, reducing false signals; dynamic ATR-based offsets for adaptive trailing, with instant ratcheting in the trend direction and smo
FREE
Candle Reversal , is designed to identify and highlight key candlestick patterns that signal potential trend reversals or continuations in the market. It focuses on two primary types of patterns: 3-Line Strike Patterns   (Bullish and Bearish) Engulfing Patterns   (Bullish and Bearish) The indicator provides visual cues (arrows and text labels) on the chart to help traders quickly identify these patterns, making it easier to make informed trading decisions.  use with MACD or awesome oscilator to
QuantumAlert Stoch Navigator is a free indicator available for MT4/MT5 platforms, its work is to provide "alerts" when the market is inside "overbought and oversold" regions in the form of "buy or sell" signals. This indicator comes with many customization options mentioned in the parameter section below, user can customise these parameters as needful. Join our   MQL5 group , where we share important news and updates. You are also welcome to join our private channel as well, contact me for the p
FREE
Aurum mid quant pro
N'da Lemissa Kouame
AURUM MID-QUANT PRO v5.60 Quantitative Excellence for Gold (XAU/USD) & Volatility Trading Gain a professional edge over institutional markets with AURUM MID-QUANT PRO , an advanced Price Action Pattern Detection and Breakout Engine designed exclusively for MetaTrader 5 . Built specifically to capture the unique volatility of Gold (XAU/USD) and other major financial instruments, this powerful indicator combines high-precision algorithmic pattern recognition with real-time dynamic accumulation z
Overview The Engulfing Scanner Dashboard is an advanced analytical indicator and graphical utility designed to monitor multiple currency pairs and timeframes simultaneously from a single chart. Its primary objective is to detect, filter, and display two specific variations of the Engulfing candlestick pattern: standard Retail Engulfing and advanced Institutional Engulfing. Rather than acting as a standalone automated trading system, this software functions as a comprehensive technical scanner t
Gabus Niveles
Gabriel Antonio Diaz Quevedo
Niveles G: Institutional Levels & Volume Profile Map The Edge of Professional Trading Niveles G is not just another indicator; it is a comprehensive mapping tool that automates the identification of high-relevance institutional zones. Professional traders and algorithms don't react to random prices—they react to specific liquidity anchors. Niveles G plots these anchors automatically, keeping your chart clean and your strategy focused. Why These Levels Are Crucial? In trading, these levels repres
Ali Levels Pro
Alexandra Voicu
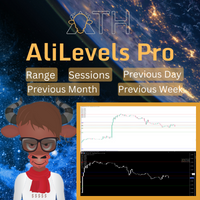
Ali Levels Pro is an indicator designed to identify and draw levels of interest including: Opening Range High/Low with seconds precision,  Previous Session High/Low (if you are a Intraday trader who trades Indices or Commodities maybe you want to know yesterday New York Session high and low),  Overnight Session High/Low,  Previous Day High/Low,  Previous Week High/Low, and  Previous Month High/Low. Traders use this levels as support and resistance levels.  By searching for confluences between
Global Exchange Sessions Global Exchange Sessions is an MQL5 indicator that marks the regular trading hours of the world’s main stock exchanges directly on your chart. Each session is shown as a colored rectangle. The rectangle starts at the official market open and ends at the official market close. Its upper and lower edges follow the session high and low as new prices arrive. This makes it easy to see when major equity markets are active, where each session formed its range, and how price rea
FREE
Orderflow Super Candles - Simple Footprint Chart Indicator Platform: MetaTrader 5 (MT5)  (The last screenshot shows the use of the DOM tool in conjunction with the product.) 1. Product Introduction Orderflow Super Candles is a professional charting tool based on underlying Tick data analysis, designed to provide traders with a deep "X-ray" view of the market. By parsing the buy and sell volume distribution within each candlestick, this indicator visualizes the hidden market microstructure. It
SynapticTrendline — Automatic Trendlines with Touch and Break Statistics Overview SynapticTrendline is a chart-window indicator for MetaTrader 5. It automatically detects and draws support and resistance trendlines, then tracks how price interacts with them: touches, held or failed touches, breakouts, follow-through or failure, and retests. Selected candles can be colored, and a compact panel summarizes the current statistics. This indicator is designed as an analysis and education tool. It does
FREE
Candle Close Timer Matrix
Sivakumar Paul Suyambu
Candle Close Timer Matrix – MT5 Candle Countdown Indicator Candle Close Timer Matrix is a lightweight and powerful MetaTrader 5 (MT5) candle countdown indicator that shows exactly how many minutes and seconds are left before the current candle closes on any symbol and any timeframe. Download MT5 EA Products Whether you are a scalper , intraday trader or swing trader , knowing the exact candle close time helps you: Time your entries on candle close Avoid impulsive mid-candle decisions Sync your t
FREE
Support Resistance Dynamic
Quang Huy Quach
5 (2)
The "Support Resistance Dynamic" indicator is a powerful technical analysis tool for the MetaTrader 5 platform, designed to automatically identify and plot dynamic Support and Resistance zones on price charts. This indicator helps traders easily recognize important price levels, potential reversal points, or breakout areas, thereby enabling more informed trading decisions. 2. Key Features Dynamic S/R Identification : Automatically identifies support and resistance zones based on an advanced Pivo
FREE
Veltrion Market Environment   is a professional market safety dashboard for MetaTrader 5. This indicator helps manual traders evaluate current market conditions before making trading decisions. It does not open trades, close trades, modify orders, or provide buy/sell signals. The dashboard analyzes key market environment factors: Spread condition ATR-based volatility condition EMA-based trend or range condition Trading session condition Market safety score Optional economic calendar status The i
This indicator automatically detects harmonic price patterns on your chart, both bullish and bearish, and shows them as soon as they form, including potential patterns that are still developing. For every pattern it draws the Potential Reversal Zone (PRZ), and for completed patterns it also draws two take-profit and two stop-loss levels. Supported Patterns: Gartley, Bat, Butterfly, Crab, Deep Crab, Shark and Cypher. Each pattern can be switched on or off individually. Key Features: Completed
FREE
Auto Support and Resistances
Flavio Javier Jarabeck
4.56 (71)
Are you tired of drawing Support & Resistance levels for your Quotes? Are you learning how to spot Support & Resistances? No matter what is your case, Auto Support & Resistances will draw those levels for you! AND, it can draw them from other timeframes, right into you current chart, no matter what timeframe you are using... You can also Agglutinate regions/zones that are too much closer to each other and turning them into one single Support & Resistance Level. All configurable. SETTINGS Timefr
FREE
Support And Resistance Levels MT5
Abdelkhabir Yassine Alaoui
Support And Resistance indicator that can display round levels and zones . It shows them directly on the chart, providing an easy help when you want to set stop-loss or take-profit level, or when you want to see the next market target.   If an asset price is moving down and bounces back up, the level is called support (think: price floor). If an asset price is moving upward and hits a level where it reverses downward, this is called resistance (think: price ceiling).
FREE
Opulence SnR
Tokunbo Greatpath Adebowale
Opulence SnR — Support & Resistance Indicator Automatically detect and display the most relevant support and resistance levels on your chart — no manual drawing, no repainting, no guesswork. Opulence SnR uses confirmed swing point logic to identify where price has genuinely reacted in the past, then draws those levels cleanly on your chart. Every level is locked in only after the required candles have fully closed, so what you see on historical bars today is exactly what you would have seen at t
Advisor for hedging trading or pair trading. A convenient panel allows you to open positions on the necessary trading instruments and lots. Automatically determines the type of trading account - netting or hedging. Advisor can close all its positions upon reaching profit or loss (determined in the settings). A negative value is required to control losses (for example, -100, -500, etc.). If the corresponding fields are 0, the EA will not use this function.   Settings: Close profit (if 0 here
Virgil smc
Habeeb Babatunde Bello
Limited introductory offering Virgil SMC is listed at   $49 . After   30 further purchases , the price advances to   $150 . Early access will not remain at this level. VIRGIL SMART MONEY CONCEPT Institutional Structure. Clear Confluence. High-Impact News Protection. Decisions You Can Trust. Most traders are not losing because they lack effort. They lose because the chart is noisy, the rules are unclear, the signal arrives without context — and because a high-impact news candle can wipe a clean
JONUX Session CVD — Cumulative Delta Analysis for MT5 JONUX Session CVD is a technical indicator for MetaTrader 5 designed to calculate and visualize cumulative market pressure throughout specific trading sessions. Since Forex lacks a centralized order book, this tool utilizes an algorithmic model to reconstruct directional pressure by analyzing price displacement and tick volume intensity. Technical Logic The indicator calculates a "Session Delta" value for every candle, which is then accumula
이 제품의 구매자들이 또한 구매함
Trend Sniper X
Sarvarbek Abduvoxobov
4.86 (44)
Trend Sniper X 는 트레이더가 추세 방향과 잠재적 반전 지점을 명확하고 정확하게 포착할 수 있도록 도와주는 MetaTrader 5용 멀티 타임프레임 추세 추종 지표입니다. MT4용: https://www.mql5.com/en/market/product/193245 가격 정보: 현재 가격은 프로모션 할인가이며, 향후 업데이트 및 새로운 기능이 출시됨에 따라 변동될 수 있습니다. 보너스 혜택: 본 지표 전용 무료 자동매매 Assistant EA를 받으시려면 구매 후 작성자에게 메시지를 보내주시기 바랍니다. Code2Profit 채널 멀티 타임프레임 분석으로 시장을 마스터하세요! Trend Sniper X로 승률을 극대화하는 방법: 핵심 규칙 및 세션 팁 기술 사양 플랫폼 MetaTrader 5 지표 유형 멀티 타임프레임 추세 지표 운용 타임프레임 모든 차트 타임프레임 지원, 독립적으로 선택 가능한 상위 타임프레임(M1–MN1) 주요 상품 외환, 금(XAUUSD) 및 기타 C
새로운 왕의 등장 - 인디케이터 + 주문 관리 표시(TP1 + TP2 + TP3) + 선택형 텔레그램 시그널 전송 기능 포함 (무료) (완전한 트레이딩 및 시그널 시스템) 골드를 위한 최고의 EA: Gold Slayer 이 인디케이터는 고급 전략, 사용자 지정 가능한 주문 관리 시스템, 그리고 엔벨로프 확장을 결합한 평균 회귀(mean reversion) 시스템을 포함하고 있습니다. 또한 RSI와 같은 여러 지능형 확인 필터를 통해 높은 확률의 반전 진입 구간을 포착하여 BUY 및 SELL 시그널을 제공합니다. 단순히 거래 방법만 배우는 것이 아니라, 여러 포지션을 효과적으로 관리하고 이전에 수익 중인 오픈 포지션으로 손실 거래를 커버하는 방법까지 익힐 수 있습니다. M5 전용으로 설계 및 최적화되었으며, 유동성이 풍부해 시그널이 더 깔끔하고 신뢰도 높은 BTCUSD와 XAUUSD에서 뛰어난 성능을 발휘합니다. 이 인디케이터는 ATR 기반으로 자동 계산된 진입가, 손절가, 익절가와
Smart Trend Trading System — MetaTrader 5 구매 후 MQL5에서 저에게 메시지를 보내시면 Smart Universal Expert Advisor를 무료로 받으실 수 있으며, 온라인 강좌, PDF 매뉴얼 및 비공개 그룹 이용 권한도 함께 제공됩니다. STTS는 추세 방향, 진입·청산 신호, 반전 구간, 주요 가격 수준을 차트에 모아 보여줍니다. 시스템을 참고해 수동으로 거래하거나, 별도의 호환 EA를 연결하여 선택한 설정에 따라 자동으로 거래를 실행할 수 있습니다. 하나의 시스템, 네 가지 트레이딩 접근법 STTS의 트레이딩 접근법은 크게 네 가지로 나뉩니다. • 스캘핑 — 단기 신호와 시장 움직임을 살펴봅니다. • 추세 매매 — 방향을 평가하고 추세 안에서 기회를 찾습니다. • 반전 매매 — 잠재적인 전환 구간과 방향 변화를 파악합니다. • 거래량 매매 — 거래량 기반 정보로 시장 활동을 평가합니다. 진입·청산 화살표, 추세 정보, 지지·저항 수
Zoryk Gold
Reda El Koutbane
4.78 (18)
ZORYK — MetaTrader 5용 XAUUSD 전문 신호 및 트레이드 플래닝 시스템 이런 경험이 있을 것입니다. 골드를 분석하고 진입을 기다린 뒤 마침내 포지션을 열었지만 가격이 곧바로 반대 방향으로 움직입니다. 너무 일찍 청산하거나 Stop Loss를 옮기거나 몇 초 동안 망설입니다. 그 후 시장은 내가 없이도 처음 예상했던 목표까지 정확히 움직입니다. 문제는 항상 방향이 아니었습니다. 진짜 문제는 불확실성이었습니다. 정확한 진입 위치를 몰랐습니다. 어느 지점에서 원래의 트레이드 아이디어가 무효가 되는지 몰랐습니다. 가까운 수익을 확보해야 할지 더 큰 움직임을 기다려야 할지 판단하기 어려웠습니다. 현재 setup이 정말 강한지 아니면 단지 새로운 거래를 억지로 찾고 있는지도 확신하기 어려웠습니다. 골드는 매우 빠르게 움직입니다. 명확한 계획이 없다면 좋은 분석도 몇 초 만에 나쁜 결정으로 바뀔 수 있습니다. ZORYK는 이 문제를 해결하기 위해 개발되었습니다.
Entry Points Pro for MT5
Yury Orlov
4.52 (152)
Entry Points Pro는 주문을 넣기 전에 어디에서 진입하고, 스탑을 어디에 두고, 어떤 랏으로 거래할지 보여 줍니다. 가격 지금 149 USD이며, 이 가격으로는 마지막 1카피입니다. 이후 가격은 199 USD로 오르고, 최종 가격은 349 USD입니다. 저는 시장에서 트레이딩으로 돈을 벌고 그것을 보여 드립니다. 그래서 이 인디케이터를 모두에게 팔 필요가 없습니다. 스스로 생각하는 트레이더를 위한 도구이지, 마법 버튼이 아닙니다. 화살표는 캔들이 마감될 때 나타나며 리페인팅되지 않습니다. 설정은 두 가지: 예치금과 거래당 리스크. 결제 전에 확인하세요: 무료 데모는 MT5 전략 테스터에서 작동하며 2분이면 됩니다. 구매 후에는 제가 직접 설정을 도와 드리겠습니다. 2019년, 저는 이 지표가 무엇을 할 수 있는지 전 세계에 보여 주었습니다. 실계좌에서 지표의 시그널에 따라 수동으로, 모두가 볼 수 있게 공개적으로 거래했습니다 — 계좌는 Myfxbook에서 모니터링되었고,
M5 Sniper
MeanFX
5 (4)
당신의 트레이딩 우위를 한눈에 확인하세요! M5 Sniper 는 MeanFX의 새로운 지표입니다. 정확한 트레이딩 신호 와 적응형 TP/SL 레벨 을 결합하여, 결과적으로 가능한 최고의 통계적 트레이딩을 만들어냅니다! 5회 구매마다 가격이 인상되며, 다음 가격은 69$입니다. 구매 후 저에게 메시지를 보내주시면 팁/가이드와 보너스 EA를 제공해 드립니다. 무엇이 이 지표를 특별하게 만들까요? Gold XAUUSD에서 검증된 통계적 성과 ( 거의 모든 자산에서 작동 하며, 일관된 결과 없이 모든 것을 다루려고 하기보다는 하나의 타임프레임을 완전히 익히는 데 집중합니다) 각 심볼당 하루 1~8회의 트레이드 와 높은 승률을 제공하며, 모든 통계적 우위를 우리의 편으로 가져갑니다. 차트에는 확인된 BUY 및 SELL 신호만 표시됩니다. 각 트레이드에 대해 지표가 생성하는 적응형 TP 및 SL 레벨 평균 승률 75%+ 평균 Signal Ratio 최소 1.1+ 알람 및 알림이 휴대폰 으로도
SuperScalp Pro
Van Minh Nguyen
4.54 (37)
SuperScalp Pro - Professional Multi-Layer Confluence Scalping System SuperScalp Pro는 기존 Supertrend에 여러 지능형 확인 필터를 추가하여 기능을 강화한 고급 스캘핑 지표입니다. 잘못된 신호를 크게 줄이면서 성공 가능성이 더 높은 Buy/Sell 거래 기회를 식별하는 데 도움을 줍니다. 명확한 Buy 및 Sell 화살표가 차트에 직접 표시되며, ATR 기반 Stop Loss 및 Take Profit 레벨도 실시간으로 자동 계산됩니다. 구매 후 MQL5 메시지로 저에게 연락하시면 SuperScalp Pro Auto Trader EA를 무료로 받으실 수 있으며, 사용자 가이드와 비공개 그룹 이용 권한도 제공됩니다. 권장 설정 파일 다운로드: [Set File] 전체 문서는 제품 블로그에서 확인할 수 있습니다: [User Guide] 업데이트를 받으려면 공식 채널에 참여하세요: [Official Channel]
Gold Trend Coach MT5
Cristhian Alexander Gaibor Cuasquer
4.2 (10)
Gold Trend Coach는 MetaTrader 5용 금(XAUUSD) 추세 지표로, 캔들 마감에 확정되는 매수·매도 신호(리페인트 없음), 손절과 세 개의 익절 목표, 진입부터 TP3까지 안내하는 코치, 멀티 타임프레임 패널, 휴대폰과 텔레그램 알림을 제공합니다. 런던·뉴욕 세션의 M1·M5 스캘핑과 M15 데이 트레이딩용으로 만들었습니다. 보너스: Gold Trend Coach 자동매매 EA 무료 제공. 구매 후 메시지를 주시면 지표 신호로 자동 매매하는 EA와, 모든 신호·진입·손절·도달한 목표를 텔레그램 채팅, 그룹 또는 채널로 보내는 Telegram Alert Bridge를 set 파일과 설치 가이드와 함께 보내 드립니다. 출시 가격 $39는 처음 20개 한정이었고 이미 매진되었습니다. 현재 가격 40개까지 $45, 이후 $59. 예정된 최종 가격 $79. 아마 이미 수십 개의 금 지표를 써 보셨을 겁니다. 대부분은 화살표로 매수·매도 신호만 주고 가장 어려운 부분, 즉
GoldenX Entry MT5
VividMind Digital Solutions
5 (17)
GoldenX Entry는 MT5용 인디케이터로, 적응형 Smart Entry Trend 알고리즘, 신호 스코어링 시스템, 시장 레짐 감지 기능, 그리고 변동성 필터를 포함합니다. 각 신호에는 계산된 진입 레벨, 3개의 익절(TP1, TP2, TP3) 레벨, 그리고 손절(Stop-Loss) 레벨이 포함됩니다. 이 인디케이터는 다양한 시장 환경에 적응하도록 설계된 다중 분석 레이어 구조 위에 구축되어 있으며, 내장 최적화기와 통계 추적 시스템을 결합합니다. 또한 Risk-to-Reward(RR) 지표와 과거 거래 행동 기반의 정량 분석을 제공합니다. 시작은 간단합니다 — 선택한 타임프레임에서 최적화기를 실행한 뒤 차트에서 바로 인디케이터를 사용하면 됩니다. 핵심 기능 GoldenX Entry는 하나의 차트에서 신호 엔진, 트레이드 관리 기능, 그리고 과거 통계 추적을 통합합니다: - 내장 최적화기: 최적화기는 차트에서 원클릭으로 실행됩니다. 200개의 파라미터 조합을 두 단계 탐색
SMC Intraday Formula
VividMind Digital Solutions
5 (26)
먼저 솔직하게 말하겠습니다. 어떤 인디케이터도 단독으로 당신을 수익성 있게 만들어주지 않습니다. 누군가 그렇게 말한다면, 그는 당신에게 꿈을 파는 것입니다. 완벽한 매수/매도 화살표를 보여주는 모든 인디케이터는 완벽하게 보이도록 만들 수 있습니다 — 단지 올바른 과거 구간을 확대하고 승리한 거래만 캡처하면 됩니다. 우리는 그렇게 하지 않습니다.  SMC Intraday Formula는 도구입니다. 시장 구조를 읽고, 가장 높은 확률의 가격 구간을 표시하며, 현재 스마트 머니의 흐름이 어떻게 보이는지 아주 단순한 언어로 보여줍니다. 최종 결정은 여전히 당신이 합니다. 실행도 당신이 합니다. 하지만 이제는 희망이 아니라 정확성으로 거래하게 됩니다. 우리는 이 인디케이터를 지난 약 3년 동안 골드(XAUUSD) 및 주요 외환 통화쌍의 데이 트레이딩 스캘핑에 사용해 왔습니다. M1, M5, M15, M30에서 우리의 핵심 도구입니다. 이 도구는 미래를 예측하려 하지 않습니다 — 지금 형성
Gann Made Easy MT5
Oleg Rodin
5 (13)
Gann Made Easy 는 mr.의 이론을 사용하여 최고의 거래 원칙을 기반으로 하는 전문적이고 사용하기 쉬운 Forex 거래 시스템입니다. W.D. 간. 이 표시기는 Stop Loss 및 Take Profit Levels를 포함하여 정확한 BUY 및 SELL 신호를 제공합니다. PUSH 알림을 사용하여 이동 중에도 거래할 수 있습니다. 구매 후 거래 방법 안내 및 유용한 추가 지표를 무료로 받으시려면 저에게 연락주세요! 아마도 Gann 거래 방법에 대해 이미 여러 번 들었을 것입니다. 일반적으로 Gann의 이론은 초보자 거래자뿐만 아니라 이미 거래 경험이 있는 사람들에게도 매우 복잡한 것입니다. Gann의 거래 방식은 이론적으로 적용하기 쉽지 않기 때문입니다. 나는 그 지식을 연마하고 Forex 지표에 최고의 원칙을 적용하기 위해 몇 년을 보냈습니다. 표시기는 적용하기가 매우 쉽습니다. 차트에 첨부하고 간단한 거래 권장 사항을 따르기만 하면 됩니다. 지표는 지속적으로 시장 분석
Ultra Indicator
Ihor Otkydach
5 (1)
ULTRA는 “올인원” 방식으로 작동하는 기술적 지표로, 시장을 독자적으로 분석하고, 매매 신호를 생성하며, 손절매 주문 설정 수준을 표시하고, 이익을 실현하거나 손실을 최소화하기 위해 포지션을 청산해야 할 시점을 제안합니다. 다시 말해, 시장을 분석하는 법을 모르거나, 가격 수준(손절매를 어디에 설정할지)을 파악하지 못하거나, 자금 관리에 어려움을 겪더라도 상관없습니다. ULTRA가 그 모든 것을 대신 해줄 테니까요! 구매자 특전 : ULTRA 지표를 구매하신 후, 저에게 비공개 메시지를 보내주시면 “ULTRA BOT”을 무료 선물로 드립니다. 이 도구는 해당 지표의 신호를 바탕으로 개설한 거래를 관리하는 데 도움을 주는 특별한 도구입니다(각 거래에 대해 손절매를 설정하고, 최상의 결과를 얻을 수 있도록 전략의 규칙에 따라 거래를 자동으로 청산해 줍니다).  또한 구매자분들께 다양한 자산에 바로 적용할 수 있는 설정값을 제공해 드리고 있으며, 이를 통해 지표가 최대 효율로 작동할
Boba Analysis Suite
Trade Ready Solutions LLC
5 (2)
Boba Analysis Suite Boba Analysis Suite는 MetaTrader 5용 분석 지표입니다. 시장 구조, 주요 가격 영역, 전반적인 시장 상황을 하나의 차트 화면에 통합하여 표시합니다. 트레이더이자 트레이딩 코치로서의 실무 경험을 바탕으로 개발되었으며, 시장 방향 평가, 주요 가격 수준 식별, 여러 시간대의 종합적인 분석 등 체계적인 분석 과정을 지원합니다. 시장 맥락을 고려한 분석 개별 신호의 의미는 시장 상황에 따라 달라집니다. Boba Analysis Suite는 현재 차트 상황을 더 넓은 시장 구조와 연결하고, 사전에 정한 규칙에 따라 매매 아이디어를 검토할 수 있도록 돕습니다. 주요 분석 기능은 다음과 같습니다. 추세 및 시장 구조: 시장 방향과 관련 구조적 맥락을 평가합니다. 주요 가격 영역 및 수준: 추가 분석이 필요한 중요한 영역을 차트에 시각적으로 표시합니다. 여러 시간대: 서로 다른 시간대의 정보를 통합하여 전반적인 시장 상황을 평가합니다.
다음 업데이트 — 버전 2.52 곧 출시! [신규] 시장 분석 및 트레이딩 워크플로를 향상시키기 위해 설계된 4가지 주요 신규 기능을 기대해 주세요. 트레이딩 요구 사항을 충족하도록 설계된 4가지 새로운 기능으로 시장 분석을 한 단계 더 발전시킵니다. 다음 기능을 소개합니다: 1. TRADE OVERVIEW DASHBOARD 2. CONFLUENCE AT ZONE 3. STRONG & WEAK HIGH/LOW 4. OTE 1. TRADE OVERVIEW DASHBOARD 시장 전체 상황을 더 쉽게 파악할 수 있도록 도와주는 대시보드입니다. 트레이딩 의사결정을 지원하는 가이드를 제공하며, 하나의 화면에서 시장을 분석하고 체계적으로 트레이딩을 계획할 수 있도록 도와줍니다. 멀티 타임프레임 시장 개요 (Multi-Timeframe Market Overview) 시장 방향과 가격 구조를 더욱 명확하게 파악 시장 상황을 빠르게 확인 체계적인 시장 분석 및 진입 계획을 위한 가이드 2. CO
M1 Sniper MT5
Oleg Rodin
5 (7)
M1 SNIPER 는 사용하기 쉬운 거래 지표 시스템입니다. M1 시간대에 맞춰 설계된 화살표 지표입니다. 이 지표는 M1 시간대 스캘핑을 위한 단독 시스템으로 사용할 수 있으며, 기존 거래 시스템의 일부로도 사용할 수 있습니다. 이 거래 시스템은 M1 시간대 거래용으로 특별히 설계되었지만, 다른 시간대에도 사용할 수 있습니다. 원래는 XAUUSD와 BTCUSD 거래를 위해 이 방법을 설계했지만, 다른 시장 거래에도 유용하다는 것을 알게 되었습니다. 이 지표의 신호는 추세 방향과 반대로 거래될 수 있습니다. 저는 지표의 신호를 활용하여 양방향으로 거래할 수 있도록 돕는 특별한 거래 기법을 알려드립니다. 이 방법은 특별한 동적 지지선과 저항선 가격 영역을 활용하는 것을 기반으로 합니다. 구매하시면 M1 SNIPER 화살표 지표를 바로 다운로드하실 수 있습니다. 또한, 아래 스크린샷에 표시된 Apollo Dynamic SR 지표는 M1 SNIPER 도구를 사용하는 모든 사용자에게 무료로
FiboSniper Pro
Van Minh Nguyen
5 (4)
FiboSniper Pro – Multi-Filter Fibonacci System with Auto SL/TP and Control Panel FiboSniper Pro는 동적 Fibonacci Envelopes와 여러 확인 필터를 결합하여 선별된 Buy 및 Sell 신호를 생성하는 기술적 지표입니다. Fibonacci 레벨은 Moving Average와 ATR을 기반으로 계산된 후 ADX, EMA, RSI, ATR, Volume, Time 및 Candle 구조를 통해 필터링됩니다. 이 지표는 ATR 기반의 자동 Stop Loss 및 Take Profit 레벨을 차트에 직접 표시하며, 빠른 설정 조정을 위한 인터랙티브 Control Panel을 제공합니다. 구매 후 MQL5 메시지로 저에게 연락하시면 Auto Trader X를 무료로 받으실 수 있으며, 이 지표의 거래 신호를 자동화하는 방법에 대한 안내도 제공됩니다. User Guide 및 Set Files: [Click here
Auto Optimized SpeedAngle 은 지속적인 워크포워드 최적화(Walk-Forward Optimization, WFO)를 통해 곡선 적합(curve-fitting)을 제거한 기관 수준의 모멘텀 벡터화 시스템입니다. 시장 체제가 바뀔 때 성능이 떨어지는 정적 입력에 의존하는 대신, 이 지표는 표본 외(Out-of-Sample, OOS) 검증을 사용하여 매개변수를 동적으로 재보정하며, 표시되는 신호가 과거의 우연이 아닌 진정한 통계적 우위를 나타내도록 보장합니다. 핵심 기관용 프레임워크 워크포워드 최적화 엔진: 핵심 알고리즘은 수천 가지의 룩백(lookback) 및 임계값 조합을 지속적으로 스캔하며, 데이터를 인샘플(in-sample)과 표본 외(out-of-sample) 세트로 엄격하게 분리합니다. 미지의 데이터 환경에서 수학적 우수성이 증명된 경우에만 새로운 매개변수 구성을 채택합니다. 정량적 목적 함수: 순수한 총이익을 쫓는 대신, 최적화 엔진은 기관 수준의 안정성
Adaptive Price Action Engine 지표를 구매하면 EA(자동매매 프로그램)가 무료 멀티 타임프레임 기반 자기 최적화 추세 & 캔들 패턴 분석 시스템 시장은 끊임없이 변화하며, 모든 Price Action 패턴이 모든 시장 환경에서 동일한 가치를 가지는 것은 아닙니다. Adaptive Price Action Engine 은 변화하는 시장 환경에 적응할 수 있도록 설계되었으며, 추세 구조, 멀티 타임프레임 분석, 캔들 패턴 및 통계적 최적화 를 하나의 분석 프레임워크로 결합합니다. 두 가지 적응형 모드 Dual Alpha Trend Mode 낮은 타임프레임과 높은 타임프레임에서 적합한 Alpha Trend 파라미터를 자동으로 탐색하여, 최근 시장 움직임에 맞춰 추세 분석을 조정합니다. Candlestick + Alpha Mode Alpha Trend를 통한 시장 국면 분석과 22개의 상승 및 하락 캔들 패턴 을 결합합니다. 모든 패턴을 동일하게 취급하는 대신, 다양
Crystal Heikin Ashi Signals
Muhammad Jawad Shabir
5 (5)
Crystal Heikin Ashi Signals—Professional Trend & Signal Detection Indicator Advanced Heikin Ashi Visualization with Intelligent Signal System for Manual & Automated Trading Final Price: $149 ---------> Price goes up $10 after every 10 sales . Limited slots available — act fast . Overview User Guide PDF Crystal Heikin Ashi Signals is a professional-grade MetaTrader 5 indicator that combines pure Heikin Ashi candle visualization with an advanced momentum-shift detection system. Designed for both m
Scalper Vault MT5
Oleg Rodin
5 (1)
Scalper Vault는 당일 매매(intraday trading)에서 일관된 성과를 내고자 하는 트레이더를 위해 설계된, 강력하고 모든 기능을 갖춘 트레이딩 시스템입니다. 이 고정밀 지표는 외환(Forex) 및 바이너리 옵션 트레이더 모두에게 기관급 분석을 제공하는 독립적인 종합 트레이딩 시스템 역할을 합니다. 구매 후 저에게 연락해 주시면, 트레이딩 팁과 함께 특별한 보너스를 제공해 드립니다! Scalper Vault는 추측에 의존하거나 복잡한 수동 분석을 할 필요를 없애주며, 사용하기 쉬운 트레이딩 기법을 통해 오직 매매 실행에만 집중할 수 있도록 돕습니다. 정확한 추세 추종 신호: 핵심 알고리즘이 시장 구조를 분석하여, 지배적인 시장 추세 방향과 일치하는 고확률 신호만을 제공함으로써 잘못된 진입을 획기적으로 줄여줍니다. 정밀한 고점 및 저점 탐지: 시장의 움직임이 소진되는 지점을 스캔하여 잠재적인 반전 구간을 식별합니다. 간(Gann) 이론 기반의 매수/매도 구간: 수학적
Trend Catcher ind mt5
Ramil Minniakhmetov
5 (18)
트렌드 캐처 인디케이터 트렌드 캐처 인디케이터는 개발자가 자체 개발한 맞춤형 적응형 트렌드 분석 지표들을 조합하여 시장 가격 움직임을 분석합니다. 단기적인 노이즈를 제거하고 근본적인 모멘텀 강도, 변동성 확대, 가격 구조 움직임에 집중하여 진정한 시장 방향을 파악합니다. 또한 이동 평균, RSI, 변동성 필터와 같은 맞춤형 지표들을 활용하여 가격을 평활화하고 트렌드를 필터링합니다. 실제 운영 모니터링 및 기타 제품은 다음 링크에서 확인하실 수 있습니다:   https://www.mql5.com/en/users/mechanic/seller 텔레그램에서는 EA나 설정 파일을 판매하지 않습니다. 사기이니 주의하세요. 모든 설정 파일은 블로그에서 무료로 제공됩니다. 중요! 구매 후 즉시 연락 주시면 사용 방법 및 보너스를 드립니다!
Atomic Analyst MT5
Issam Kassas
4.5 (64)
Atomic Analyst — MetaTrader 5 구매 후 MQL5에서 저에게 메시지를 보내시면 Smart Universal Expert Advisor를 무료로 받으실 수 있으며, 온라인 강좌, PDF 매뉴얼 및 비공개 그룹 이용 권한도 함께 제공됩니다. Atomic Analyst는 가격 움직임 분석, 추세 방향, 진입·청산 신호, 손절 수준, 여러 익절 수준을 차트에 모아 보여줍니다. 신호를 확인하고 매매 상황을 이해하세요 Atomic Analyst는 분석 결과를 명확한 시각 정보로 정리합니다. • 잠재적인 진입 기회를 확인할 수 있는 매수·매도 화살표. • 거래 계획에 도움이 되는 손절 수준과 여러 익절 수준. • 시장 방향을 평가할 수 있는 추세, 강도, 모멘텀 수치. • 더 넓은 시장 맥락을 비교할 수 있는 여러 시간대 분석. • 변화하는 시장 상황을 따라갈 수 있는 색상별 캔들과 알림. 신호와 보조 분석을 함께 검토한 다음, 해당 매매 상황이 자신의 거래 규칙에
Unix Scalper
Issam Kassas
4 (4)
Unix Scalper — MetaTrader 5 구매 후 MQL5에서 저에게 메시지를 보내시면 Smart Universal Expert Advisor를 무료로 받으실 수 있으며, 온라인 강좌, PDF 매뉴얼 및 비공개 그룹 이용 권한도 함께 제공됩니다. 매매 기회를 찾고, 거래 계획을 확인하고, 실행 방법을 선택하세요. UNIX Scalper는 시장 분석, BUY/SELL/WAIT 판단, Entry, Stop Loss, TP1 및 TP2 가격 수준을 하나의 정돈된 패널에 제공합니다. 신호와 거래 계획을 한눈에 • 명확한 판단: BUY, SELL 또는 WAIT. • 구체적인 가격 수준: Entry, Stop Loss, TP1 및 TP2. • 다중 시간대 개요: 패널의 여러 시간대 신호를 비교하세요. • 판단을 돕는 분석: 추세, 모멘텀, 거래량, 변동성, 지지와 저항, 시장 품질. • 다양한 레이아웃: Minimized, Compact, Standard 또는 Full. 신호와
SIO Oscillator
Davit Beridze
SIO Oscillator: 자기 최적화 세미분산 불균형 오실레이터 지표를 구매하시면 이를 기반으로 한 전문가 어드바이저(EA)를 무료로 받으실 수 있습니다. 대부분의 오실레이터는 모든 가격 움직임을 똑같이 취급합니다. SIO는 상승 압력과 하락 압력을 분리하여 둘 사이의 불균형을 측정하고, 매수자와 매도자 중 어느 쪽이 실제로 시장을 주도하고 있는지 보여줍니다. 불균형이 극단에 도달하면 SIO는 진입가, 손절(Stop Loss), 익절(Take Profit) 수준이 포함된 명확한 신호를 표시합니다. SIO의 차별점은 고정된 설정에 의존하지 않는다는 것입니다. 내장된 자기 최적화 엔진이 현재 종목과 시간 프레임에 맞는 파라미터를 지속적으로 탐색하고, 사용하기 전에 검증합니다. 두 가지 신호 모드 평균 회귀(Mean Reversion): 불균형의 극단에서 거래하며 균형으로의 복귀를 노립니다. 추세 추종(Trend Following): 지속적이고 우세한 불균형의 방향으로 거래합니다. 자
Volatility Master for MetaTrader is a real-time dashboard tool that scans up to  50 symbols  to identify high-volatility , trending markets instantly. With bullish/bearish signals, customizable alerts, and a user-friendly interface, it helps you avoid range-bound conditions and focus on high-probability trades. Clarity leads to confidence. Trade confidently and protect your capital effectively with this powerful dashboard. We don't offer free or bonus indicators in exchange of reviews from you.
Smc Pro ToolKit
Talal N Z Aljarusha
5 (14)
SMC PRO TOOLKIT — SMART MONEY ANALYSIS & STRUCTURED TRADE PLANNING SMC Pro ToolKit is a professional Smart Money Concepts analysis workspace for MetaTrader 5. It combines market structure, multi-timeframe analysis, institutional price zones, setup evaluation, confirmation tools, volume context, alerts, and risk planning inside one organized chart environment. One workspace. Multiple layers of confirmation. One structured trading plan. OPEN COMPLETE USER GUIDE MULTI-CONDITION SETUP ENGINE At
Dynamic Forex28 Navigator MT5
Bernhard Schweigert
5 (1)
다중 통화 강도 및 모멘텀 지표 MT5 Dynamic Forex28 Navigator는 오랫동안 사랑받아 온 저희 지표의 진화 버전으로, 세 가지 기능을 하나로 결합했습니다: Advanced Currency Strength28 Indicator (리뷰 700개) Advanced Currency IMPULSE with ALERT (리뷰 530개) CS28 Combo Signals (최근 보너스) 두 이전 지표는 MQL5 Market에서 합계 1,200개가 넘는 리뷰를 받았으며 2016년부터 MT4 커뮤니티의 필수품이었습니다. Dynamic Forex28 Navigator MT5는 검증된 동일한 로직을 그대로 이어갑니다. MetaTrader 5를 위해 완전히 다시 제작 – MT5의 네이티브 다중 심볼 아키텍처를 최대한 활용하도록 설계되었습니다. 사용 설명서: https://www.mql5.com/en/blogs/post/758844 MT4 버전을 찾고 계신가요? 여기를 클릭하세요: ht
AriFocus
Temirlan Kdyrkhan
AriFocus - Non-Repainting Buy/Sell Signals AriFocus - one clear signal. AriFocus marks buy and sell signals directly on the chart and suggests a stop-loss level for each one. Every signal is confirmed on bar close and never repaints. - Buy/sell arrows, confirmed on bar close - Suggested stop-loss level for every signal - Trend band and candle coloring to show direction at a glance - 10 ready-made presets, or your own settings (14 calculation methods) - Pop-up, push and email alerts with entr
Neuro Poseidon MT5
Daria Rezueva
4.68 (53)
Neuro Poseidon is a new indicator by Daria Rezueva. It combines precise trading signals with adaptive TP/SL levels - creating best possible trades as a result! Message me and get  Neuro Poseidon Assistant  as a gift to automize your trading process! What makes it stand out? 1. Proven profitability on all assets and timeframes 2. Only confirmed BUY and SELL signals present on the chart 3. Adaptive TP & SL levels generated by the software for each trade 4. Easy to understand - suitable for al
PZ Swing Trading MT5
PZ TRADING SLU
5 (5)
Protect against whipsaws: revolutionize your swing trading approach Swing Trading is the first indicator designed to detect swings in the direction of the trend and possible reversal swings. It uses the baseline swing trading approach, widely described in trading literature. The indicator studies several price and time vectors to track the aggregate trend direction and detects situations in which the market is oversold or overbought and ready to correct. [ Installation Guide | Update Guide | Tro
제작자의 제품 더 보기
Stochastic Divergen MT5
Komang Putra Riswanjaya
2 (1)
Overview The Stochastic Divergence Indicator is a tool designed to help identify potential market turning points by analyzing divergences between price and the Stochastic Oscillator. It highlights divergence signals visually on the chart, assisting traders in observing possible trend changes. Key Features No Repaint: Once a signal is formed, it remains on the chart. Adjustable Parameters: Settings can be modified to fit different trading preferences and timeframes. Visual Display: Arrows are plo
Iceberg Divergen MT5
Komang Putra Riswanjaya
3.5 (2)
Iceberg Divergen Indicator Uncover the hidden opportunities beneath the surface. Overview Divergences in the Awesome Oscillator (AO) often signal powerful market reversals, yet spotting them manually can be challenging and time-consuming. Missing out on these opportunities can cost traders valuable entry points. That’s why we created the   Iceberg Divergence Indicator   — a powerful tool that precisely detects both regular and hidden divergences in AO. With Iceberg Divergence, you won’t just id
FREE
Darvas Flow Indicator
Komang Putra Riswanjaya
5 (3)
Darvas Flow Indicator is a revolutionary trading indicator that combines the classic Darvas Box method with modern market flow analysis. Developed for serious traders, Darvas Flow offers a powerful and intuitive tool for identifying trading opportunities. Key Features: Darvas Box Method Implementation: Darvas Flow automatically identifies Darvas boxes, allowing you to see crucial support and resistance levels. This helps in pinpointing optimal entry and exit points in your trades. Dynamic Flow
FREE
MA Ribbon Flow MT5
Komang Putra Riswanjaya
MA Ribbon Flow MA Ribbon Flow is a trend visualization indicator that combines 20 Moving Averages into a single ribbon-like structure. The purpose of this indicator is to help traders validate whether a trend has truly changed direction or if the market is only experiencing temporary pullbacks or noise. By observing the flow, alignment, and spacing between the MA ribbons, traders can identify: Trend strength Trend continuation Potential reversals Momentum expansion and weakening The indicator
FREE
Iceberg Divergen Indicator
Komang Putra Riswanjaya
5 (3)
Iceberg Divergence Indicator will help traders to find divergent patterns that occur on the charts very easily and simply This indicator will visualize divergences pattern that occur on the chart by combining it with an awesome oscillator indicator Key Features Easy to use : The Iceberg divergent indicator is made as simple as possible so that it is easy to use Pattern Visualization : Divergent patterns will be visualized on the live chart Precision : The indicator detects divergent patterns wi
FREE
MA Ribbon Flow MT4
Komang Putra Riswanjaya
MA Ribbon Flow MA Ribbon Flow is a trend visualization indicator that combines 20 Moving Averages into a single ribbon-like structure. The purpose of this indicator is to help traders validate whether a trend has truly changed direction or if the market is only experiencing temporary pullbacks or noise. By observing the flow, alignment, and spacing between the MA ribbons, traders can identify: Trend strength Trend continuation Potential reversals Momentum expansion and weakening The indicator
FREE
Darvas Flow
Komang Putra Riswanjaya
5 (1)
Darvas Flow Indicator is a revolutionary trading indicator that combines the classic Darvas Box method with modern market flow analysis. Developed for serious traders, Darvas Flow offers a powerful and intuitive tool for identifying trading opportunities. Key Features Darvas Box Method Implementation : Darvas Flow automatically identifies Darvas boxes, allowing you to see crucial support and resistance levels. This helps in pinpointing optimal entry and exit points in your trades. Dynamic Flow
FREE
Renko Flow MT5
Komang Putra Riswanjaya
Renko Flow Are you a trader who loves using Renko charts? Unfortunately, MetaTrader does not provide an easy built-in way to display Renko charts directly. That’s why Renko Flow was created — to give traders a simple and practical way to use Renko-style visualization without needing complicated external tools or offline charts. Renko Flow can visualize Renko charts directly inside a separate window, allowing you to analyze Renko movement while still keeping your original price chart clean and
FREE
Awesome MACD Indicator
Komang Putra Riswanjaya
5 (1)
AWESOME MACD INDICATOR Awesome MACD Indicator is a powerful trading tool that combines the strengths of Moving Average (MA) and Moving Average Convergence Divergence (MACD) to provide accurate and reliable trading signals. Designed for forex and stock traders, this indicator simplifies the identification of trading opportunities by detecting significant crosses in price movements. Key Features: MA and MACD Combination: Awesome MACD leverages the power of Moving Averages (MA) to identify short-te
FREE
Period Breakout Indicator
Komang Putra Riswanjaya
5 (1)
Overview The Period Breakout Indicator is a versatile tool designed for traders seeking to identify breakout opportunities based on customizable time periods. This indicator automatically determines the highest and lowest prices within a user-defined period, allowing you to tailor it precisely to your trading strategy. Key Features Customizable Time Periods: Define the start and end times based on your preferred trading hours or any specific period. The indicator will then calculate the highest
FREE
Awesome Pivot Indicator
Komang Putra Riswanjaya
4 (1)
The Pivot Indicator is a vital tool for technical analysis used by traders in the financial markets. Designed to assist in identifying potential reversal points or trend changes, this indicator provides valuable insights into key levels in the market. Key features of the Pivot Indicator include: Automatic Calculations: The Pivot Indicator automatically calculates Pivot Point, Support, and Resistance levels based on the previous period's high, low, and close prices. This eliminates the complexity
FREE
Period Breakout Indicator MT5
Komang Putra Riswanjaya
Overview The Period Breakout Indicator is a versatile tool designed for traders seeking to identify breakout opportunities based on customizable time periods. This indicator automatically determines the highest and lowest prices within a user-defined period, allowing you to tailor it precisely to your trading strategy. Key Features Customizable Time Periods:   Define the start and end times based on your preferred trading hours or any specific period. The indicator will then calculate the highes
FREE
Awesome Moving Average
Komang Putra Riswanjaya
Overview Discover a powerful yet simple indicator to identify market trends effectively!  Awesome Moving Average (AWMA)  is designed to detect bullish or bearish trends by analyzing price breakouts beyond the moving average line. Basically, the way this indicator works is similar to the Moving Average indicator available on the MetaTrader platform. As we know, the Moving Average indicator tends to be difficult to use when the market is in a sideways condition because it often gives false breakou
FREE
Awesome Pivot Indicator MT5
Komang Putra Riswanjaya
The Pivot Indicator is a vital tool for technical analysis used by traders in the financial markets. Designed to assist in identifying potential reversal points or trend changes, this indicator provides valuable insights into key levels in the market. Key features of the Pivot Indicator include: Automatic Calculations: The Pivot Indicator automatically calculates Pivot Point, Support, and Resistance levels based on the previous period's high, low, and close prices. This eliminates the complexity
FREE
RR Visualizer
Komang Putra Riswanjaya
RR Visualizer - Enhance Your MT4 Risk Management RR Visualizer   is an essential MT4 utility for traders looking to optimize their risk management effortlessly.  This tool calculates the ideal lot size based on your preferred risk percentage and the custom stop-loss distance you set, giving you full control over your money management. Designed with a user-friendly and attractive interface,  RR Visualizer  keeps the focus on your trading, not on complex calculations. Key Features Customizable Ris
FREE
Awesome Market Structure
Komang Putra Riswanjaya
The market structure indicator helps traders easily read market trends, this indicator shows trend continuity and trend reversals, this tool will be very useful for beginners who are just getting to know market structure, the indicator will provide visualization of the patterns that occur Key Features: 1. BOS pattern: The indicator will provide an overview of the Break Of Structure pattern, where the pattern will indicate the continuation of the trend 2. CHOCH Pattern: The indicator will provi
Simple Market Structure MT4
Komang Putra Riswanjaya
SMS | Simple Market Structure Simple Market Structure is an indicator designed to represent market structure in a simple, clean, and easy-to-understand way. Many market structure indicators available today are overly complicated and filled with unnecessary visuals, making them difficult to understand — especially for traders who want to quickly identify market direction and structure. That is why this indicator was created. This indicator focuses only on the essential components: Bullish/Bearis
Stochastic Divergen MT4
Komang Putra Riswanjaya
Overview The Stochastic Divergence Indicator is a tool designed to help identify potential market turning points by analyzing divergences between price and the Stochastic Oscillator. It highlights divergence signals visually on the chart, assisting traders in observing possible trend changes. Key Features No Repaint: Once a signal is formed, it remains on the chart. Adjustable Parameters: Settings can be modified to fit different trading preferences and timeframes. Visual Display: Arrows are pl
Sideway Box Indicator
Komang Putra Riswanjaya
Sideway Box Indicator The Sideway Box Indicator is an advanced trading tool designed to help traders identify and capitalize on sideways market conditions. This powerful indicator detects periods when the market is in a sideways (ranging) phase, providing traders with clear visual cues. Key Features: Sideways Market Detection : The Sideway Box Indicator accurately identifies sideways market conditions, allowing traders to recognize when the price is consolidating within a specific range. Buy/Sel
Candle Pattern Pro
Komang Putra Riswanjaya
Description : In the world of trading, candlestick patterns are a popular technical analysis tool used by many traders.   There are numerous candlestick patterns, ranging from reversal patterns to continuation patterns. However, remembering all these patterns can be challenging, especially for novice traders. This often leads to traders having to manually memorize and identify candlestick patterns, which can be time-consuming and prone to errors. Candle Pattern Pro is a powerful indicator design
QQE Divergen MT4
Komang Putra Riswanjaya
QQE Divergen – Advanced Trading Indicator Overview The  QQE (Quantitative Qualitative Estimation)  indicator is a powerful trading tool designed to enhance trend detection and market momentum analysis. QQE is an advanced version of the RSI (Relative Strength Index) that utilizes  smoothed moving averages  and  dynamic trailing levels  to generate highly accurate signals. QQE Divergen  improves upon the traditional QQE by integrating divergence detection, making it even more effective for identi
MACD Divergen MT4
Komang Putra Riswanjaya
Overview The MACD Divergence Indicator is a powerful tool designed to detect potential trend reversals by analyzing divergences between price action and the MACD (Moving Average Convergence Divergence) indicator. It automatically identifies and highlights bullish and bearish divergence signals directly on the chart, making it easier for traders to spot high-probability trading opportunities. Key Features Customizable Settings: Includes adjustable parameters to suit various trading styles and tim
Break And Retreace MT4
Komang Putra Riswanjaya
Break & Retrace   is a smart price action indicator designed to help traders identify the most important market events after a support or resistance level is formed. Instead of drawing countless lines on your chart, the indicator automatically highlights key breakout opportunities, detects fake breakouts, and confirms retracement entries with a clean and easy-to-read interface. Whether you're a breakout trader or prefer waiting for pullbacks, Break & Retrace gives you the signals you need witho
Simple Double Top MT4
Komang Putra Riswanjaya
Simple Double Top is a lightweight and user-friendly indicator designed to automatically detect Double Top and Double Bottom reversal patterns with a clean and intuitive visualization. Despite its name,   Simple Double Top   detects   both Double Top and Double Bottom patterns , helping traders identify potential bullish and bearish reversal opportunities with ease. Instead of cluttering your chart with unnecessary objects, the indicator focuses on displaying only the essential information. Once
Awesome Market Structure MT5
Komang Putra Riswanjaya
OVERVIEW The market structure indicator helps traders easily read market trends, this indicator shows trend continuity and trend reversals, this tool will be very useful for beginners who are just getting to know market structure, the indicator will provide visualization of the patterns that occur Key Features: BOS pattern The indicator will provide an overview of the Break Of Structure pattern, where the pattern will indicate the continuation of the trend.  CHOCH Pattern The indicator will pr
SidewayBox MT5
Komang Putra Riswanjaya
Sideway Box Indicator The Sideway Box Indicator is an advanced trading tool designed to help traders identify and capitalize on sideways market conditions. This powerful indicator detects periods when the market is in a sideways (ranging) phase, providing traders with clear visual cues. Key Features Sideways Market Detection : The Sideway Box Indicator accurately identifies sideways market conditions, allowing traders to recognize when the price is consolidating within a specific range. Buy/Sel
Candle Pattern Pro MT5
Komang Putra Riswanjaya
Description : In the world of trading, candlestick patterns are a popular technical analysis tool used by many traders.   There are numerous candlestick patterns, ranging from reversal patterns to continuation patterns. However, remembering all these patterns can be challenging, especially for novice traders. This often leads to traders having to manually memorize and identify candlestick patterns, which can be time-consuming and prone to errors. Candle Pattern Pro is a powerful indicator desig
QQE Divergen MT5
Komang Putra Riswanjaya
QQE Divergen – Advanced Trading Indicator Overview The  QQE (Quantitative Qualitative Estimation)  indicator is a powerful trading tool designed to enhance trend detection and market momentum analysis. QQE is an advanced version of the RSI (Relative Strength Index) that utilizes  smoothed moving averages  and  dynamic trailing levels  to generate highly accurate signals. QQE Divergen  improves upon the traditional QQE by integrating divergence detection, making it even more effective for identif
MACD Divergen MT5
Komang Putra Riswanjaya
Overview The MACD Divergence Indicator is a powerful tool designed to detect potential trend reversals by analyzing divergences between price action and the MACD (Moving Average Convergence Divergence) indicator. It automatically identifies and highlights bullish and bearish divergence signals directly on the chart, making it easier for traders to spot high-probability trading opportunities. Key Features Customizable Settings: Includes adjustable parameters to suit various trading styles and ti
Simple Market Structure MT5
Komang Putra Riswanjaya
SMS | Simple Market Structure Simple Market Structure is an indicator designed to represent market structure in a simple, clean, and easy-to-understand way. Many market structure indicators available today are overly complicated and filled with unnecessary visuals, making them difficult to understand — especially for traders who want to quickly identify market direction and structure. That is why this indicator was created. This indicator focuses only on the essential components: Bullish/Bearis
필터:
리뷰 없음
리뷰 답변