Range Premium

  • 지표
  • Sy Hien Nguyen
    Sy Hien Nguyen
    3 (2)
    Hello, my name is Hiển, and I currently work as a factory manager. However, my passion lies in trading during my free time. Apart from my main job, I also manage a few small funds and personal accounts. Due to the nature of my work, which involves constant exposure to data and contexts, this has
  • 버전: 1.0
  • 활성화: 5

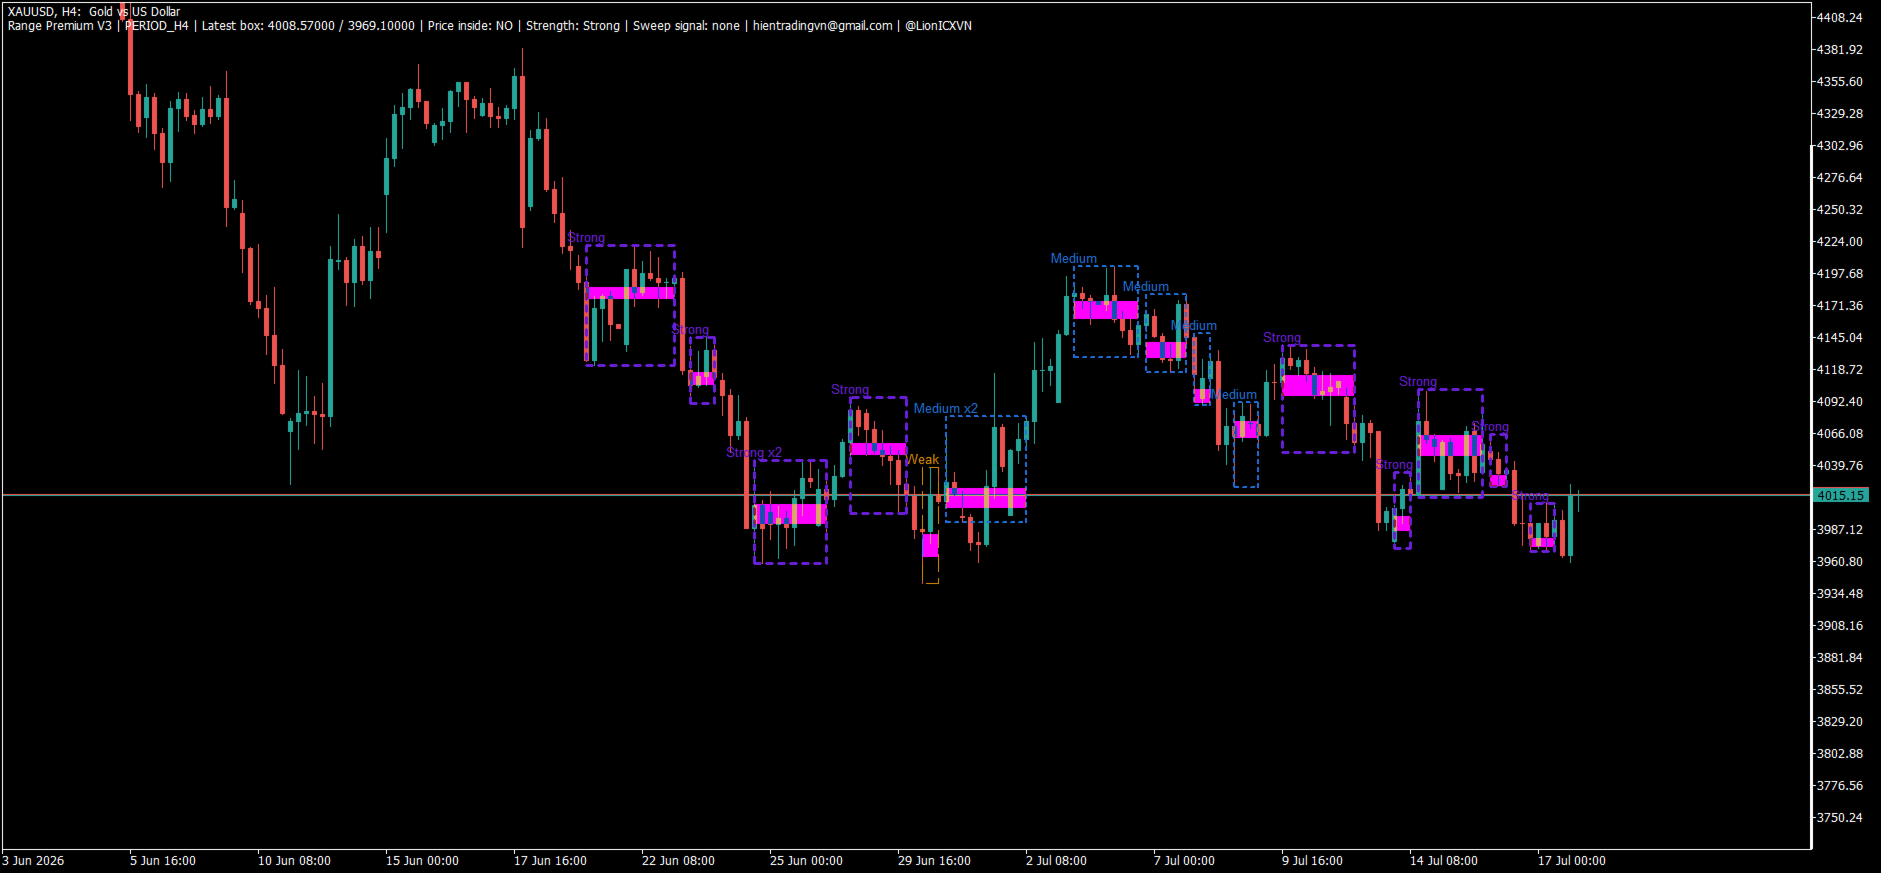
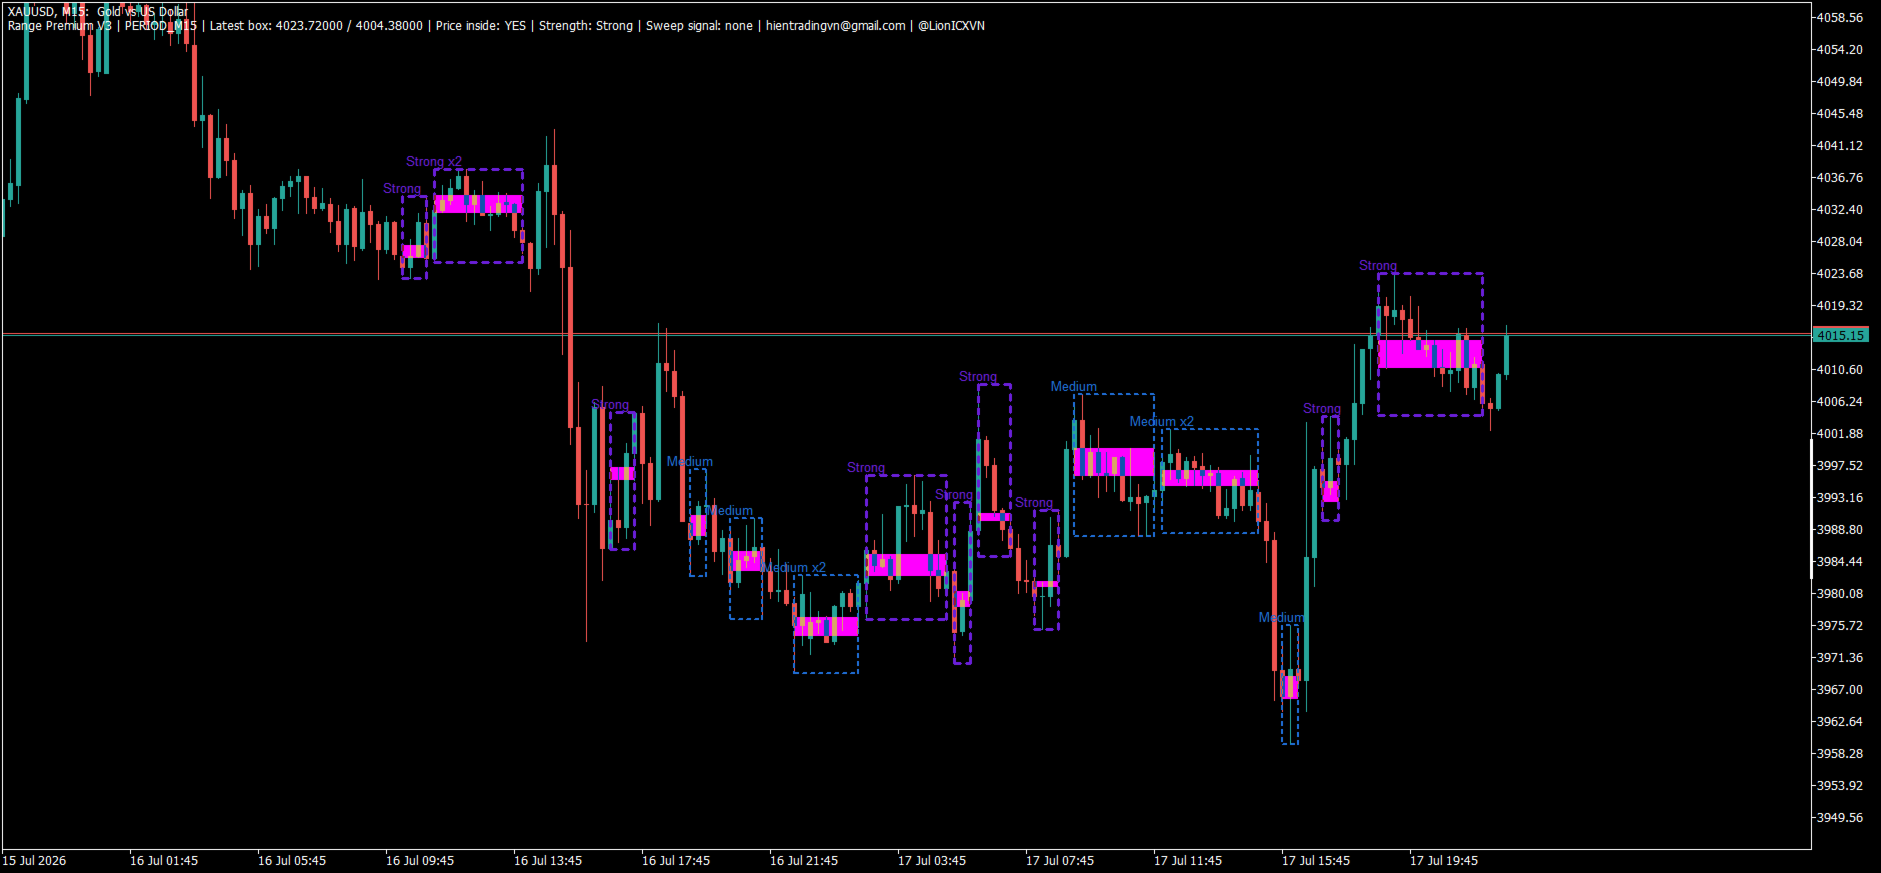
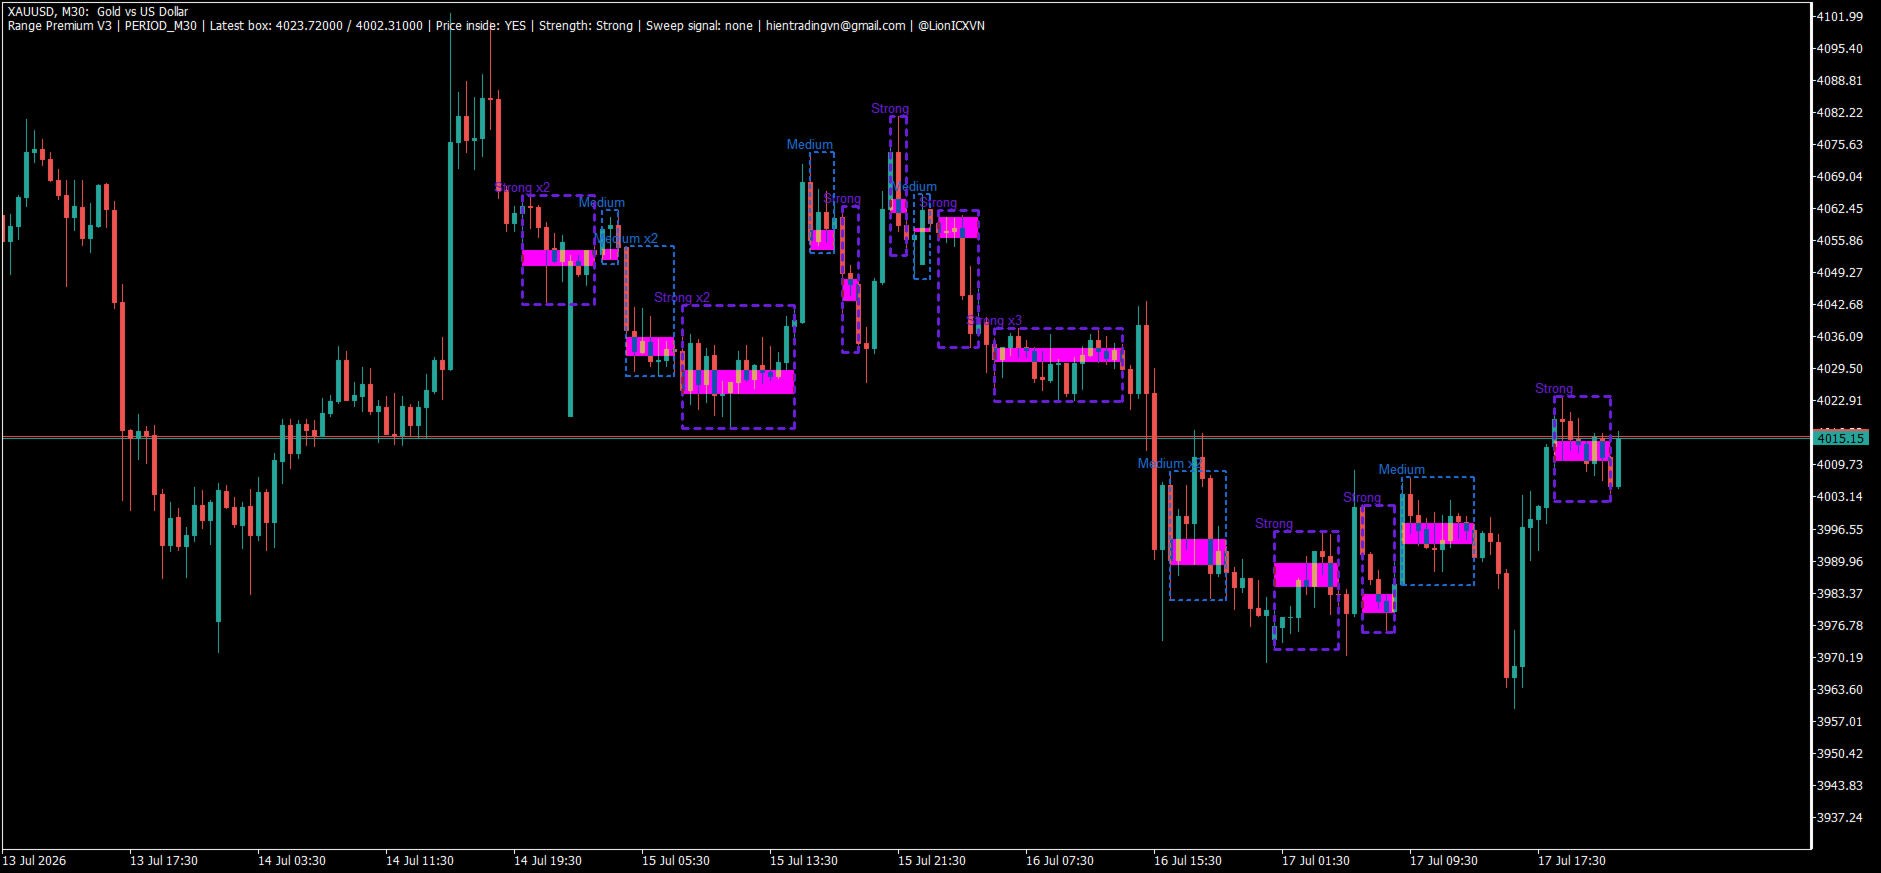
RANGE PREMIUM V3

See Price Zones Clearly — Understand Market Behavior

Range and Box trading has long been the foundation of many effective trading methods.

Before a major price move begins, the market often goes through a period of balance, accumulation, and conflict between buyers and sellers. However, identifying meaningful ranges, filtering out noise, and understanding price reactions around the box boundaries is not always easy.

Range Premium V3 was developed to simplify this process.

The indicator automatically highlights important balance zones on the chart, helping traders:

  • Reduce the time spent drawing and adjusting boxes manually.

  • Avoid overly subjective analysis.

  • Distinguish ranges by their level of importance.

  • Identify the central balance area inside each range.

  • Monitor price reactions at the upper and lower boundaries.

  • Better understand liquidity sweeps, price rejection, and breakouts.

Trading Applications

1. Range-Bound Trading

Trade while price continues to move within the box.

Traders may look for buying opportunities near the lower boundary and take profit near the upper boundary, or apply the opposite approach when market conditions support it.

2. Range Reversal

Watch for situations where price sweeps beyond a box boundary but fails to continue, then quickly returns inside the range.

This behavior may indicate a liquidity sweep, false breakout, or reversal reaction at the edge of the box.

3. Range Breakout

When price clearly exits the accumulation zone and remains outside the box, traders may use the range as a reference for following the new trend or waiting for a breakout retest.

4. Range Swing

Traders may capture price swings between the upper boundary, lower boundary, and central balance area.

This approach makes market structure easier to read and helps traders prepare clearer trading scenarios.

Core Value

Range Premium V3 is more than a box-drawing tool.

It helps traders identify:

  • Where the market is currently balanced.

  • Which zones deserve priority.

  • Where price is positioned within the range.

  • Whether the market is accepting or rejecting a boundary.

  • When accumulation is continuing.

  • When a new price movement may be developing.

Range Premium V3 is suitable for traders using:

  • Price Action.

  • Support and Resistance.

  • Supply and Demand.

  • Smart Money Concepts.

  • Breakout and false-breakout strategies.

  • Multi-timeframe analysis.

The main purpose of the indicator is to help traders reduce analysis time, limit subjectivity, and gain a deeper understanding of real market behavior.

Range Premium V3 will continue to evolve, bringing traders increasingly powerful, intuitive, and practical features.

See the Range. Understand the Market. Trade with Clarity.

추천 제품
Liquidity Map
Alex Amuyunzu Raymond
Liquidity Map  Overview The Liquidity Map indicator is an advanced visualization tool based on ICT Smart Money Concepts . It automatically identifies daily Buy Zones , Sell Zones , and Liquidity Levels , showing where price is likely to reverse or continue based on institutional order flow. It calculates key levels from the daily session — such as the previous day’s high, low, and midpoint — then derives a premium (sell bias) and discount (buy bias) structure. When price trades into these mapped
Elliott Wave Pro
Timothy Chuma Ifiora
Elliot Wave Pro is an MT5 indicator that automatically detects Elliott Wave structures (impulse and corrective behavior) and calculates key Fibonacci-based retracement/limit levels from the most recent completed wave. It helps turn wave structure into a tradable setup: enter on the pullback, target Wave 1 , and place your stop beyond the wave high / invalidation level . That gives you a clear risk-to-reward model where a single valid setup can outweigh multiple small losses. In short, it shows w
DayRange Pro
Noel Anjao Alube
DayRange Pro — Know Your Boundaries Before Price Does Every trading session has a ceiling and a floor it statistically respects — most of the time. DayRange Pro is a precision MT5 indicator built to calculate, visualize, and alert you to that session's Expected Daily Range (EDR) before price gets there, not after. Instead of guessing where today's high or low might form, DayRange Pro combines two of the most respected volatility and structure concepts in technical trading — the previous day's Hi
제목: Auto Multi Support & Resistance Pro - 스마트 다중 지지저항 [설명] 더 이상 지지선과 저항선을 수동으로 그리지 마세요! 'Auto Multi Support & Resistance Pro'는 스캘핑과 데이트레이딩을 위한 가장 정확한 주요 타점을 알고리즘이 자동으로 찾아줍니다. 골드(XAUUSD), 나스닥 등 변동성이 크고 휩소가 잦은 종목의 분봉(M1, M5, M15)에 완벽하게 최적화되어 있습니다. [주요 기능] 1. 다중 라인 자동 생성: 설정한 개수만큼 유의미한 지지와 저항 라인을 여러 개 그려줍니다. 2. 스마트 간격 필터(Smart Distance Filter): 좁은 구간에 선이 지저분하게 뭉치는 현상을 방지하여 깔끔한 차트를 유지합니다. 3. 민감도 조절 기능: 탐색 캔들 수를 직접 조절하여 내 매매 스타일에 맞는 고점/저점을 판별합니다. 4. 초경량 로직: 컴퓨터 리소스를 거의 차지하지 않아 차트 지연(Lag) 현상이 전혀 없습
mql4 version:  https://www.mql5.com/en/market/product/44606   Simple indicator to calculate profit on fibonacci retracement levels with fixed lot size, or calculate lot size on fibonacci levels with fixed profit. Add to chart and move trend line to set the fibonacci retracement levels. Works similar as default fibonacci retracement line study in Metatrader. Inputs Fixed  - select what value will be fix, lot or profit Fixed value  - value that will be fix on all levels Levels  - levels for which
Unlock Market Insights: Dynamic Trend Analysis with Statistical Precision for MT5 Are you seeking a deeper understanding of market movements? Many traditional tools may not fully capture the complex, non-linear dynamics often seen in financial markets. This can sometimes lead to uncertainty in identifying subtle trend shifts. Introducing Adaptive PolyBands Optimizer – an advanced MQL5 indicator designed to enhance your market analysis. Unlike some conventional tools, Adaptive PolyBands Optimizer
FREE
Simple indicator to calculate fibonacci retracement levels on time. Add to chart and move trend line to set the fibonacci retracement levels. Inputs Levels  - levels for which to calculate values, separated by space, default are fibonacci levels Show time  - if true, time will be shown on levels Show date  - if true, date will be shown on levels Show fibonacci level  - if true, value of levels will be shown Fibonacci lines color  - color of levels Trend line color  - color of trend line which de
FREE
This indicator automatically detects internal & swing market structure, Fibonacci Retracement and Fibo Levels. Features Full internal & swing market structure labeling in real-time Fibonacci Retracement Fibonacci Levels After purchasing the indicator, the full source code is provided, and via indicator buffers it can be easily integrated into your Expert Advisors (EAs) for automated trading strategies.
Double Fractal Entry Bot trades automatically using fractal breakouts or rebounds. It detects precise entry points, places SL and TP based on market structure, and includes logic to manage risk and avoid false signals. Simple, smart, and powerful. This product is also available for MetaTrader 4 =>  https://www.mql5.com/en/market/product/143609 Double Fractal Entry Bot is an intelligent trading robot based on the proven logic of the Double Fractal Entry indicator. It analyzes price using upper a
Glider
Vitalii Zakharuk
The Glider indicator gives accurate and timely signals to enter and exit the transaction that appear on the current candle. Using the indicator is very simple. When a dot and a blue line appear, open a buy deal. When a dot and a red line appear, open a sell deal. The main purpose of this indicator is to determine the moments of entry and exit from transactions, therefore the Glider indicator will display only the trend line and entry points, i.e. displays displays the entry points to the marke
NEXA Donchian Break1 1. 제품 개요 NEXA Donchian Break는 Donchian Channel을 기반으로 가격 돌파 구간을 식별하고, 추가적인 기술 지표 필터를 통해 조건이 충족된 경우에만 거래를 시도하는 MetaTrader 5용 자동매매 Expert Advisor입니다. 본 제품은 서로 다른 필터 구조를 사용하는 두 가지 전략 모드를 제공합니다. 사용자는 입력 파라미터를 직접 조정하면서 Donchian 돌파 전략, 추세 필터, 거래량 필터, 손절 및 청산 구조의 관계를 비교하고 분석할 수 있습니다. 버전 1.10에는 핍 단위로 작동하는 고정형 트레일링 스톱 기능이 추가되었습니다. 사용자는 트레일링 시작 거리, 현재 가격과 손절가 사이의 거리, 손절가 이동 간격을 각각 설정할 수 있습니다. 본 제품은 학습 및 연구 목적의 무료 배포용으로 제작되었습니다. 본 제품은 특정 수익이나 성과를 보장하지 않습니다. 실제 결과는 시장 환경, 브로커 조건, 거래 비용,
FREE
"수동 채널 그리기? 더 이상은 아닙니다. 시장 구조가 자동으로 드러나게 하세요." "장기 가격대를 연중무휴 24시간 실시간으로 추적하세요." 실제 트레이더의 고충 피벗 포인트를 수동으로 식별하려면   시간과 노력이 많이 듭니다 . 적응하기 어려움   높은 변동성   및 정확한   신뢰할 수 있는 채널 아이디어 복사 "시장은 잠들지 않습니다. 왜 분석을 멈춰야 할까요?" "하루에 수십 개의 자산을 어떻게 관리하고 계신가요?" 핵심 주장 오토채널   시장 구조를 자동으로 읽어 수작업을 줄여줍니다. "기계의 정밀성과 인간의 직관으로 분석" 기술 분석 주요 기능 설명 자동 피벗 감지 지그재그 기반 실시간 분석 멀티 타임프레임 분석 강력한 신호를 위해 더 높은 시간대를 활용 채널 채점 시스템 볼륨, 각도, 길이, 중요도 등을 평가합니다. 유사성 필터링 깔끔한 UI를 위해 중복 채널 제거 동적 지그재그 감도 시장 범위 및 기간에 맞게 조정 시각적 하이라이트 중요도에
NEXA Camarilla Stretch PRO – 사용자 설명서 1. 개요 NEXA Camarilla Stretch PRO는 MetaTrader 5 플랫폼에서 실행되는 자동 매매 프로그램(Expert Advisor)입니다. 본 프로그램은 가격 데이터와 기술적 계산을 기반으로 시장 상태를 분석하고, 설정된 규칙에 따라 거래를 수행합니다. 2. 기능 설명 본 제품은 다음 기능을 제공합니다. 자동 진입 및 청산 기능 거래 조건 필터링 기능 시간 기반 거래 제어 기능 리스크 관리 기능 부분 청산 및 포지션 관리 기능 모든 기능은 사용자 입력값에 따라 동작합니다. 3. 작동 방식 프로그램은 다음 절차에 따라 작동합니다. 가격 데이터 및 지표 계산 거래 조건 확인 조건 충족 시 주문 실행 손절 및 이익실현 설정 적용 포지션 상태에 따른 관리 수행 4. 설치 방법 MetaTrader 5를 실행합니다. 데이터 폴더를 엽니다. MQL5 → Experts 폴더에 파일을 복사합니다. 플랫폼을 재시작하
TradingwievHeikenAshi
Volkan Mustafaoglu
Heikin Ashi Heikin Ashi is a charting technique that can be used to predict future price movements. It is similar to traditional candlestick charts. However, unlike a regular candlestick chart, the Heikin Ashi chart attempts to filter out some of the market noise by smoothing out strong price swings to better identify trend movements in the market. To create Heiken Ashi, a formula is used in which price data is entered, while ordinary candles are built only on bare numbers, without using any c
M1 Scalper Pro MT5
Elif Kaya
4.67 (12)
- Real price is 80$ - 50% Discount (It is 39$ now) Contact me for extra bonus   indicator, instruction or any questions! - Lifetime update free - Non-repaint - Related product: Gann Gold EA - I just sell my products in Elif Kaya Profile, any other websites are stolen old versions, So no any new updates or support. Advantages of  M1 Scalper Pro  Profitability: M1 Scalper Pro is highly profitable with a strict exit strategy. Frequent Opportunities: M1 Scalper Pro  takes advantage of numerous smal
Signal Eskiya mt5
Vitalii Zakharuk
Signal Eskiya, in addition to channel lines, reflects entry signals in the form of arrows. Trading strategies using the channel indicator belong to the classic methods of technical analysis, are easy to execute, and therefore available even to beginners. Price ranges work equally well on any trading assets and timeframes, they can be used both independently and with additional confirmation from oscillators and market volumes. American traders say: “Trend is your friend”, which means “Trend is
WhaleFinder MT5
Kazuya Yamaoka
Considering the main theories of Forex (Dow Theory, support lines, chart patterns, and Fibonacci retracements), It tells you the price range where whales (large investors) are likely to appear. You can trade at the price points that professionals also aim for. You no longer have to warry about where to aim next. We are live-streaming the actual operation of the system. Please check for yourself if it is usable. Please check it out for yourself. https://www.youtube.com/@ganesha_forex We do not
MetaForecast M5
Vahidreza Heidar Gholami
5 (3)
MetaForecast는 가격 데이터의 조화를 기반으로 모든 시장의 미래를 예측하고 시각화합니다. 시장이 항상 예측 가능한 것은 아니지만 가격에 패턴이 있다면 MetaForecast는 가능한 정확하게 미래를 예측할 수 있습니다. 다른 유사한 제품과 비교했을 때, MetaForecast는 시장 동향을 분석하여 더 정확한 결과를 생성할 수 있습니다. 입력 매개변수 Past size (과거 크기) MetaForecast가 미래 예측을 생성하기 위한 모델을 만드는 데 사용하는 막대의 수를 지정합니다. 모델은 선택한 막대 위에 그려진 노란색 선으로 표시됩니다. Future size (미래 크기) 예측해야 할 미래 막대의 수를 지정합니다. 예측된 미래는 핑크색 선으로 표시되며 그 위에 파란색 회귀선이 그려집니다. Degree (차수) 이 입력은 MetaForecast가 시장에서 수행할 분석 수준을 결정합니다. Degree 설명  0 차수 0의 경우, "Past size" 입력에 모든 봉우리와
CChart
Rong Bin Su
Overview In the fast-paced world of forex and financial markets, quick reactions and precise decision-making are crucial. However, the standard MetaTrader 5 terminal only supports a minimum of 1-minute charts, limiting traders' sensitivity to market fluctuations. To address this issue, we introduce the Second-Level Chart Candlestick Indicator , allowing you to effortlessly view and analyze market dynamics from 1 second to 30 seconds on a sub-chart. Key Features Support for Multiple Second-Level
Neuro Poseidon MT5
Daria Rezueva
4.8 (54)
Neuro Poseidon is a new indicator by Daria Rezueva. It combines precise trading signals with adaptive TP/SL levels - creating best possible trades as a result! Message me and get  Neuro Poseidon Assistant  as a gift to automize your trading process! What makes it stand out? 1. Proven profitability on all assets and timeframes 2. Only confirmed BUY and SELL signals present on the chart 3. Adaptive TP & SL levels generated by the software for each trade 4. Easy to understand - suitable for al
Horizontal Level
Oleksii Ferbei
Horizontal Level indicator - reflects, using a histogram, the horizontal volumes of transactions at a certain price without reference to time. At the same time, the histogram appears directly in the terminal window, and each column of the volume is easily correlated with the quote value of the currency pair. The volume of transactions is of great importance in exchange trading, usually an increase in the number of concluded contracts confirms the trend, and their reduction indicates an imminent
Introduction to Harmonic Volatility Indicator Harmonic Volatility Indicator is the first technical analysis applying the Fibonacci analysis to the financial volatility. Harmonic volatility indicator is another level of price action trading tool, which combines robust Fibonacci ratios (0.618, 0.382, etc.) with volatility. Originally, Harmonic Volatility Indicator was developed to overcome the limitation and the weakness of Gann’s Angle, also known as Gann’s Fan. We have demonstrated that Harmonic
Moving pivot Average Fibonacci The  indicator compares the selected period with its counterpart from the previous period. The indicator determines the moving Fibonacci levels for the day or any time interval to assess the price movement range from the time average. The indicator helps predict the expected high or low for the day based on historical time data. The pivot line can be considered an average trend line and use it in a variety of trading strategies. If you have any question about the
Introduction to Fractal Pattern Scanner Fractal Indicator refers to the technical indicator that makes use of the fractal geometry found in the financial market. Fractal Pattern Scanner is the advanced Fractal Indicator that brings the latest trading technology after the extensive research and development work in the fractal geometry in the financial market. The most important feature in Fractal Pattern Scanner is the ability to measure the turning point probability as well as the trend probabil
Break of Structure
Rajesh Kumar Nait
시장 구조는 더 높은 기간의 돌파가 트레이더에게 추세를 정리하는 데 도움이 될 수 있는 구조입니다. 1. 이 표시기는 지그재그를 마지막 2개의 구조(지그재그의 이전 최고점 및 최저점)에만 끌어당기고 구조가 파손된 경우에만 새로운 지그재그 막대가 형성됩니다. 2. 구조의 파손시 터미널 및 푸시 알림을 제공합니다. 3. [ 및 ] 키에서 지그재그의 확장 깊이를 증가 및 감소시켜 스윙을 조정합니다. 4. Line AB BC 및 CD의 색상 변경 5. 많은 차트에 추가하고 여러 기호에 대한 경고 받기 Break of Structure Multi ExtDepth Breakout Multi Symbol Scanner를 찾고 있다면 이 제품을 사용할 수 있습니다. Multi Symbol Multi ExtDepth ZigZag Breakout Scanner
Historical Pivot Zones - Fibonacci Indicator MT5 Automatically draws Fibonacci retracement and projection zones based on historical price pivots. This MT5 indicator intelligently selects pivot points from different timeframes (weekly, monthly, or 6-month ranges) and creates visual Fibonacci zones around key levels. Features include: Smart Mode Selection - Auto-adjusts based on your chart timeframe Clean Visual Zones - Highlighted areas instead of just lines Essential Fib Levels - 9 retrace
Easy Indy
Vinutthapon Bumroong
This indicator automatically draws trendlines, Fibonacci levels, support and resistance zones, and identifies BOS (Break of Structure) and CHOCH (Change of Character) patterns on the chart. Just by placing it on the graph, it handles the essential technical analysis tasks for traders, providing a streamlined, effective trading tool this tools is alway make every one easy for trading.
NEXA Breakout Velocity1 Channel Breakout + ROC 속도 필터 + 거래량 필터 + ATR 리스크 관리 기반의 자동매매 프로그램입니다. 본 제품은 변동성 확장 구간에서의 가격 돌파를 감지하도록 설계되었습니다. 신호는 종가 기준으로만 계산되며, 동일 심볼에 한 개의 포지션만 유지합니다. 전략 개요 이 제품은 다음 요소를 결합합니다. 채널 기반 돌파 감지 가격 변화 속도(ROC) 필터 거래량 증가 필터 하위 시간대 확인 옵션 ATR 기반 손절 및 손익비 설정 계좌 위험 비율 기반 자동 로트 계산 동적 리스크 관리 단순한 돌파가 아닌, 속도와 거래량이 동반된 돌파를 선택하도록 설계되었습니다. 작동 방식 설정된 기간의 고점/저점 채널을 계산합니다. 직전 봉이 채널을 돌파했는지 확인합니다. ROC 값이 평균 대비 일정 배수 이상인지 확인합니다. 거래량이 평균 대비 일정 수준 이상인지 확인합니다. 필요 시 하위 시간대에서 동일 조건을 재확인합니다. ATR 기반 손
FREE
Dynamic SR Levels Pro
Vinutthapon Bumroong
Title: Dynamic SR Levels Pro Short Description: A next-generation, multi-timeframe Support & Resistance indicator that automatically detects, adapts, and invalidates key price zones based on real-time market volatility. Stop guessing, start seeing. Full Description: Tired of manually drawing support and resistance lines that quickly become outdated? Dynamic SR Levels Pro is the ultimate solution for traders who demand precision, adaptability, and a clean, clutter-free chart. This is not just ano
+++++++++++++++++++++++++++++++++++++++++++++++++++++++++++++++++++++++++++++++++++++++++++++++++ +++ Link to EURUSD Only Free Version -->  https://www.mql5.com/en/market/product/156904?source=Unknown +++++++++++++++++++++++++++++++++++++++++++++++++++++++++++++++++++++++++++++++++++++++++++++++++ Hallo Trader, This is a traditional GANN & FIBONACCI strategy based on detection of an impulsive move in the opposite direction. This is called a Breakout. At the moment of Breakout, the indicator draw
이 제품의 구매자들이 또한 구매함
이 제품은 2026년 시장에 맞게 업데이트되었으며 최신 MT5 빌드에 최적화되었습니다. 가격 업데이트 안내: Smart Trend Trading System은 현재 $99 에 제공됩니다. 다음 30회 구매 후 가격은 $199 로 인상됩니다. 특별 혜택: Smart Trend Trading System 구매 후 저에게 개인 메시지를 보내시면 Smart Universal EA를 무료 로 받을 수 있으며, Smart Trend 신호를 자동 거래로 전환할 수 있습니다. Smart Trend Trading System은 리페인트 없음, 재그리기 없음, 지연 없음의 완전한 트레이딩 시스템으로, 더 깨끗한 신호, 더 나은 추세 방향, 그리고 더 체계적인 시장 거래 방식을 원하는 트레이더를 위해 제작되었습니다. Online course , manual and [download presets] . 이 시스템은 추세 감지, 반전 구간, Smart Cloud, 트레일링 스톱 로직, 지지와 저항, 캔들
SuperScalp Pro
Van Minh Nguyen
4.69 (29)
SuperScalp Pro – 전문 멀티 레이어 컨플루언스 스캘핑 시스템 SuperScalp Pro 는 다중 컨플루언스를 기반으로 한 전문 스캘핑 시스템으로, 트레이더가 더 높은 확률의 매매 기회를 식별할 수 있도록 설계되었습니다. 명확한 진입 신호 확인, ATR 기반 손절(Stop Loss) 및 목표가(Take Profit), 그리고 XAUUSD, BTCUSD 및 주요 외환 통화쌍에 대한 유연한 신호 필터링 기능을 제공합니다. 전체 문서는 제품 블로그에서 확인할 수 있습니다:   [User Guide] SuperScalp Pro Auto Trader EA를 통해 자동 매매를 지원합니다:   [Auto Trader] SuperScalp Pro 의 거래 로직을 기반으로 개발된 골드 자동 스캘핑 EA: [SuperScalp Gold] SuperScalp Pro 는 Supertrend, VWAP, EMA, RSI, ADX, 거래량 분석, 볼린저 밴드 및 MACD 다이버전스를 결합하여
Trend Sniper X
Sarvarbek Abduvoxobov
5 (6)
Trend Sniper X 는 MetaTrader 5용 멀티 타임프레임 추세 추종 지표로, 트레이더가 추세 방향과 잠재적 반전 지점을 명확하고 정확하게 식별하도록 돕습니다. 가격 정보: 현재 가격은 프로모션 가격이며, 향후 업데이트 및 새로운 기능 출시 시 변경될 수 있습니다. Code2Profit 채널 멀티 타임프레임 분석으로 시장을 마스터하세요! 기술 사양 플랫폼 MetaTrader 5 지표 유형 멀티 타임프레임 추세 지표 운용 타임프레임 모든 차트 타임프레임 지원, 독립적으로 선택 가능한 상위 타임프레임(M1–MN1) 주요 상품 외환, 금(XAUUSD) 및 기타 CFD 권장 계좌 모든 계좌 유형 시각화 색상별 추세 캔들(매수/매도/약세/변경) + 매수/매도 화살표 추가 모듈 세션 시장 박스(시드니, 도쿄, 런던, 뉴욕) 주요 기능 멀티 타임프레임 추세 분석: 상위 타임프레임의 추세 방향을 현재 차트에 직접 투영하여 명확한 매크로 관점을 제공합니다. 약세/불확실한 바 감지: 추세
Welcome to ENTRY IN THE ZONE AND SMC MULTI TIMEFRAME Entry In The Zone and SMC Multi Timeframe is a professional trading indicator built on Smart Money Concepts (SMC) , combining market structure analysis with a No Repaint BUY / SELL signal system in a single indicator. It helps traders understand market structure more clearly, identify key price zones, and focus on higher-quality trading opportunities. By combining Multi-Timeframe Analysis , Points of Interest (POIs) , and real-time signals, th
M1 Quantum MT5
Hamed Dehgani
4.56 (9)
M1 Quantum을 이용한 실시간 트레이딩 신호 : 신호   ( Quantum Trade Assistant 에 의해 거래가 자동으로 실행되며, 이 제품에 무료 로 포함되어 있습니다.) 가격 계획: 현재 가격: $169 (얼리 어답터 혜택) 다음 예정 가격: $189 예정 소매 가격: $299 개발자 안내: 구매 후 저에게 연락하시면 최신 권장 설정 파일(Set File) , 사용 팁, 그리고 다른 M1 Quantum 사용자들과 소통할 수 있는 VIP 지원 그룹 초대장을 받으실 수 있습니다. 자주 묻는 질문 - 설정 파일 - 설치 가이드 M1 Quantum 은 M1 전용 전문 트레이딩 시스템으로, 손절(Stop Loss), 익절(Take Profit), 그리고 스마트 자금 관리 기능이 내장된 빠르고 정확한 거래 신호를 제공합니다. M1 Quantum 은 연속 수익 거래 에 집중하여 계좌를 빠르게 성장시키도록 설계된 전문 자금 관리 시스템을 포함하고 있습니다. M1 Quantum
Divergence Bomber
Ihor Otkydach
4.9 (92)
이 지표를 구매하신 분께는 다음과 같은 혜택이 무료로 제공됩니다: 각 거래를 자동으로 관리하고, 손절/익절 수준을 설정하며, 전략 규칙에 따라 거래를 종료하는 전용 도우미 툴 "Bomber Utility" 다양한 자산에 맞게 지표를 설정할 수 있는 셋업 파일(Set Files) "최소 위험", "균형 잡힌 위험", "관망 전략" 모드로 설정 가능한 Bomber Utility의 셋업 파일 이 전략을 빠르게 설치, 설정, 시작할 수 있도록 돕는 단계별 영상 매뉴얼 주의: 위의 모든 보너스를 받기 위해서는 MQL5 개인 메시지 시스템을 통해 판매자에게 연락해 주세요. 독창적인 커스텀 지표인 “Divergence Bomber(다이버전스 봄버)”를 소개합니다. 이 지표는 MACD 다이버전스(괴리) 전략을 기반으로 한 올인원(All-in-One) 거래 시스템입니다. 이 기술 지표의 주요 목적은 가격과 MACD 지표 간의 다이버전스를 감지하고, **향후 가격이 어느 방향으로 움직일지를 알려주는
M1 Sniper MT5
Oleg Rodin
5 (4)
M1 SNIPER 는 사용하기 쉬운 거래 지표 시스템입니다. M1 시간대에 맞춰 설계된 화살표 지표입니다. 이 지표는 M1 시간대 스캘핑을 위한 단독 시스템으로 사용할 수 있으며, 기존 거래 시스템의 일부로도 사용할 수 있습니다. 이 거래 시스템은 M1 시간대 거래용으로 특별히 설계되었지만, 다른 시간대에도 사용할 수 있습니다. 원래는 XAUUSD와 BTCUSD 거래를 위해 이 방법을 설계했지만, 다른 시장 거래에도 유용하다는 것을 알게 되었습니다. 이 지표의 신호는 추세 방향과 반대로 거래될 수 있습니다. 저는 지표의 신호를 활용하여 양방향으로 거래할 수 있도록 돕는 특별한 거래 기법을 알려드립니다. 이 방법은 특별한 동적 지지선과 저항선 가격 영역을 활용하는 것을 기반으로 합니다. 구매하시면 M1 SNIPER 화살표 지표를 바로 다운로드하실 수 있습니다. 또한, 아래 스크린샷에 표시된 Apollo Dynamic SR 지표는 M1 SNIPER 도구를 사용하는 모든 사용자에게 무료로
UZFX {SSS} 스캘핑 스마트 시그널 v4.0 MT5는 급변하는 시장에서 정확한 실시간 시그널을 필요로 하는 스캘퍼, 데이 트레이더, 스윙 트레이더를 위해 설계된 리페인팅이 없는 고성능 트레이딩 지표입니다. (UZFX-LABS)에서 개발한 이 지표는 가격 움직임 분석, 추세 확인 및 스마트 필터링을 결합하여 모든 통화 쌍과 시간대에서 높은 확률의 매수 및 매도 신호, 경고 신호, 추세 지속 기회를 생성합니다. 거래에 대한 의구심을 떨쳐버리고, 명확성, 정밀성, 그리고 규율 있는 시장 실행을 원하는 트레이더를 위해 설계된 체계적인 신호 시스템을 따르기 시작하세요. 제 추천* 최적의 시간대: 15분 이상. {H1}이 제가 가장 선호하는 시간대입니다. 그리고 그 결과는 정말 놀라울 정도입니다...!! 주요 기능 업데이트 • 자동 매수 및 매도 신호 감지 • 고급 반전 인식 로직 • 잠재적인 시장 반전 전 조기 경고 신호 • 추세 지속 확인 신호 • 진입, 손절, TP1, TP2,
Gann Made Easy MT5
Oleg Rodin
5 (8)
Gann Made Easy 는 mr.의 이론을 사용하여 최고의 거래 원칙을 기반으로 하는 전문적이고 사용하기 쉬운 Forex 거래 시스템입니다. W.D. 간. 이 표시기는 Stop Loss 및 Take Profit Levels를 포함하여 정확한 BUY 및 SELL 신호를 제공합니다. PUSH 알림을 사용하여 이동 중에도 거래할 수 있습니다. 구매 후 거래 방법 안내 및 유용한 추가 지표를 무료로 받으시려면 저에게 연락주세요! 아마도 Gann 거래 방법에 대해 이미 여러 번 들었을 것입니다. 일반적으로 Gann의 이론은 초보자 거래자뿐만 아니라 이미 거래 경험이 있는 사람들에게도 매우 복잡한 것입니다. Gann의 거래 방식은 이론적으로 적용하기 쉽지 않기 때문입니다. 나는 그 지식을 연마하고 Forex 지표에 최고의 원칙을 적용하기 위해 몇 년을 보냈습니다. 표시기는 적용하기가 매우 쉽습니다. 차트에 첨부하고 간단한 거래 권장 사항을 따르기만 하면 됩니다. 지표는 지속적으로 시장 분석
Entry Points Pro for MT5
Yury Orlov
4.5 (146)
전설이 돌아왔습니다: Entry Points Pro 10. MQL5 마켓 Top-3 자리를 3년간 지켜온 전설적인 지표의 재출시입니다. 수백 개의 호평 리뷰(두 버전 합산 589개), 매일 이 지표로 거래하는 수천 명의 트레이더, 31,000회 이상의 데모 다운로드   MT4+MT5 . 지난 5년간 여러분이 남긴 리뷰를 하나도 빠짐없이 읽었고, 약속 대신 그 답을 버전 10에 담았습니다. 1999년부터 시장에서 활동하며 정직함과 자신의 평판, 그리고 고객을 소중히 여기는 개발자가 만들었습니다. Entry Points Pro의 진입 시그널은 절대 리페인팅되지 않습니다. 그리고 이번에는 개발자의 말뿐이 아니라 검증 가능한 사실입니다: 확정 시그널은 캔들 종가에서만 표시되며, 자동화 테스트에서 리페인팅 0건 이 확인되었습니다(EURUSD, XAUUSD, BTCUSD에서 2,486,568회의 불변조건 검사 — 위반 0건). 검증 방법은 공개되어 있으니 전략 테스터에서 직접 재현해 보실 수
Atomic Analyst MT5
Issam Kassas
4.36 (45)
이 제품은 2026년 시장에 맞게 업데이트되었으며 최신 MT5 빌드에 최적화되었습니다. 가격 업데이트 안내: Atomic Analyst는 현재 $99 에 제공됩니다. 다음 30회 구매 후 가격은 $199 로 인상됩니다. 특별 혜택: Atomic Analyst 구매 후 저에게 개인 메시지를 보내시면 Smart Universal EA를 무료 로 받을 수 있으며, Atomic Analyst 신호를 자동 거래로 전환할 수 있습니다. Atomic Analyst는 리페인트 없음, 재그리기 없음, 지연 없음의 Price Action 거래 인디케이터로, 수동 거래, 신호 명확성, EA 자동화를 위해 설계되었습니다. User manual: settings, inputs and strategy.   &   User Manual PDF . 가격 움직임, 강도, 모멘텀, 다중 시간대 방향 및 고급 필터를 분석하여 트레이더가 노이즈를 줄이고 약한 세팅을 피하며 더 체계적인 거래 결정을 내릴 수 있도록
Power Candles MT5
Daniel Stein
5 (9)
Power Candles V3 - 자체 최적화 강도 지표 파워 캔들 V3는 적용된 모든 차트에서 통화 및 상품의 강세를 실행 가능한 거래 계획으로 전환합니다. 단순히 캔들에 색상을 입히는 대신, 백그라운드에서 실시간 자동 최적화를 수행하여 현재 보고 있는 종목에 대한 최적의 손절매, 익절 및 신호 임계값을 제공합니다. 한 번의 클릭으로 실시간 거래에 적용할 수 있으며, 진입점, 손절매 및 익절 선이 정확한 가격에 맞춰 차트에 표시되고, 방향과 함께 알림이 발령됩니다. 이 도구는 Stein Investments 에코시스템의 일부입니다. 18개 이상의 도구와 함께 당신의 1대1 AI 트레이딩 멘토 Max.  항상 대기 중, 모든 인디케이터를 깊이 있게 이해, 무언가를 차근차근 생각해보고 싶은 순간에 도움을 줍니다.  https://stein.investments 에서 만나보세요 매 종가 바마다 3,000회 이상의 트레이딩 시뮬레이션. 9가지 강도 상태. 2가지 전략을 병렬로 테스트.
Crystal Heikin Ashi Signals
Muhammad Jawad Shabir
5 (2)
Crystal Heikin Ashi Signals - Professional Trend & Signal Detection Indicator Advanced Heikin Ashi Visualization with Intelligent Signal System for Manual & Automated Trading Final Price: $149 ---------> Price goes up $10 after every 10 sales . Limited slots available — act fast . Overview Crystal Heikin Ashi Signals is a professional-grade MetaTrader 5 indicator that combines pure Heikin Ashi candle visualization with an advanced momentum-shift detection system. Designed for both manual traders
Quantum TrendPulse
Bogdan Ion Puscasu
5 (25)
SuperTrend   ,   RSI   ,   Stochastic   의 힘을 하나의 포괄적인 지표로 결합하여 트레이딩 잠재력을 극대화하는 궁극의 트레이딩 도구   인 Quantum TrendPulse를   소개합니다. 정밀성과 효율성을 추구하는 트레이더를 위해 설계된 이 지표는 시장 추세, 모멘텀 변화, 최적의 진입 및 종료 지점을 자신 있게 식별하는 데 도움이 됩니다. 주요 특징: SuperTrend 통합:   주요 시장 추세를 쉽게 따라가고 수익성의 물결을 타세요. RSI 정밀도:   매수 과다 및 매도 과다 수준을 감지하여 시장 반전 시점을 파악하는 데 적합하며 SuperTrend 필터로 사용 가능 확률적 정확도:   변동성이 큰 시장에서 숨겨진 기회를 찾기 위해 확률적 진동   을 활용하고 SuperTrend의 필터로 사용 다중 시간대 분석:   M5부터 H1 또는 H4까지 다양한 시간대에 걸쳐 시장을 최신 상태로 유지하세요. 맞춤형 알림:   맞춤형 거래 조건이 충족되면
Axiom Matrix
Issam Kassas
5 (4)
AXIOM MATRIX MT5 출시 가격: $99 Axiom Matrix는 출시 가격 $99에 제공됩니다. 첫 30회 구매 이후 가격은 $199로 인상됩니다. 구매 후, 안내 사항을 받고 독점 선물 보너스를 받기 위해 저에게 직접 DM을 보내주세요. Axiom Matrix는 MetaTrader 5용 전문 멀티 심볼, 멀티 타임프레임 시장 스캐너이자 의사결정 대시보드입니다. Axiom Matrix는 사용자의 Market Watch를 스캔하고, 여러 타임프레임을 분석하며, 여러 근거 엔진을 읽고, 가장 강한 기회를 비교하여 하나의 깔끔한 매트릭스 대시보드 안에서 최적의 BUY, SELL, WAIT 또는 차단 상태를 보여줍니다. 저는 무거운 시장 스캔 작업을 대신 처리해 줄 수 있는 하나의 도구가 필요했기 때문에 Axiom Matrix를 만들었습니다. 저는 RSI만 따로 확인하고 싶지 않았습니다. 그다음 MACD만 따로 확인하고. 그다음 이동평균. 그다음 거래량. 그다음 변동성. 그다음
ARIPoint
Temirlan Kdyrkhan
1 (1)
ARIPoint is a powerful trading companion designed to generate high-probability entry signals with dynamic TP/SL/DP levels based on volatility. Built-in performance tracking shows win/loss stats, PP1/PP2 hits, and success rates all updated live. Key Features: Buy/Sell signals with adaptive volatility bands Real-time TP/SL/DP levels based on ATR Built-in MA Filter with optional ATR/StdDev volatility Performance stats panel (Success, Profit/Loss, PP1/PP2) Alerts via popup, sound, push, or email Cu
통화 강도 마법사는 성공적인 거래를 위한 올인원 솔루션을 제공하는 매우 강력한 지표입니다. 표시기는 여러 시간 프레임의 모든 통화 데이터를 사용하여 이 또는 해당 외환 쌍의 힘을 계산합니다. 이 데이터는 특정 통화의 힘을 확인하는 데 사용할 수 있는 사용하기 쉬운 통화 지수 및 통화 전력선의 형태로 표시됩니다. 필요한 것은 거래하려는 차트에 표시기를 부착하는 것뿐입니다. 표시기는 거래하는 통화의 실제 강세를 보여줍니다. 지표는 또한 추세와 거래할 때 유리하게 사용할 수 있는 구매 및 판매 거래량 압력의 극한값을 보여줍니다. 지표는 또한 피보나치에 기반한 가능한 대상을 보여줍니다. 표시기는 PUSH 알림을 포함한 모든 유형의 알림을 제공합니다. 구매 후 연락주세요. 나는 당신과 거래 팁을 공유하고 당신에게 무료로 훌륭한 보너스 지표를 줄 것입니다! 나는 당신에게 행복하고 유익한 거래를 기원합니다!
이 제품은 2026년 시장에 맞게 업데이트되었으며 최신 MT5 빌드에 최적화되었습니다. 가격 업데이트 안내: Smart Price Action Concepts는 현재 $200 에 제공됩니다. 다음 30회 구매 후 가격은 $299 로 인상됩니다. 특별 혜택: 구매 후 저에게 개인 메시지를 보내시면 무료 보너스 + 선물 을 받을 수 있습니다. 먼저, 이 트레이딩 도구는 리페인트 없음, 재그리기 없음, 지연 없음의 인디케이터이므로 전문적인 트레이딩에 적합하다는 점을 강조하고 싶습니다. Online course , and manual Smart Price Action Concepts Indicator는 초보자와 경험 많은 트레이더 모두에게 매우 강력한 도구입니다. 20개 이상의 유용한 인디케이터를 하나로 결합하고, Inner Circle Trader Analysis와 Smart Money Concepts Trading Strategies 같은 고급 트레이딩 아이디어를 통합합니다. 이 인디
FX Power MT5 NG
Daniel Stein
5 (33)
FX Power: 통화 강세 분석으로 더 스마트한 거래 결정을 개요 FX Power 는 어떤 시장 상황에서도 주요 통화와 금의 실제 강세를 이해하기 위한 필수 도구입니다. 강한 통화를 매수하고 약한 통화를 매도함으로써 FX Power 는 거래 결정을 단순화하고 높은 확률의 기회를 발견합니다. 트렌드를 따르거나 극단적인 델타 값을 사용해 반전을 예측하고자 한다면, 이 도구는 귀하의 거래 스타일에 완벽히 적응합니다. 단순히 거래하지 말고, FX Power 로 더 스마트하게 거래하세요. 1. FX Power가 거래자에게 매우 유용한 이유 통화와 금의 실시간 강세 분석 • FX Power 는 주요 통화와 금의 상대적 강세를 계산하고 표시하여 시장 역학에 대한 명확한 통찰력을 제공합니다. • 어떤 자산이 앞서고 있고 어떤 자산이 뒤처지는지 모니터링하여 보다 현명한 거래 결정을 내릴 수 있습니다. 포괄적인 멀티 타임프레임 뷰 • 단기, 중기 및 장기 타임프레임에서 통화와 금의 강세를
IX Power MT5
Daniel Stein
4.92 (13)
IX Power: 지수, 원자재, 암호화폐 및 외환 시장 통찰력을 발견하세요 개요 IX Power 는 지수, 원자재, 암호화폐 및 외환 시장의 강도를 분석할 수 있는 다목적 도구입니다. FX Power 는 모든 가용 통화 쌍 데이터를 사용하여 외환 쌍에 대해 가장 높은 정확도를 제공하는 반면, IX Power 는 기초 자산 시장 데이터에만 초점을 맞춥니다. 이로 인해 IX Power 는 비외환 시장에 이상적이며, 다중 쌍 분석이 필요하지 않은 간단한 외환 분석에도 신뢰할 수 있는 도구입니다. 모든 차트에서 매끄럽게 작동하며, 거래 결정을 향상시키기 위한 명확하고 실행 가능한 통찰력을 제공합니다. 1. IX Power가 트레이더에게 유용한 이유 다양한 시장 강도 분석 • IX Power 는 지수, 원자재, 암호화폐 및 외환 심볼의 강도를 계산하여 각 시장에 맞는 통찰력을 제공합니다. • US30, WTI, 금, 비트코인 또는 통화 쌍과 같은 자산을 모니터링하여 거래 기회를 발견
가격이 역전되고 후퇴함에 따라 시장 구조가 변경됩니다. 시장 구조 반전 경고 표시기는 추세 또는 가격 움직임이 고갈에 가까워지고 반전할 준비가 되었음을 식별합니다. 일반적으로 반전이나 큰 하락이 일어나려고 할 때 발생하는 시장 구조의 변화를 알려줍니다. 지표는 가능한 고갈 지점 근처에서 새로운 고점 또는 저점이 형성될 때마다 초기에 돌파와 가격 모멘텀을 식별합니다. 표시기는 반대쪽에 있는 마지막 촛불에 직사각형을 그립니다. 그런 다음 현재의 단기 추세에서 계속 움직이기 때문에 가격과 함께 직사각형을 따라갈 것입니다. 가격이 사각형 위나 아래로 다시 닫힐 정도로 약해지면 시장 구조에 잠재적인 변화가 일어나고 있음을 나타냅니다. 그런 다음 표시기는 방향의 잠재적인 이동과 추세 또는 주요 하락의 가능한 반전 시작에 대해 경고합니다. 작동 방식을 보려면 아래의 작동 표시기를 참조하십시오! 모든 쌍 및 주요 기간을 모니터링하는 대시보드: https://www.mql5.com/en/m
Quant Direction MT5
Georgios Kalomoiropoulos
Quant Direction 은 3D 시장 분석 도구입니다. 다양한 매개변수에 걸쳐 정확한 백분율 편차를 계산하면서 완벽하게 객관적인 알고리즘 기반 시장 분석을 제공합니다. 첨단 AI 기반 모델링 도구와 엄격한 테스트를 거쳐 개발된 이 알고리즘은 타의 추종을 불허하는 정확도로 시장을 분석합니다. 플랫폼에서 모든 통화쌍 또는 금융 상품을 분석할 수 있습니다. 단기 거래, 데이 트레이딩, 스윙 트레이딩 등 어떤 유형의 거래를 하든 Quant Direction은 최적의 선택입니다. 운영자가 되는 것의 진정한 이점 퀀트 디렉션의 진정한 장점은 감정, 눈의 피로, 과도한 분석을 완전히 배제한다는 점입니다. 더 이상 수십 개의 차트를 일일이 살펴보며 방향을 찾거나 자신의 판단에 끊임없이 의문을 품을 필요가 없습니다. 이 시스템은 8개의 시간 간격(5개월에서 수개월까지)을 밀리초 단위로 처리합니다. 특정 시점의 주요 시장 참여자를 정확하게 식별하여 항상 성공 확률이 가장 높은 방향으로 거래할
Btmm state engine pro
Garry James Goodchild
5 (4)
BTMM State Engine Pro is a MetaTrader 5 indicator for traders who use the Beat The Market Maker approach: Asian session context, kill zone timing, level progression, peak formation detection, and a multi-pair scanner from a single chart. It combines cycle state logic with a built-in scanner dashboard so you do not need the same tool on many charts at once. What it does Draws the Asian session range; session times can follow broker server offset or be set in inputs. Tracks level progression (L
SWEEP PROTOCOL — 함정이 닫히기 전에 포착하세요 시장은 우연히 고점이나 저점을 돌파하지 않습니다. 거기에 있는 유동성을 사냥한 후, 반전합니다. 이것이 바로 SWEEP PROTOCOL이 실시간으로 감지하는 시퀀스이며, 차트에 직접 표시됩니다. 기관 데스크는 가격을 따르지 않습니다. 그들은 가격을 제조합니다. 그들은 명백한 레벨 — 전일 고점/저점, 아시아 레인지, 미드나잇 오픈 — 이 개인투자자 주문을 끌어들이도록 하고, 빠른 심지로 쓸어버린 후 진짜 목표로 반전합니다. 순수한 차트를 보는 트레이더는 돌파를 봅니다. SWEEP PROTOCOL을 사용하는 사람은 반전 전에 함정이 닫히는 것을 봅니다. 핵심 기능 - 자동 유동성 매핑: 전일 고점/저점, 레인지의 50%, 미드나잇 오픈, 아시아/런던/뉴욕 세션의 완전한 레인지, 수동 설정 없이 자동으로 그려지고 업데이트됩니다. - 리페인트 없는 신호: 캔들 마감 시 확인된 신호는 확인된 상태로 유지됩니다. 히스토리에
The Oracle Pro
Ottaviano De Cicco
5 (1)
The Oracle Pro: Synthetic Multi-Timeframe Bias Engine for MT5 ️ Summer Launch Offer — Get The Oracle Pro for USD 199 (early buyers). Price rises with traction; final price USD 399. The Oracle Pro is a premium multi-timeframe bias engine for MetaTrader 5, built for demanding and professional traders. It answers one question with discipline: what is the directional bias on each timeframe right now, how strong is it, and how much do the timeframes agree? Everything is computed on closed bars only
Trade smarter, not harder: Empower your trading with Harmonacci Patterns This is arguably the most complete harmonic price formation auto-recognition indicator you can find for the MetaTrader Platform. It detects 19 different patterns, takes fibonacci projections as seriously as you do, displays the Potential Reversal Zone (PRZ) and finds suitable stop-loss and take-profit levels. [ Installation Guide | Update Guide | Troubleshooting | FAQ | All Products  ] It detects 19 different harmonic pric
PZ Support Resistance MT5
PZ TRADING SLU
3.71 (7)
Unlock key market insights with automated support and resistance lines Tired of plotting support and resistance lines? This is a multi-timeframe indicator that detects and plots supports and resistance lines in the chart with the same precision as a human eye would. As price levels are tested over time and its importance increases, the lines become thicker and darker, making price leves easy to glance and evaluate. [ Installation Guide | Update Guide | Troubleshooting | FAQ | All Products  ] Boo
소개       Quantum Breakout PRO   , 브레이크아웃 존 거래 방식을 변화시키는 획기적인 MQL5 지표! 13년 이상의 거래 경험을 가진 숙련된 트레이더 팀이 개발한       퀀텀 브레이크아웃 PRO       혁신적이고 역동적인 브레이크아웃 존 전략으로 거래 여정을 새로운 차원으로 끌어올리도록 설계되었습니다. Quantum Breakout Indicator는 5개의 이익 목표 영역이 있는 브레이크아웃 영역의 신호 화살표와 브레이크아웃 상자를 기반으로 한 손절 제안을 제공합니다. 초보자 거래자와 전문 거래자 모두에게 적합합니다. Quantum EA 채널:       여기를 클릭하세요 중요한! 구매 후 설치 매뉴얼을 받으려면 개인 메시지를 보내주십시오. 추천: 기간: M15 통화쌍: GBPJPY, EURJPY, USDJPY,NZDUSD, XAUUSD 계정 유형: 스프레드가 매우 낮은 ECN, Raw 또는 Razor 브로커 시간: GMT +3 중개인 :
Bill Williams Advanced
Siarhei Vashchylka
5 (11)
Bill Williams Advanced is designed for automatic chart analysis using Bill Williams' "Profitunity" system. The indicator analyzes four timeframes at once. Manual (Be sure to read before purchasing) Advantages 1. Analyzes the chart using Bill Williams' "Profitunity" system. Signals are displayed in a table in the corner of the screen and on the price chart. 2. Finds all known AO and AC signals, as well as zone signals. Equipped with a trend filter based on the Alligator. 3. Finds "Divergence Bar
Super Signal Market Slayer 비재페인트 | 고정확도 | 멀티 마켓 지능형 추세 지표 트레이딩에서 진짜 어려운 것은 주문이 아니라, 시장 변동 속에서 추세가 시작되는 순간을 정확히 파악하는 것입니다. Market Slayer 는 이를 위해 만들어졌습니다. 이 지표는 데이 트레이딩을 위해 설계된 비재페인트 지능형 지표입니다. 다중 확인 및 추세 필터링을 통해 중요한 시점에서만 명확하고 신뢰할 수 있는 Buy / Sell 신호를 제공합니다. 핵심 장점 비재페인트 신호 한 번 생성된 신호는 이동하거나 사라지지 않습니다. 고정확도 추세 판단 다양한 종목에서 테스트되었으며, 특히 골드 M5 / M15에서 안정적인 성과를 보입니다. 멀티 마켓 지원 골드, 외환, 지수, 주요 암호화폐 지원. 데이 트레이딩 최적화 M5, M15에 집중하여 노이즈를 줄이고 실행력을 향상. 직관적 구조 초보자도 쉽게 이해하고 사용할 수 있습니다. 기술 로직 요약 Market Slayer 는 단일
제작자의 제품 더 보기
Zigzag Modify
Sy Hien Nguyen
ZigZag Optimized 지표 소개 ZigZag Optimized 지표는 MetaQuotes Ltd.에서 개발되었으며, 버전 2.00으로 업데이트된 MetaTrader 5 플랫폼의 강력한 기술적 분석 도구입니다. 가격의 피크와 트로프를 연결하여 중요한 반전 지점을 식별하며, 트레이더에게 높은 정확도를 제공합니다. 주요 장점 정확한 다이버전스 지원 : 합리적인 가격 구간을 식별하여 RSI와 결합 시 다이버전스 알고리즘과 높은 호환성을 제공. 고급 노이즈 필터링 : InpNeighborCount 와 InpThresholdRatio 를 활용해 이상치를 감지하고 가격을 조정하여 안정성을 보장. 커스터마이징 가능한 파라미터 : InpDepth (12), InpDeviation (5), InpBackstep (3)과 같은 유연한 입력 옵션을 제공하여 개인화된 분석 가능. 시각적 개선 : 선택 가능한 InpShowLabels 기능을 통해 주요 지점에 가격 라벨 표시. 높은 성능 : 최적화된
FREE
Trader Dynamic Index_Pro 신호 추가됨 컨텍스트 인식 신호 통합, 다중 레이어 확인 및 시장 리듬 조율을 갖춘 향상된 Traders Dynamic Index 지표 버전입니다. 수동 거래 및 전문가용 EA 시스템 모두에 적합하게 설계되었습니다. 이 지표를 무시하기는 매우 어려울 것입니다 — 시장 컨텍스트 분석, 추세 감지, 동적 변동 범위, 다이버전스 식별, 특히 시장 리듬 통합으로 대부분의 기존 오실레이터를 능가합니다. 이렇게 포괄적인 지표는 드뭅니다. I. 소개 먼저 첨부된 이미지를 확인 하여 이 지표의 효율성을 직접 확인해보시기 바랍니다. 그 후에 아래의 세부 내용을 읽어보십시오. 저는 이 툴을 완성하기 위해 수많은 시간을 투자 했고, 약 40개의 버전을 반복 수정 하며 발전시켰습니다. 이 지표는 트레이딩 경험 과 실전 트레이더의 컨텍스트 로직 을 모두 담은 저의 집약체입니다. 앞으로도 지속적으로 업데이트 할 예정이며, 많은 관심과 피드백을 부탁드립니다.
PLEASE REVIEW THE ATTACHED IMAGE CAREFULLY BEFORE READING FURTHER This indicator is designed for MetaTrader 4 (MT4) and focuses on a dual-band envelope system to help traders identify liquidity zones and extreme price levels with clarity and precision. If you purchase this indicator, please contact me via email with your payment receipt attached. I will provide you with a detailed user guide and trading strategy for effective application. I. DUAL ENVELOPE INDICATOR FOR MT4 A simplified yet power
DCA Tool All-in-One – MetaTrader 5용 자동 및 반자동 DCA 트레이딩 유틸리티 사용 권장 사항 DCA Tool All-in-One 은 트레이더가 자동 및 반자동 모드로 Dollar Cost Averaging (DCA) 전략을 실행 하고 MetaTrader 5에서 포지션 관리 효율을 극대화 할 수 있도록 설계된 강력한 도구입니다. 실계좌 사용 전에 작동 방식을 충분히 이해하고, 백테스트를 수행하며, 시장 분석과 병행하여 활용할 것 을 권장합니다. 1. 개요 반복 작업 자동화 (지정가 주문, SL/TP, 트레일링 스탑, 부분 청산). 수동 판단 과 정확하고 빠른 자동 실행 을 결합. 가격 구역 기반 DCA 전략 을 더 안전하고 효율적으로 적용. 직관적인 컨트롤 패널 을 통해 진입 구역을 설정하고, 클릭 한 번으로 DCA 전략을 활성화하며 진입 타이밍과 방향을 완전히 제어 할 수 있습니다. 2. 주요 기능 2.1 반자동 모드 첫 거래는 수동으로,
FREE
첨부된 이미지를 꼼꼼히 확인한 후에 읽어주세요 이 지표는 나다라야-왓슨 커널 회귀 채널(Nadaraya‑Watson Kernel Regression Envelopes) 이론과 가격 모멘텀 지표인 RSI 를 결합하여 만들어졌습니다. 또한 유동성 분석 개념을 포함하고 있어 진입 및 청산 포인트를 정밀하게 식별할 수 있는 강력하고 적응적인 도구입니다. 이 지표를 구매하신 분은 이메일로 연락 주시고, 결제 영수증 스크린샷 을 첨부해 주시면 효과적인 거래 방법에 대한 가이드 문서 를 보내드리겠습니다. I. MT5용 나다라야‑왓슨 채널 및 RSI 통합 지표 MetaTrader 5를 위해 설계된 고급 지표로, 적응형 스무딩 알고리즘과 모멘텀 분석을 결합하여 명확하고 실행 가능한 신호를 제공합니다. II. 주요 기능 II.1 적응형 나다라야‑왓슨 채널 가격 움직임에 따라 동적으로 조정되어 상단 및 하단 밴드를 제공, 잠재적인 반전이나 추세 지속을 식별합니다. II.2 RSI 통합 RSI 과매수(7
Zezo Lag EMA
Sy Hien Nguyen
ZLEMA Trend – No lag - No loss - Your Sweet Spot for Market Turning Points Discover the charm of precision trading with ZLEMA , a refined tool crafted to help traders capture top and bottom reversals with confidence and clarity. This custom MT5 indicator uses a dual Zero Lag Exponential Moving Average (ZLEMA) strategy – featuring ZLEMA 5 and ZLEMA 9 – delicately blended to reduce lag and highlight price momentum in real time. When these two lines cross and diverge, the indicator whispers a p

CycleTrackSwingPro for MetaTrader 5 ️ 아래의 자세한 정보를 읽기 전에 첨부된 이미지를 반드시 확인해 주시기 바랍니다. I. 일반 개요 대부분의 거래 손실은 시장의 컨텍스트(CONTEXT) 및 잠재적인 **에너지(ENERGY)**를 충분히 이해하지 못한 데서 비롯됩니다. CycleTrackSwingPro 는 이러한 중요한 결함을 해결하기 위해 설계된 **견고한 프레임워크(FRAMEWORK)**를 기반으로 개발되었습니다. 이 도구는 다음과 같은 핵심 카테고리를 통해 거래 결정을 조율합니다: 단기 vs. 장기 다이내믹스 급격한 변동(Sharp Jerks) vs. 누적(Accumulation) 소진(Exhaustion) vs. 돌파(Breakouts) 주기적(Cyclic) vs. 비주기적(Non-Cyclic) 현실(Reality) vs. 편차(Deviation) 이 인디케이터는 시장에 대한 **홀리스틱(HOLISTIC)**한 관점을 제공합니다. 단기 행동 을
Trader Dynamic Index Added Signal – 시장 컨텍스트 기반의 과학적 접근법을 통한 오실레이터 분석 1. 서론 현대 기술적 분석에서 기존 오실레이터는 종종 시장 컨텍스트와 분리된 개별 신호를 제공 하여 잘못된 신호나 신뢰성이 낮은 신호 발생률이 높습니다. **Trader Dynamic Index Added Signal (TDI-AS)**는 이러한 문제를 해결하기 위해 개발되었으며, 오실레이터 기반 신호 생성 논리를 재정립하고, 시장 컨텍스트 인식을 신호 검증의 핵심 조건 으로 삼고 있습니다. 2. 이론적 프레임워크 2.1. 컨텍스트 – 신뢰할 수 있는 신호의 핵심 요소 TDI-AS에서 컨텍스트란 가격 모멘텀의 동적 임계값 을 의미하며, 이는 주요 추세, 시장 리듬, 왜곡 및 노이즈 수준 을 반영합니다. 컨텍스트가 없으면 , 매수/매도 신호는 구조적 근거가 없는 국지적 반응이 되어 승률이 크게 떨어집니다 . 컨텍스트가 있으면 , 신호가 시장의 지배적인 흐름과 일
TDI PRO DIRECTX – 가격에서의 직접 모멘텀 측정 도구 시장의 변동성이 끊임없이 변하며, 트레이더는 정확한 진입 지점, 좁은 SL, 높은 승률을 요구받습니다. TDI PRO DIRECTX는 시장 모멘텀을 가격에 직접 반영하고 측정하여 진입 지점과 위험 관리를 최적화하도록 설계되었습니다. 트레이더가 직면한 현실적 문제 RSI, EMA, Bollinger와 같은 개별 지표는 종종 노이즈 신호를 생성하여 명확한 결정을 내리기 어렵게 만듭니다. 모멘텀 장벽의 정량화 부족으로 SL 영역이 너무 넓게 설정되거나 잘못된 위치에 배치되는 경우가 많습니다. 시장 모멘텀이 빠르게 변동하며, 트레이더는 최적의 진입 타이밍을 놓치기 쉽습니다. TDI PRO DIRECTX의 기술 원리 RSI13: 13사이클 동안의 주요 모멘텀을 측정합니다. RSI7: 7사이클 동안의 단기 모멘텀 변화 속도를 측정합니다. SMA34: 동적 균형 구역으로 작용하며, 주요 지지/저항 수준입니다. 볼린저 밴드: 강한
Cycle RSI Adaptive – 스마트 인디케이터로 트레이딩 향상 1. 개요 Cycle RSI Adaptive는 전통적인 RSI의 업그레이드 버전으로, 트렌드, 반전, 트레이딩 기회를 더 높은 정확도로 식별하도록 설계되었습니다. 스마트 노이즈 필터링, 시장 적응형 조정, 명확한 신호를 갖추고 있어 초보자와 전문 트레이더 모두에게 이상적인 인디케이터입니다. 주요 이점: 사용이 간편하며, 저자로부터 자세한 안내를 받을 수 있습니다. 수동 트레이딩 또는 자동 시스템(EA/백테스팅)에 최적화. 잘못된 신호를 최소화하여 트레이딩 자신감을 높입니다. 2. 가격 및 조기 구매자 제안 런칭 기간(2025년 8월 17일 – 2025년 9월 30일): 30달러 / 6개월 50달러 / 연간 2025년 9월 30일 이후: 35달러 / 6개월 59달러 / 연간 특별 제안 : 조기 구매자는 할인된 가격으로 풀 버전에 액세스하고 저자의 직접 지원을 받을 수 있습니다. 3. Cycle RSI Adapti
VEHI_v2_Improved 소개 VEHI_v2_Improved (변동성-엔트로피 하이브리드 지표)는 MetaTrader 5 (MT5)용으로 설계된 고급 기술 지표로, VWAP(거래량 가중 평균 가격)를 기반으로 하며 스마트하고 재도색되지 않는 기능을 제공합니다. 아래는 주요 장점입니다: 1. 시장 변동성에 대한 적응성 시장 변동성(ATR)을 기반으로 VWAP 창 크기를 조정하여: 높은 변동성 조건에서의 빠른 반응. 낮은 변동성 시장에서의 안정적인 신호를 보장. 2. 재도색 없음 VWAP, UpperBand, LowerBand 및 매수/매도 신호는 캔들 마감 후 고정되며: 수동 및 자동 거래의 높은 신뢰성. 신호 변경 없이 더 높은 정확도 제공. 3. 뉴스 감지 ATR을 사용하여 비정상적인 변동성(뉴스 이벤트)을 감지하고, 이러한 기간 동안 업데이트를 일시 중지하여: 잘못된 신호 방지. 변동성 시장에서의 거래 위험 감소. 4. 명확한 거래 신호 차트에 화살표로 매수/매도 신호 제공
WaveTrend Enhanced v9 – A Context-Driven Trading Oscillator for Probabilistic Reversal Analysis WaveTrend Enhanced v9 is not designed as a traditional signal generator. It is built as a context-driven analytical system , aimed at identifying market conditions where reversals carry a statistically higher probability, rather than reacting to every short-term fluctuation. Most oscillators answer a simple question: “Is the market overbought or oversold?” WaveTrend Enhanced v9 is designed to answer a
Bigshoot
Sy Hien Nguyen
EA DCA BigShoot – Product Description This Expert Advisor (EA) is designed to execute trades based on the trader’s initial trigger order. It serves as a specialized utility for accumulation trading strategies, helping traders gradually build positions using a DCA (Dollar-Cost Averaging) approach. The EA enables precise scaling with small entries, allowing you to capture more favorable price zones over time. Key Benefits Simplifies trade execution and position management Allows traders to operate
AEMA Truth Trend
Sy Hien Nguyen
What is AEMA Truth Trend? 1. AEMA Truth Trend is not just a moving average. It is an adaptive trend indicator designed to identify the market’s “true price axis.” Instead of relying only on closing price like a standard EMA, AEMA uses a balanced price core that considers candle position, candle-cluster bias, opening gap, and ATR-based volatility. As a result, it reflects market behavior more deeply, rather than reacting mechanically to price. 2. How is AEMA different from Bollinger Bands? Boll
필터:
리뷰 없음
리뷰 답변