SmartLine

SmartLine — by Milchev


SmartLine is not a signal indicator. It is a measurement instrument.

Almost every tool on this market tells you what to do — a buy arrow, a sell arrow, a target — and then goes quiet when it is wrong. SmartLine does something different. It shows you what IS happening, on the exact segment of the chart YOU choose to measure. It never picks the trade for you. It reads the market so you can.

━━━━━━━━━━━━━━━━━━━━━━━━━━━━━━━━━━━━━━━━━━
THE LEVER
━━━━━━━━━━━━━━━━━━━━━━━━━━━━━━━━━━━━━━━━━━

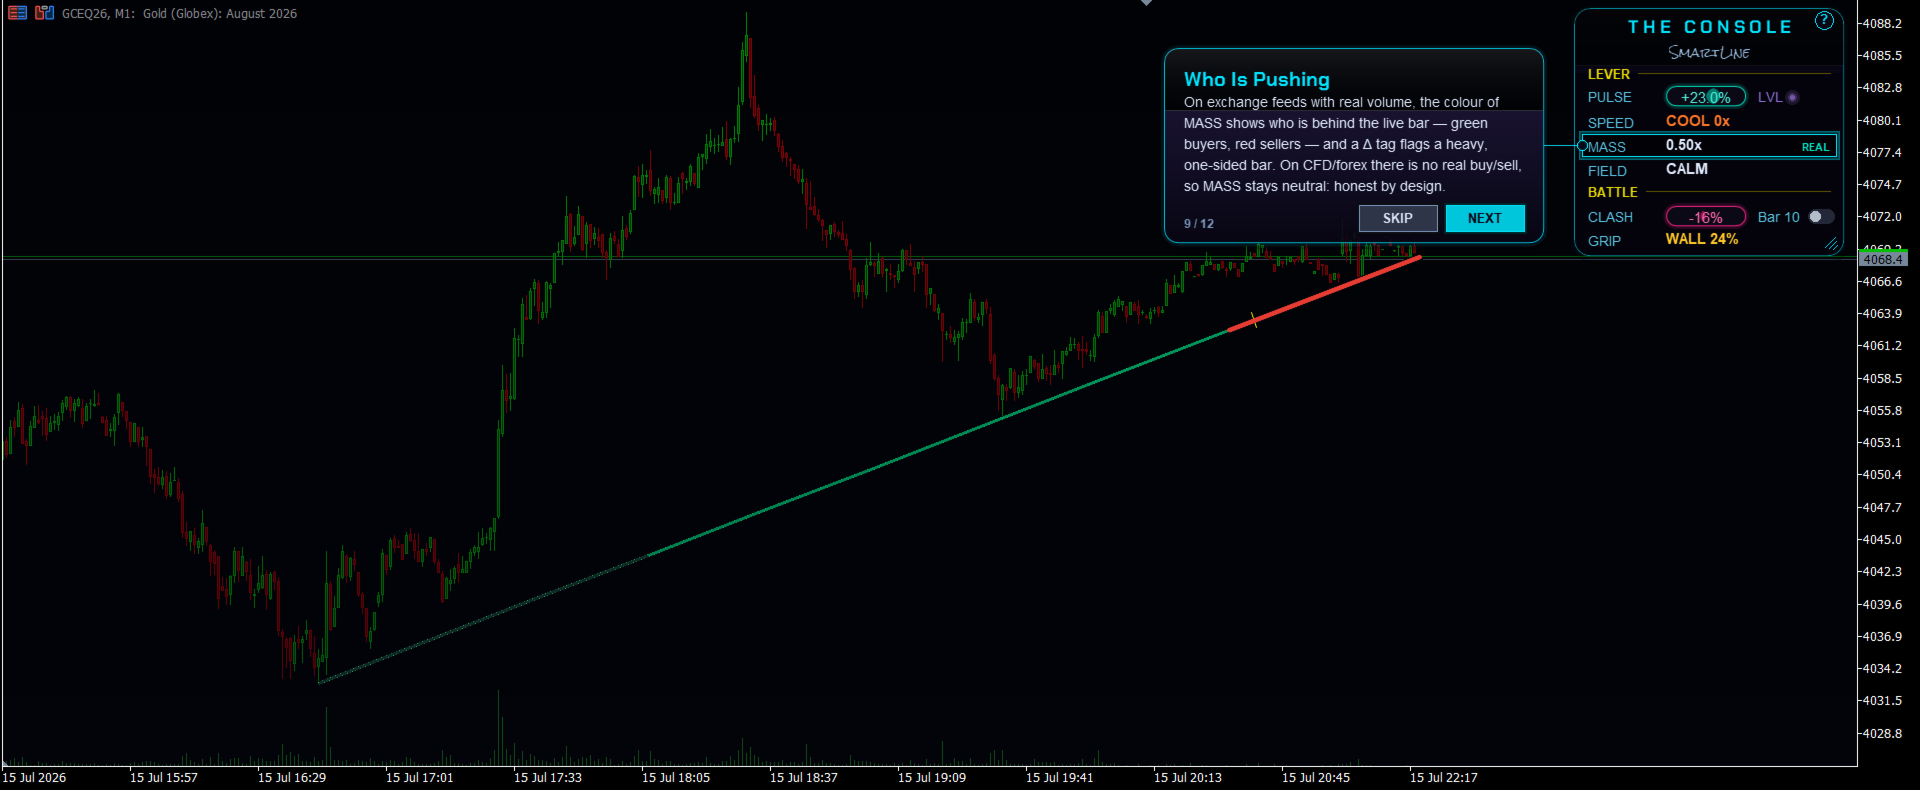
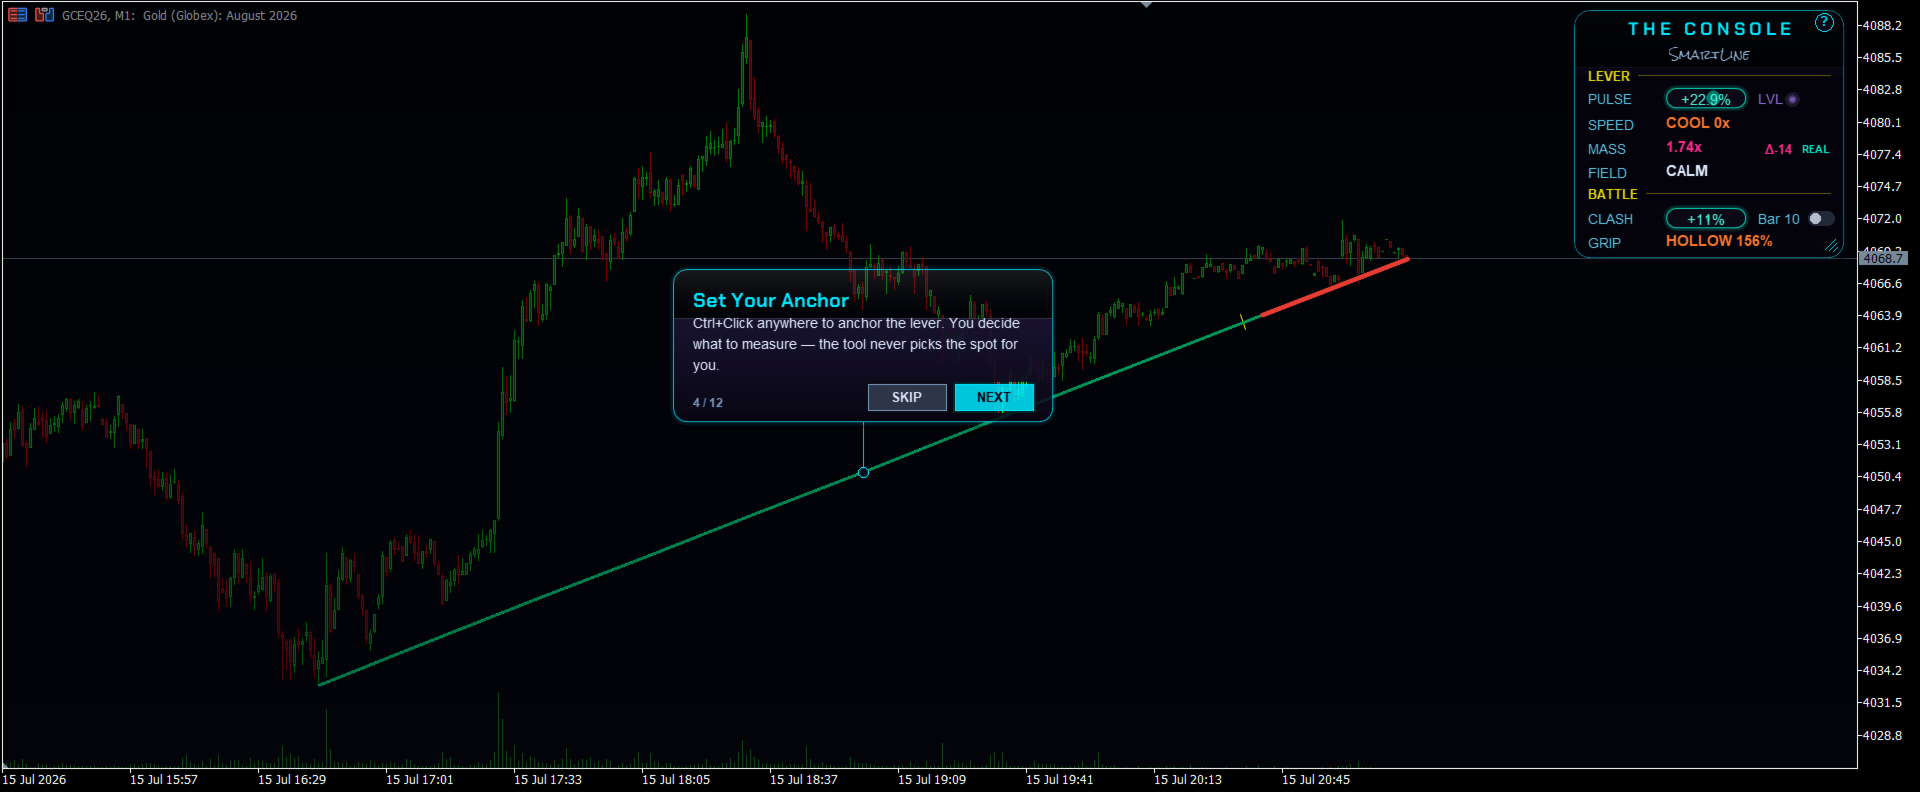
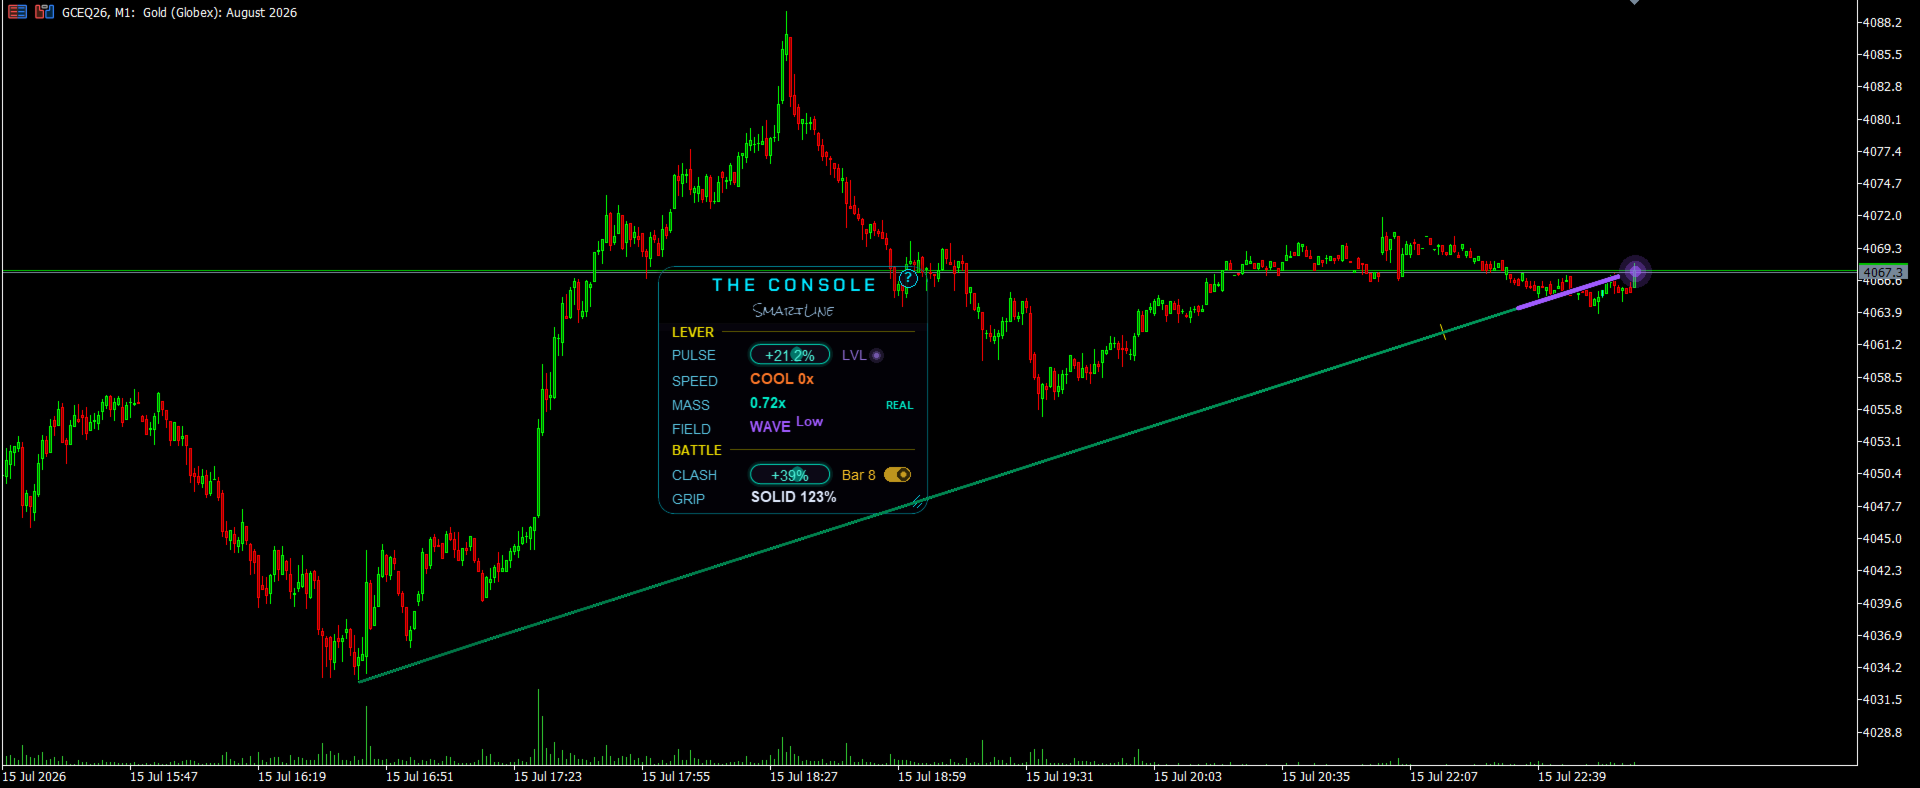
Ctrl+Click any bar — a swing low, a session open, a news candle — and the lever anchors there. From that point to the current price it reads the live battle between buyers and sellers, right on your chart, updating on every tick. Its color shows who is winning. Its thickness shows how heavy the move is.

Shift+Click sets the battle window — the zone where the fight is measured bar by bar. Move the anchor and the whole story changes. That is the entire point: you decide what to measure, and the instrument answers honestly.

Multi-timeframe by nature. The anchor is a point in TIME and PRICE, not a bar index — so it is shared across every timeframe of the symbol. Anchor a swing low on the H1, drop through M5 to M1, and the lever keeps measuring the exact same point in finer and finer resolution. The console reads the same battle at every zoom level; nothing breaks, nothing shifts.

━━━━━━━━━━━━━━━━━━━━━━━━━━━━━━━━━━━━━━━━━━
THE CONSOLE READS
━━━━━━━━━━━━━━━━━━━━━━━━━━━━━━━━━━━━━━━━━━

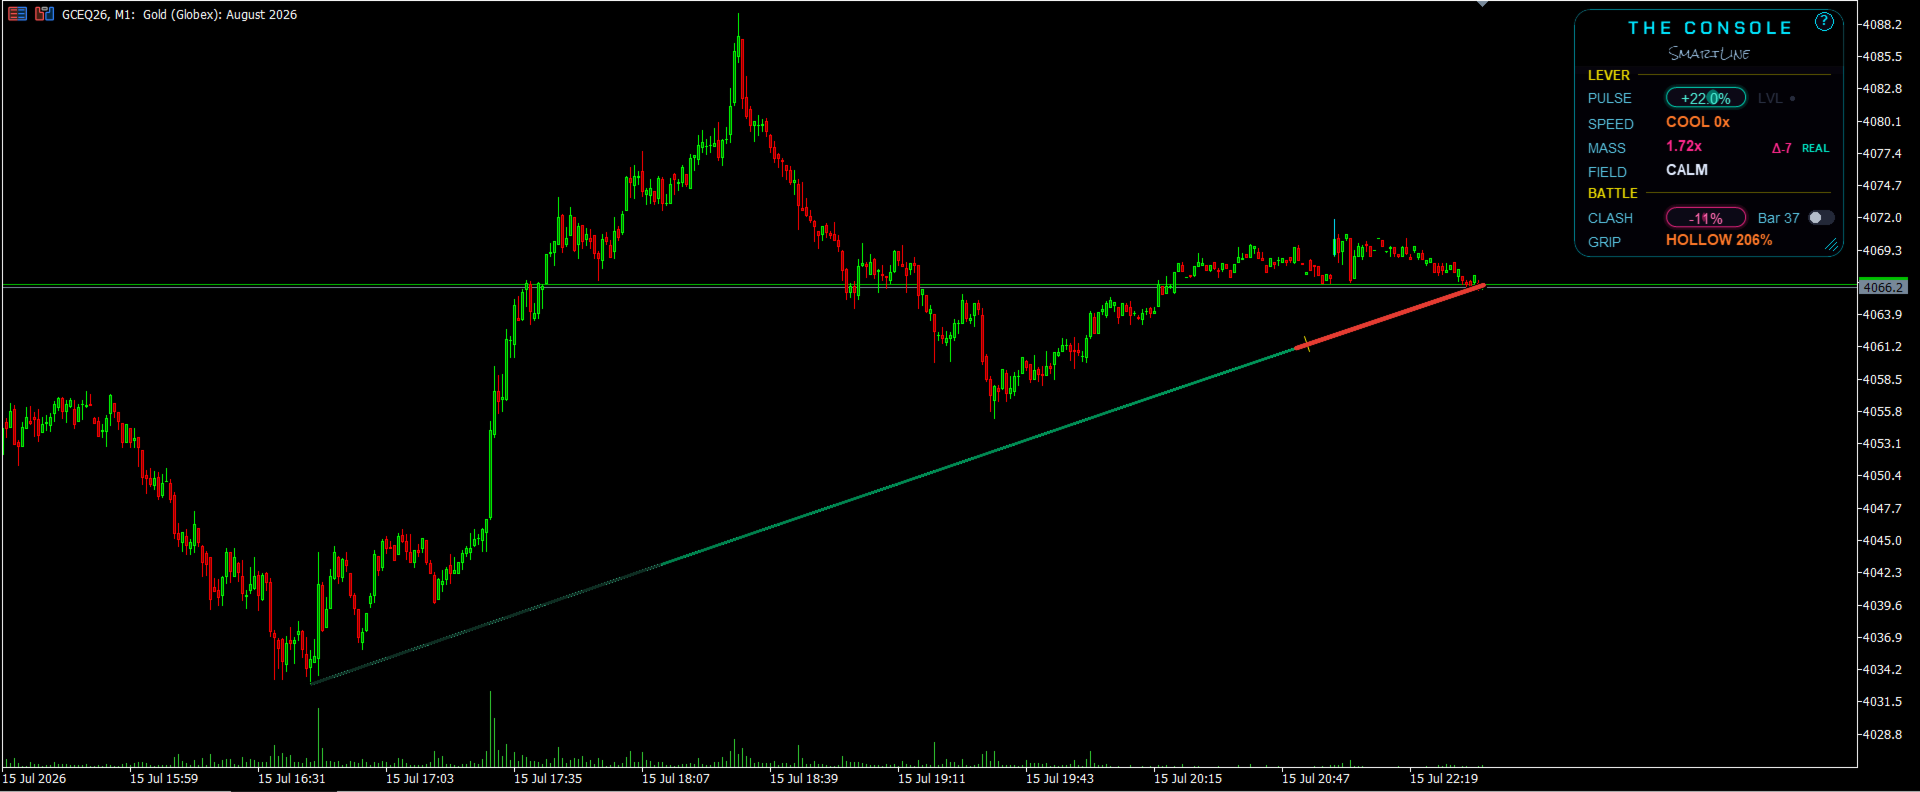
PULSE — the net pressure balance across the whole lever. Positive means buyers lead, negative means sellers lead.

SPEED — the momentum behind the move. GAIN means it is picking up pace, COOL means it is slowing down, HOLD means steady — plus a FADE flag when a move is running out of steam.

MASS — volume per unit of range: how heavy the current bar really is. When mass builds, the lever itself grows thicker on the chart. On instruments with real exchange volume, MASS also colors by who is behind the live bar — green for buyers, red for sellers — and flags a heavy, one-sided bar with a delta tag. On forex and CFD, where there is no true aggressor, MASS stays neutral: honest by design.

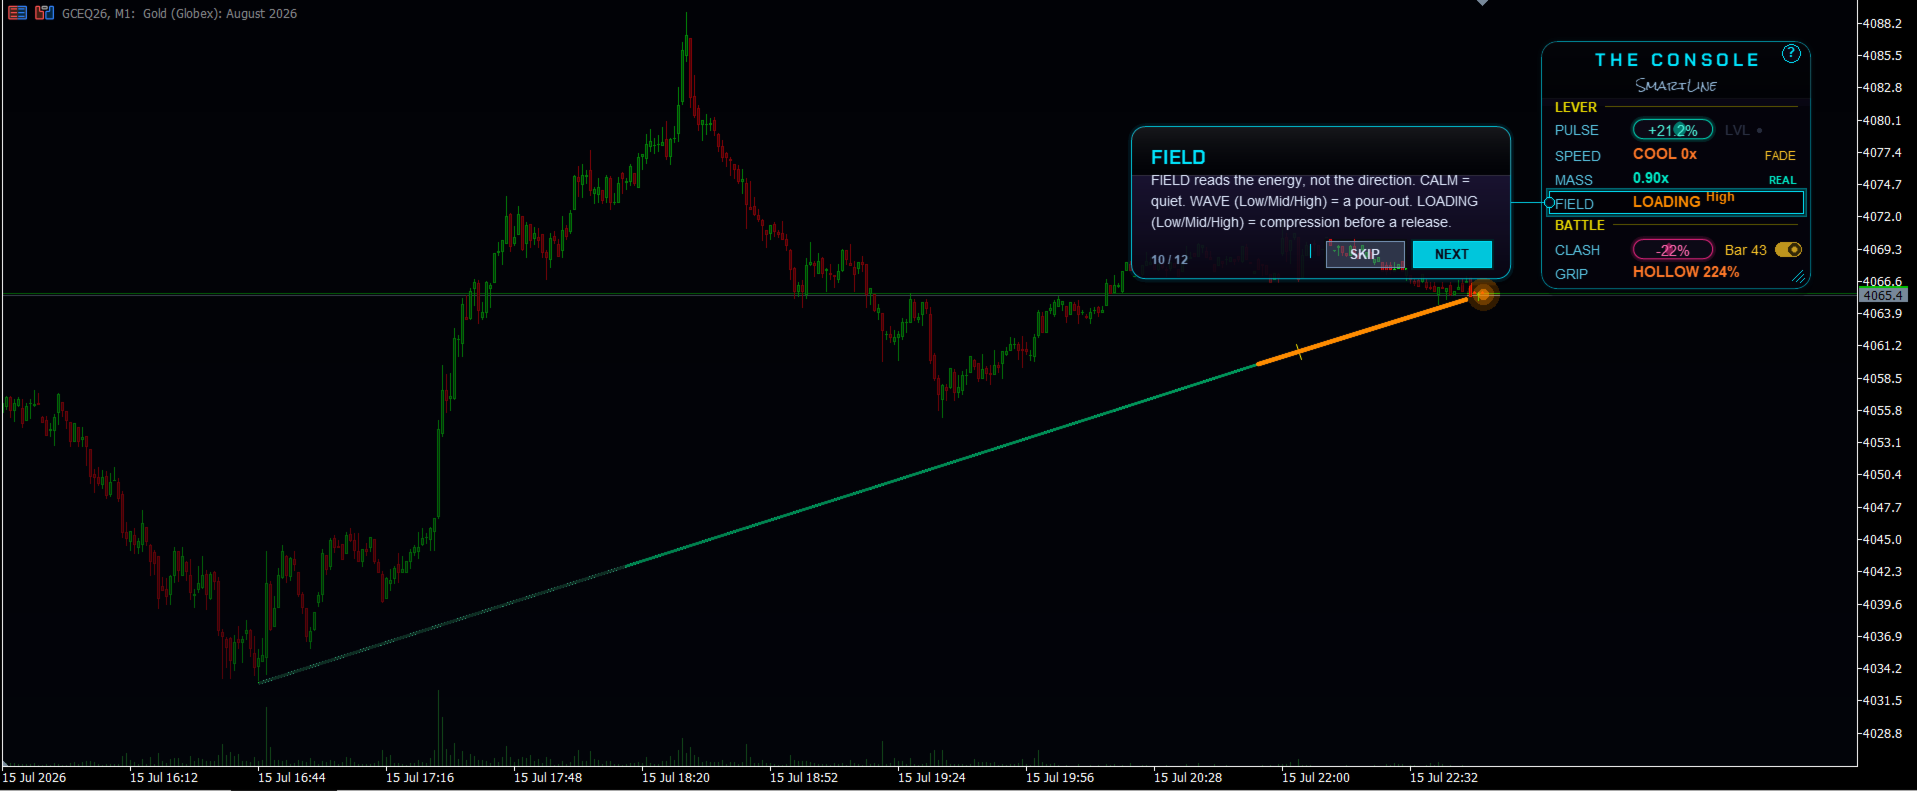
FIELD — the energy state of the move:
  • CALM — quiet, nothing loaded
  • WAVE (Low / Mid / High) — volume pouring out, a release in progress
  • LOADING (Low / Mid / High) — compression building, a spring being wound before it fires
The grading of FIELD was validated across forex majors, stock indices, metals, crypto and crude-oil futures — on M5, M15 and H1, including instruments with real exchange volume. Not a gold-only artifact: the panel measures the same real thing on any liquid instrument.

LVL — lights up when price is sitting on a key swing level.

CLASH — the buyer/seller balance inside your battle window.

GRIP — effort versus result:
  • SOLID — normal traction
  • WALL — pressure is being absorbed, price refuses to move
  • HOLLOW — price is sliding with almost no effort behind it

━━━━━━━━━━━━━━━━━━━━━━━━━━━━━━━━━━━━━━━━━━
HONEST BY DESIGN
━━━━━━━━━━━━━━━━━━━━━━━━━━━━━━━━━━━━━━━━━━

No buy/sell arrows. No promises about direction. FIELD grades the ENERGY of a move — how big, how loaded — but the direction is your craft as a trader. A tool that claims to measure the size AND call the direction is lying about one of them. SmartLine does not.

Volume honesty. On AUTO, SmartLine uses real exchange volume whenever your broker provides it (exchange futures) and shows a green REAL tag. On forex and CFD symbols, where real volume simply does not exist, it uses tick volume and honestly labels it "tick". No pretending, no fiddling.

━━━━━━━━━━━━━━━━━━━━━━━━━━━━━━━━━━━━━━━━━━
BUILT LIKE AN INSTRUMENT, NOT A WIDGET
━━━━━━━━━━━━━━━━━━━━━━━━━━━━━━━━━━━━━━━━━━

• Hand-tuned supersampled rendering with layered-canvas compositing — the lever moves live on every tick, smooth even on a 2-core VPS
• Five color skins so the console reads on any chart background: Neon Dark (the default), Light Paper (tuned for white/light charts, where neon washes out), Graphite (neutral steel), Gold (espresso and gold), and Console (electric-blue with green/magenta accents). Switch skins from a single input — no chart of yours is the wrong chart
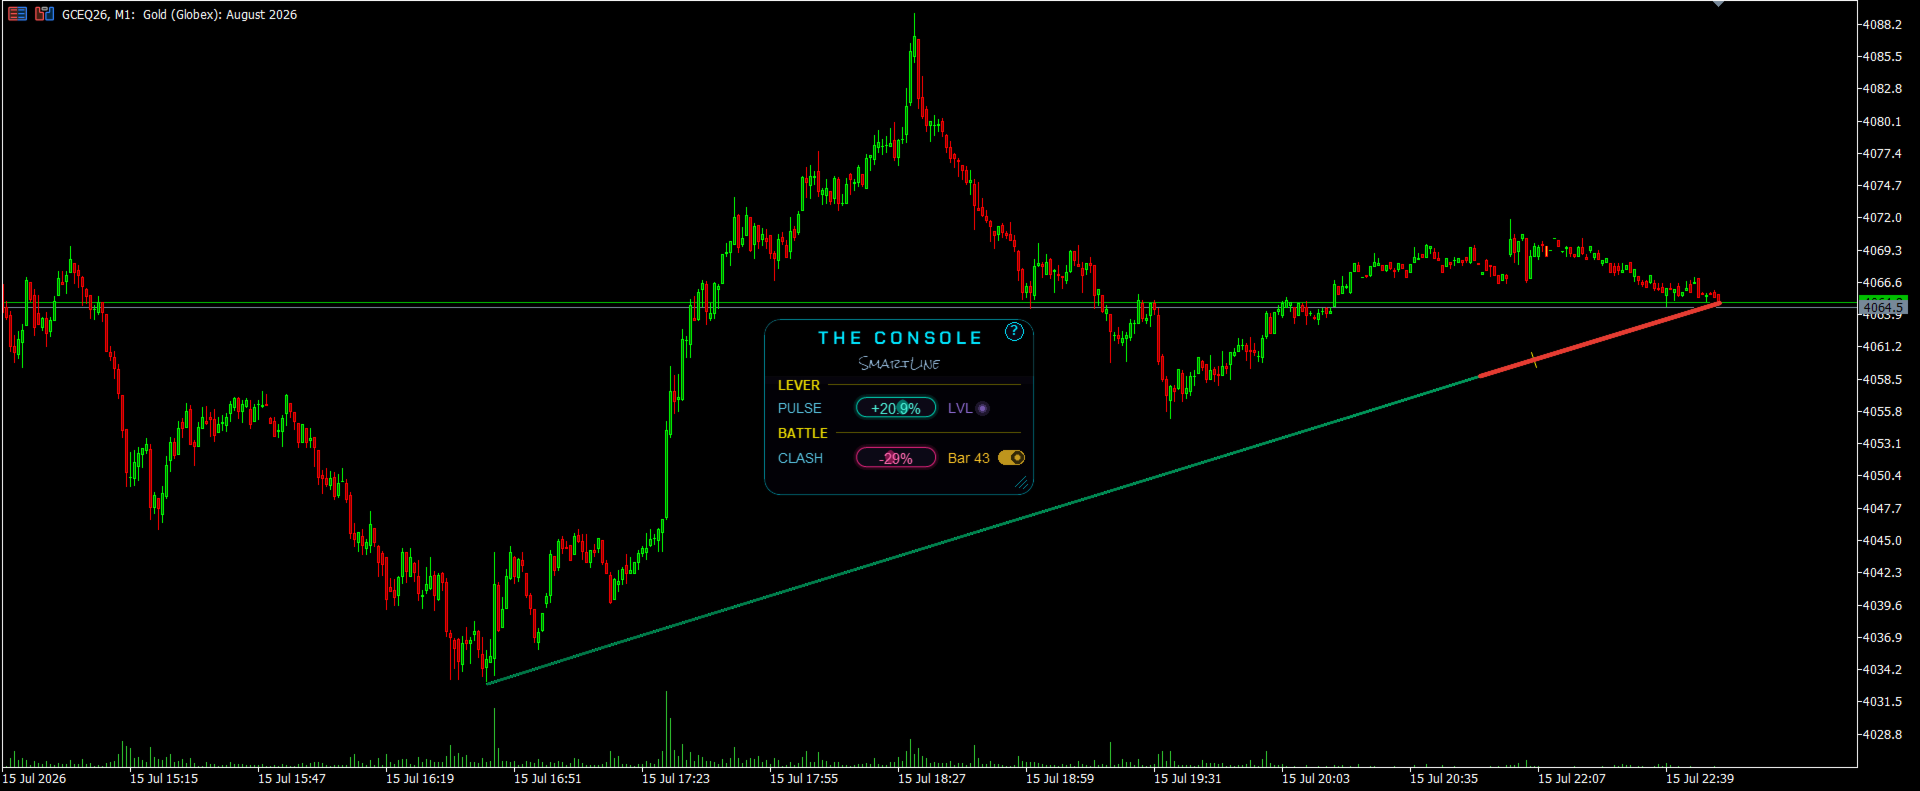
• Drag the console anywhere on the chart; collapse it to a compact mode with the corner grip
• An interactive 12-step tutorial opens on first run — replay it any time with the '?' button
• Embedded fonts, no DLLs, no external dependencies — it just runs

━━━━━━━━━━━━━━━━━━━━━━━━━━━━━━━━━━━━━━━━━━
WHO IT IS FOR
━━━━━━━━━━━━━━━━━━━━━━━━━━━━━━━━━━━━━━━━━━

Traders who read the market themselves — Wyckoff and effort-versus-result students, anchored-VWAP users, prop and funded traders who need a clean read of pressure at THEIR chosen level, not another arrow telling them what to think.

━━━━━━━━━━━━━━━━━━━━━━━━━━━━━━━━━━━━━━━━━━
HOW TO USE IT — LIVE CHART
━━━━━━━━━━━━━━━━━━━━━━━━━━━━━━━━━━━━━━━━━━

• Ctrl+Click — set the anchor (it snaps to the nearby High / Low / Close)
• Shift+Click — set the battle window
• Click the LOCK switch — freeze the window distance so it slides forward with price
• Drag the title bar — move the console anywhere
• Corner grip — collapse to compact mode
• '?' button — replay the tutorial

━━━━━━━━━━━━━━━━━━━━━━━━━━━━━━━━━━━━━━━━━━
HOW TO USE THE FREE DEMO (STRATEGY TESTER)
━━━━━━━━━━━━━━━━━━━━━━━━━━━━━━━━━━━━━━━━━━

The Strategy Tester does not pass mouse clicks to indicators — that is an MT5 limitation. So the demo has its own input group, "Demo — Strategy Tester only":

1. Strategy Tester → Indicator → SmartLine, visual mode, XAUUSD, M5 recommended
2. Open the "Demo" input group and set:
   • Demo: anchor time — the bar you want to measure from
   • Demo: anchor price — its price
   • Demo: battle window bars — optional (default 10)
3. Run the test. When the tester reaches your anchor time, the lever bites into the chart and the console starts measuring — exactly what you see live.
4. Leave all three at 0 and the demo simply anchors 10 bars back automatically.

On a live chart you never touch those inputs — leave them at 0 and work interactively with Ctrl+Click / Shift+Click as above.

━━━━━━━━━━━━━━━━━━━━━━━━━━━━━━━━━━━━━━━━━━
SUPPORT & DEVELOPMENT
━━━━━━━━━━━━━━━━━━━━━━━━━━━━━━━━━━━━━━━━━━

SmartLine is actively developed and this listing is its home.
• Every question in the Comments tab gets a reply from the author.
• Updates are free for all buyers, always.
• The roadmap is driven by users — features are prioritized by what real traders ask for in the comments. The instrument grows in the direction its users need.
• What will never change: SmartLine stays a measurement instrument. No signal arrows will ever be bolted on. That is a design principle, not a missing feature.

━━━━━━━━━━━━━━━━━━━━━━━━━━━━━━━━━━━━━━━━━━

Launch price $99 (one-time) — this is the introductory price and it rises as the user base grows. Lock it in now.

The lever measures. The strategy is yours.

Embedded fonts: Chakra Petch (SIL Open Font License 1.1), JetBrains Mono (SIL Open Font License 1.1), Rock Salt (Apache License 2.0).
추천 제품
Volume flow Profile
Israr Hussain Shah
Master Edition은 거래량과 자금 흐름의 관점을 통해 시장 구조를 시각화하도록 설계된 전문가급 분석 도구입니다. 표준 거래량 지표와 달리, 이 도구는 차트에 일일 거래량 프로필을 직접 표시하여 가격 발견이 발생한 위치와 "스마트 머니"가 위치한 곳을 정확하게 볼 수 있게 합니다. 이 Master Edition은 명확성과 속도를 위해 설계되었으며, 로드 시 차트 레이아웃을 즉시 아름답게 만드는 독특한 자동 테마 동기화 시스템을 특징으로 합니다. 주요 기능: 진정한 자금 흐름 계산: 표준 틱 거래량을 넘어섭니다. "Use Money Flow"를 활성화하면 거래량이 가격에 따라 가중치가 부여되어 특정 가격 수준에서의 실제 자본 투입을 드러냅니다. 가치 영역(VA) 시각화: 가치 영역(기본값: 거래량의 70%)을 자동으로 계산합니다. VA Fill: 통제 구역을 즉시 식별하기 위해 가치 영역 배경을 음영 처리합니다. 주요 수준: 통제점(POC), 가치 영역 고점(VAH), 가치 영
The indicator is designed to close positions on the market in time. For example: to take profits ahead of schedule if the price has not reached TakeProfit, and the market is turning around. The indicator analyzes the momentum, not the trend. He does not give any information about the trend. The indicator is well suited for finding divergence. The Ershov 38 Parrots indicator dynamically adjusts to the market and detects price movement impulses of medium and high amplitude. It almost does not rea
The Bitcoin Reaper
Profalgo Limited
3.71 (34)
출시 프로모션: 현재 가격으로는 매우 제한된 수의 사본만 구매 가능합니다! 최종 가격: 999달러 신규(349달러부터) --> 1개 무료 증정(거래 계좌 번호 2개에 한함). 최고의 콤보 상품     ->     여기를 클릭하세요 공개 그룹에 가입하세요:   여기를 클릭하세요   LIVE SIGNAL LIVE SIGNAL V2.0 UPDATE 2.0 INFO 비트코인 리퍼에 오신 것을 환영합니다!   골드리퍼의 엄청난 성공 이후, 저는 동일한 성공 원칙을 비트코인 ​​시장에도 적용할 때가 되었다고 생각했고, 와, 정말 유망해 보이네요!   저는 20년 넘게 거래 시스템을 개발해 왔으며, "단연" 제 전문 분야는 브레이크아웃 전략입니다. 이 간단하지만 효과적인 전략은 역대 최고의 트레이딩 전략 중 하나로 자리매김하며, 사실상 모든 시장에 적용할 수 있습니다.       특히 비트코인처럼 변동성이 큰 시장에서는 더욱 빛을 발합니다!   그렇다면 이 전략은 어떻게 작동할까요? 브레이크
Blue Bird MT5
Ismail Babaoglu
BlueBird EA – Dynamic Adaptive Grid Hedge System BlueBird EA   represents a new era of grid-based automation — combining volatility awareness, adaptive trend tracking, and smart capital management. If you are seeking a   fully autonomous, dynamic grid system   capable of capturing both trends and corrections,   BlueBird EA   is your ultimate trading companion. Overview BlueBird EA is a next-generation adaptive grid trading system designed for dynamic markets such as GOLD (XAUUSD) . It intellige
Adjustable Consecutive Fractals  looks for 2 or more fractals in one direction and sends out a on screen alert, sound alert and push notification, for strong reversal points . Adjustable Consecutive Fractals, shows the fractals on chart along with a color changing text for buy and sell signals when one or more fractals appear on one side of price. Adjustable Consecutive Fractals is based Bill Williams Fractals . The standard Bill Williams fractals are set at a non adjustable 5 bars, BUT withe th
Introduction This indicator detects volume spread patterns for buy and sell opportunity. The patterns include demand and supply patterns. You might use each pattern for trading. However, these patterns are best used to detect the demand zone (=accumulation area) and supply zone (=distribution area). Demand pattern indicates generally potential buying opportunity. Supply pattern indicates generally potential selling opportunity. These are the underlying patterns rather than direct price action. T
********************************************************************************************           ---VSA Supply and Demand--- This is a actually set of three indicators that form a unity for effective monitoring of the movement of smart money. They are based on the volume and basic patterns of the VSA methodology.   1.VSA.ex5 2.Volume Supply and Demand.ex5 3.Bars and Candles Supply and Demand.ex5  But here I offer you only the first indicator, which is called the VSA indicator with basi
Here   our more valuable tools SMC Trend Trading   ,  Easy SMC Trading  ,  Institutional SMC Architect Volume Analysis Tools  ,  Volume flow Profile  ,  Market volume profile  , FVG with Volume  , Liquidity Heatmap Profile  ,  Volume Spread Analysis The    Liquidity Heatmap   is a sophisticated institutional trading tool designed to reveal where over-leveraged traders are trapped. By calculating estimated liquidation levels based on volume spikes and leverage, this indicator draws a dynamic "h
Boom Crash SMC
Israr Hussain Shah
Here   our more valuable tools SMC Trend Trading   ,  Easy SMC Trading  ,  Institutional SMC Architect Volume Analysis Tools  ,  Volume flow Profile  ,  Market volume profile  , FVG with Volume  , Liquidity Heatmap Profile  ,  Volume Spread Analysis Deriv boom and crash index spike killer system you can use it only on m5 timeframe  follow the structure and get signal with alert on phone open trade set sl tp and enjoy easy analysis and trading made simple 
Volume Profile Pro
Makarii Gubaydullin
5 (1)
가격 수준별 거래량 시각화. 계산을 위한 임의의 기간을 설정할 수 있습니다: 두 개의 수직선 사이 또는 고정 시간 간격을 설정할 수 있습니다. 히스토그램 수준은 상대적입니다: 더 넓은 막대는 거래량이 더 많음을 의미합니다. 분포의 극단값은 지지선과 저항선 수준으로 사용될 수 있습니다. 모든 스타일, 크기 및 색상은 사용자 지정이 가능합니다. 다기능 유틸리티 : 66개 이상의 기능 포함  |   질문이 있으면 저에게 연락   |  MT4 버전 인디케이터 설정에서 다음을 구성할 수 있습니다: 히스토그램 스타일: 시각적 모드:  막대 / 선 /  외곽선 / 방향 (각 수준에서 지배적인 가격 방향에 따라 색상이 달라지는 막대). 히스토그램 위치:  차트 경계 / 시간 범위 내 / 시간 범위 외 : 왼쪽 / 오른쪽. 2개의 히스토그램 색상. 히스토그램 너비. 히스토그램 크기 (% 차트 너비). 계산 설정: 범위 경계 유형:  차트 2선 사이 /  지정된 최근 분 /  오른쪽 경계 전 지
ONNYX INDICATOR 버전 1.14 MetaTrader 5용 수요·공급 구역 분석 지표입니다. 확정된 스윙을 기준으로 구역을 생성하고 ATR로 폭을 조정하며 품질을 백분율로 표시합니다. 종가가 확정된 후 생성된 BUY/SELL 신호는 사라지지 않도록 설계되었습니다. 주요 기능 - 구역 내부에 품질 백분율을 표시하는 수요·공급 구역. - 확정 봉에서 나타나는 큰 BUY/SELL 화살표. - 선택 가능한 EMA 추세 필터와 캔들 거부 확인. - 추세, 가격 레벨 및 시장 상황 패널. - 관련 경제 뉴스 최대 5개 표시. 발표 전 Forecast/Previous, 발표 후 Actual 표시. - 60초 뉴스 갱신 및 전략 테스터용 캘린더 캐시. - 팝업, 푸시 및 이메일 알림. - iCustom 버퍼: 0=BUY 가격, 1=SELL 가격. 사용 방법 차트에 지표를 적용하고 히스토리 로딩을 기다린 뒤 추세와 활성 구역을 확인하십시오. 확정 봉 신호를 개인 리스크 관리와 함께 사용하십
FVG Decision Checklist Market Structure & Decision-State Indicator This indicator is designed for logic observation and decision-state analysis , not for automatic trading. Key characteristics: Does NOT place trades Does NOT provide buy/sell signals Shows whether market conditions allow or forbid trading consideration Focuses on process and structure , not entry points The indicator evaluates: Fair Value Gap (FVG) structure quality Market behavior confirmation (sweep, impulse, retest) Volatilit
Urgently mt5
Tatiana Savkevych
The Urgently indicator is designed to quickly determine the situation in the market, reflect the state of the market and signal profitable levels for opening trades. Market conditions change quickly enough, requiring constant calibration of trading strategies. Recommended for use in conjunction with any of the oscillators. The Urgently forex market trend indicator shows the trend direction and entry points. It smooths out price fluctuations when generating a signal by averaging the data and the
Volume Profile Multiple — 알고리즘 트레이딩을 위한 버퍼 지원 다중 블록 볼륨 프로파일 타임프레임을 바꿀 때마다 볼륨 프로파일을 블록별로 다시 그리고 재계산하는 데 지치셨나요? Volume Profile Multiple 은 차트에 여러 개의 연속된 볼륨 프로파일을 자동으로 그려주어, 마지막으로 표시된 구간뿐만 아니라 시장의 각 구간에서 기관의 관심이 실제로 어디에 있었는지를 보여줍니다. 이 지표가 하는 일 이 지표는 가격 히스토리를 N개의 캔들 단위로 블록화합니다(블록 개수와 블록당 캔들 수는 자유롭게 설정 가능). 각 블록마다 완전한 볼륨 프로파일을 계산합니다: 컨트롤 포인트(POC), 밸류 에어리어 상단/하단(VAH/VAL), 그리고 고거래량 구간과 저거래량 구간(HVN/LVN)입니다. 그 결과 블록별 시장 구조를 시각화한 지도가 만들어지며, 이를 통해 실제 거래량 기반의 매집 구간, 지지/저항, 그리고 밸류 에어리어 간 가격 순환을 파악할 수 있습니다. 알고
Nexus Target Pro Indicator Product Overview Nexus Target Pro is a technical indicator designed for breakout zone analysis. The tool charts a dynamic breakout box based on user-defined time ranges and plots arrow signals when price breaks out of the established zones. Technical Features Signal Generation: Displays non-repainting breakout direction arrows on the chart. Target Levels: Plots up to 5 calculated profit target levels based on the breakout box structure. Risk Levels: Displays a sugges
PinPoint Level
Paulo Roberto Jusviak Dambros
Pinpoint Level is the indicator for Day Traders and Scalpers. Developed to deliver precision when entering or exiting trades without the need for manual configuration. Just drag it onto the chart and it will instantly map the most critical price zones for the current session. Ideal for Forex, Indices, and Cryptocurrencies, it automatically calculates the previous day's range and projects exact Fibonacci-based Support and Resistance expansions, keeping your chart clean and your focus on what mat
FREE
TECHNICAL SPECIFICATION — PRICE CONTEXT, VOLUME AND MARKET INTEREST REGIONS INDICATOR Develop an indicator based on the analysis of price context, volume, and market structure , with the purpose of identifying and visually representing areas of market interest on the chart. The system should use lines, zones, and arrow markers to highlight relevant areas of the market, including situations where a significant buying or selling effort has occurred, providing the user with a clear visual represent
Tesla Gates 369
issam rahhal sabour
Automate Gann's Market Geometry: The Ultimate MT5 Indicator for Predicting Price Cycles & Key Levels Stop guessing and start knowing. The indicator does the complex math for you, transforming W.D. Gann's profound theories into clear, actionable trading signals on your chart. Are you struggling to... Manually calculate pivotal support and resistance levels? Identify high-probability reversal zones in a chaotic market? Understand how to apply Gann's concepts to modern trading? Keep track of your a
Risk Guard Pro
Muniz Machado Thiago
RiskGuard PRO – Defesa Inteligente para Traders Sérios no EURJPY M15 O RiskGuard PRO é um Expert Advisor de alto desempenho, projetado exclusivamente para o par EURJPY no timeframe M15 , com foco total em preservação de capital, gestão de risco avançada e execução estratégica de múltiplas abordagens operacionais . Ao contrário dos EAs tradicionais, o RiskGuard PRO foi desenvolvido com tecnologia proprietária e arquitetura inteligente , capaz de operar com segurança mesmo em ambientes de merc
AlphaPrime
Richard Horlock
AlphaPrime AlphaPrime is a discretionary market analysis indicator for MetaTrader 5 designed to provide multi time frame directional bias and structural context . It supports decision making by highlighting market structure, key levels, and higher time frame alignment. AlphaPrime does not execute trades and does not provide guaranteed signals. It is intended for traders who want a clear analytical framework rather than automated entries. Key Features • Multi time frame directional bias visualiz
The indicator calculates ZigZag using the classic algorithm with three parameters: Depth, Deviation, and Backstep. Its main function is detecting and visualizing repaints — moments when the last ZigZag point shifts to a new bar. Upon loading, the indicator performs a simulation over the specified history depth. The algorithm sequentially recalculates ZigZag for each bar, comparing the current position of the last point with the previous one. If a shift is detected, a repaint line appears on the
FREE
Manyal trading system, CovEchoTrend Robot, focuses on reliability and flexibility. By employing statistical analysis methods to study the relationships between the base indicator and market patterns, the system enables a deeper understanding of market processes. Intelligent pattern analysis: The application of statistical data processing helps identify key trend reversal points more accurately, signaling significant market shifts. Informed decision-making is based on the intersection of indicato
HAWK 4.0 — GOLD SIGNAL INDICATOR The most precise signal indicator  for XAUUSD (Gold) trading. Built on ATR Bands + Pivot detection. Signals appear only at real reversal points. No repaint. No delay. No noise. WHAT YOU GET → Clear BUY / SELL arrows → Auto TP1 / TP2 / TP3 levels → Auto SL level → Built-in time filter (UTC) → Real-time success statistics → Full alert system DESIGNED FOR Symbol:    XAUUSD (Gold) Timeframe: M3 / M5 Ses
Old School Reversal Zones
Kavita Krishnakumar Ojha
I'll keep it Short and to the point.  Let Your Backtest Results Speak for Themselves. After much deliberation, we’ve decided to release the foundational logic behind our process for public use. This isn’t about changing the way you trade—because we know that’s unique to you. The best ways to enter a position? Those have always been confidential ! What we can share is the first of three essential steps we use before entering any trade. This tool is designed to keep you on the right side of the m
LiquiditySweepEngineAutoTargets Advanced Liquidity, Market Structure & Precision Signal Indicator for MetaTrader 4 LiquiditySweepEngineAutoTargets is an advanced multi-layer market analysis indicator designed to identify high-probability trading opportunities by combining market structure, liquidity behavior, order blocks, breakout confirmation, retests, dynamic support and resistance, higher-timeframe bias, and a weighted confluence scoring system into one unified MT4 trading tool. The system
RevTech
Bashier Awny Husein Ismail Alhafy
Revtech MT5 Indicator brings together institutional concepts, market-structure logic, and classic price action patterns in one advanced trading tool. From Fair Value Gaps and Order Blocks to Head & Shoulders and Triangle formations, Revtech helps traders identify quality setups with clear chart visuals and execution levels. With dashboard monitoring, alerts, and timeframe-based strategy alignment, Revtech is designed to turn raw price action into a structured trading opportunity. The indicator
BoxProfile MT5
Evgeny Shevtsov
4.6 (10)
The indicator displays volume profiles based on the nesting principle. Profiles periods are pre-set so that each subsequent profile has a length twice as long as the length of the previous profile. In addition to profiles, the indicator displays volume clusters sorted by color, depending on the volume they contain. Indicator operation features The indicator works on typical timeframes from M5 to MN, but for calculations uses historical data from smaller timeframes: M1 - for timeframes from M5
FREE
Favero Buy and Hold
Alexandre Favero
Indicator Description Opportunity Identification Indicator — Smart Money This indicator was developed to assist in identifying moments when prices may be reaching areas of greater interest , seeking possible signals in market behavior associated with the concept of “smart money” (Smart Money) , widely discussed in financial literature and market studies. The proposal is to create a bridge between technical analysis and fundamental analysis . The indicator uses technical analysis and price behavi
TradeAQ
Guo Sheng Zhao
LuoMo Volume & Price Structure 8.98 A multi-function chart indicator for   MetaTrader 4 and MetaTrader 5 , designed to display key volume, volatility, sentiment, and price-structure information directly on the main chart. Main Features Volume and price-based Support & Resistance Volume spike and exhaustion signals ATR volatility expansion alerts Volume Profile with HVN and LVN Bullish and bearish sentiment distribution Developing or fixed POC VAH and VAL levels Supply and Demand zones Volume-wei
Delta Profile Volume
Teresinha Moraes Correia
기술 설명 – MetaTrader 5용 Delta Profile Delta Profile 은 MetaTrader 5에서 정의된 캔들 범위 내의 거래량 흐름을 세부적으로 분석하기 위해 설계된 지표입니다. 이 도구는 각 가격 수준에서 양의 거래량(상승과 관련) 과 음의 거래량(하락과 관련) 간의 불균형을 구조화하고 시각화합니다. 이를 통해 사용자는 실제로 거래가 집중되는 가격 영역과 시장 불균형이 형성되는 구간을 명확하게 파악할 수 있습니다. 핵심 개념 지표는 가격 레벨 을 인식하고 이를 양의 거래량, 음의 거래량 및 순 델타(양-음 차이)로 분류합니다. 각 가격 레벨은 수평 막대 로 차트에 표시되며, 거래가 집중되는 구간을 직관적으로 보여줍니다. 사용자는 분석할 캔들의 개수 , 가격 반올림 정밀도 , 최대 표시 레벨 수 , 표시 옵션 등을 직접 설정할 수 있습니다. 주요 기능 가격 레벨 매핑 : 사용자가 지정한 자릿수에 맞게 가격을 반올림하여 거래량을 집계합니다. 순 델타 계산 : 양
이 제품의 구매자들이 또한 구매함
Trend Sniper X
Sarvarbek Abduvoxobov
4.9 (41)
Trend Sniper X 는 트레이더가 추세 방향과 잠재적 반전 지점을 명확하고 정확하게 포착할 수 있도록 도와주는 MetaTrader 5용 멀티 타임프레임 추세 추종 지표입니다. MT4용: https://www.mql5.com/en/market/product/193245 가격 정보: 현재 가격은 프로모션 할인가이며, 향후 업데이트 및 새로운 기능이 출시됨에 따라 변동될 수 있습니다. 보너스 혜택: 본 지표 전용 무료 자동매매 Assistant EA를 받으시려면 구매 후 작성자에게 메시지를 보내주시기 바랍니다. Code2Profit 채널 멀티 타임프레임 분석으로 시장을 마스터하세요! Trend Sniper X로 승률을 극대화하는 방법: 핵심 규칙 및 세션 팁 기술 사양 플랫폼 MetaTrader 5 지표 유형 멀티 타임프레임 추세 지표 운용 타임프레임 모든 차트 타임프레임 지원, 독립적으로 선택 가능한 상위 타임프레임(M1–MN1) 주요 상품 외환, 금(XAUUSD) 및 기타 C
Entry Points Pro for MT5
Yury Orlov
4.52 (151)
전설이 돌아왔습니다: Entry Points Pro 10. MQL5 마켓 Top-3 자리를 3년간 지켜온 전설적인 지표의 재출시입니다. 수백 개의 호평 리뷰(두 버전 합산 589개), 매일 이 지표로 거래하는 수천 명의 트레이더, 31,000회 이상의 데모 다운로드   MT4+MT5 . 지난 5년간 여러분이 남긴 리뷰를 하나도 빠짐없이 읽었고, 약속 대신 그 답을 버전 10에 담았습니다. 1999년부터 시장에서 활동하며 정직함과 자신의 평판, 그리고 고객을 소중히 여기는 개발자가 만들었습니다. Entry Points Pro의 진입 시그널은 절대 리페인팅되지 않습니다. 그리고 이번에는 개발자의 말뿐이 아니라 검증 가능한 사실입니다: 확정 시그널은 캔들 종가에서만 표시되며, 자동화 테스트에서 리페인팅 0건 이 확인되었습니다(EURUSD, XAUUSD, BTCUSD에서 2,486,568회의 불변조건 검사 — 위반 0건). 검증 방법은 공개되어 있으니 전략 테스터에서 직접 재현해 보실 수
Neuro Poseidon MT5
Daria Rezueva
4.75 (52)
Neuro Poseidon is a new indicator by Daria Rezueva. It combines precise trading signals with adaptive TP/SL levels - creating best possible trades as a result! Message me and get  Neuro Poseidon Assistant  as a gift to automize your trading process! What makes it stand out? 1. Proven profitability on all assets and timeframes 2. Only confirmed BUY and SELL signals present on the chart 3. Adaptive TP & SL levels generated by the software for each trade 4. Easy to understand - suitable for al
Adaptive Price Action Engine 지표를 구매하면 EA(자동매매 프로그램)가 무료 멀티 타임프레임 기반 자기 최적화 추세 & 캔들 패턴 분석 시스템 시장은 끊임없이 변화하며, 모든 Price Action 패턴이 모든 시장 환경에서 동일한 가치를 가지는 것은 아닙니다. Adaptive Price Action Engine 은 변화하는 시장 환경에 적응할 수 있도록 설계되었으며, 추세 구조, 멀티 타임프레임 분석, 캔들 패턴 및 통계적 최적화 를 하나의 분석 프레임워크로 결합합니다. 두 가지 적응형 모드 Dual Alpha Trend Mode 낮은 타임프레임과 높은 타임프레임에서 적합한 Alpha Trend 파라미터를 자동으로 탐색하여, 최근 시장 움직임에 맞춰 추세 분석을 조정합니다. Candlestick + Alpha Mode Alpha Trend를 통한 시장 국면 분석과 22개의 상승 및 하락 캔들 패턴 을 결합합니다. 모든 패턴을 동일하게 취급하는 대신, 다양
M1 Sniper MT5
Oleg Rodin
5 (7)
M1 SNIPER 는 사용하기 쉬운 거래 지표 시스템입니다. M1 시간대에 맞춰 설계된 화살표 지표입니다. 이 지표는 M1 시간대 스캘핑을 위한 단독 시스템으로 사용할 수 있으며, 기존 거래 시스템의 일부로도 사용할 수 있습니다. 이 거래 시스템은 M1 시간대 거래용으로 특별히 설계되었지만, 다른 시간대에도 사용할 수 있습니다. 원래는 XAUUSD와 BTCUSD 거래를 위해 이 방법을 설계했지만, 다른 시장 거래에도 유용하다는 것을 알게 되었습니다. 이 지표의 신호는 추세 방향과 반대로 거래될 수 있습니다. 저는 지표의 신호를 활용하여 양방향으로 거래할 수 있도록 돕는 특별한 거래 기법을 알려드립니다. 이 방법은 특별한 동적 지지선과 저항선 가격 영역을 활용하는 것을 기반으로 합니다. 구매하시면 M1 SNIPER 화살표 지표를 바로 다운로드하실 수 있습니다. 또한, 아래 스크린샷에 표시된 Apollo Dynamic SR 지표는 M1 SNIPER 도구를 사용하는 모든 사용자에게 무료로
Gann Made Easy MT5
Oleg Rodin
5 (11)
Gann Made Easy 는 mr.의 이론을 사용하여 최고의 거래 원칙을 기반으로 하는 전문적이고 사용하기 쉬운 Forex 거래 시스템입니다. W.D. 간. 이 표시기는 Stop Loss 및 Take Profit Levels를 포함하여 정확한 BUY 및 SELL 신호를 제공합니다. PUSH 알림을 사용하여 이동 중에도 거래할 수 있습니다. 구매 후 거래 방법 안내 및 유용한 추가 지표를 무료로 받으시려면 저에게 연락주세요! 아마도 Gann 거래 방법에 대해 이미 여러 번 들었을 것입니다. 일반적으로 Gann의 이론은 초보자 거래자뿐만 아니라 이미 거래 경험이 있는 사람들에게도 매우 복잡한 것입니다. Gann의 거래 방식은 이론적으로 적용하기 쉽지 않기 때문입니다. 나는 그 지식을 연마하고 Forex 지표에 최고의 원칙을 적용하기 위해 몇 년을 보냈습니다. 표시기는 적용하기가 매우 쉽습니다. 차트에 첨부하고 간단한 거래 권장 사항을 따르기만 하면 됩니다. 지표는 지속적으로 시장 분석
Auto Optimized SpeedAngle 은 지속적인 워크포워드 최적화(Walk-Forward Optimization, WFO)를 통해 곡선 적합(curve-fitting)을 제거한 기관 수준의 모멘텀 벡터화 시스템입니다. 시장 체제가 바뀔 때 성능이 떨어지는 정적 입력에 의존하는 대신, 이 지표는 표본 외(Out-of-Sample, OOS) 검증을 사용하여 매개변수를 동적으로 재보정하며, 표시되는 신호가 과거의 우연이 아닌 진정한 통계적 우위를 나타내도록 보장합니다. 핵심 기관용 프레임워크 워크포워드 최적화 엔진: 핵심 알고리즘은 수천 가지의 룩백(lookback) 및 임계값 조합을 지속적으로 스캔하며, 데이터를 인샘플(in-sample)과 표본 외(out-of-sample) 세트로 엄격하게 분리합니다. 미지의 데이터 환경에서 수학적 우수성이 증명된 경우에만 새로운 매개변수 구성을 채택합니다. 정량적 목적 함수: 순수한 총이익을 쫓는 대신, 최적화 엔진은 기관 수준의 안정성
ARIPoint
Temirlan Kdyrkhan
1 (4)
ARIPoint is a powerful trading companion designed to generate high-probability entry signals with dynamic TP/SL/DP levels based on volatility. Built-in performance tracking shows win/loss stats, PP1/PP2 hits, and success rates all updated live. Key Features: Buy/Sell signals with adaptive volatility bands Real-time TP/SL/DP levels based on ATR Built-in MA Filter with optional ATR/StdDev volatility Performance stats panel (Success, Profit/Loss, PP1/PP2) Alerts via popup, sound, push, or email Cu
Scalper Vault MT5
Oleg Rodin
5 (1)
Scalper Vault 는 성공적인 스캘핑에 필요한 모든 것을 제공하는 전문 스캘핑 시스템입니다. 이 표시기는 외환 및 바이너리 옵션 거래자가 사용할 수 있는 완전한 거래 시스템입니다. 권장 시간 프레임은 M5입니다. 시스템은 추세 방향으로 정확한 화살표 신호를 제공합니다. 또한 상단 및 하단 신호와 Gann 시장 수준을 제공합니다.  이 시스템은 사용하기가 매우 쉽습니다. 원하는 시장 지역의 화살표만 따라가면 됩니다. 엑시트는 가격이 적정 수준에 도달하거나 시장의 고점 또는 저점 신호가 나타날 때 수행됩니다.  표시기는 PUSH 알림을 포함한 모든 유형의 경고를 제공합니다. 인디케이터 구매 후 연락주세요. 내 개인 거래 권장 사항과 훌륭한 보너스 지표를 무료로 공유합니다! 나는 당신에게 행복하고 유익한 거래를 기원합니다!
안녕하세요, 트레이더 여러분! 많은 개인 투자자들이 느린 웹 스크립트에 의존하고 있습니다. 수익성 있는 거래를 위해서는 체계적인 프레임워크가 필수적입니다. Astro AI 지표는 단순한 차트 오버레이가 아닙니다. 터미널에서 직접 실행되는 두 개의 에이전트로 구성된 정교한 신경망입니다. 시스템 기술 상세 설명: 1. 에이전트 1: 분석가 (그래픽 신경망 – GNN) 시장은 개별 가격 막대로 이루어진 것이 아니라 상호 연결된 데이터 네트워크입니다. 기능: 에이전트 1은 그래픽 신경망을 사용하여 이러한 복잡하고 비선형적인 관계를 파악합니다. 장점: 기존 지표는 과거 이동 평균만을 고려하는 반면, 저희 GNN은 시장의 심층적인 구조적 관계를 실시간으로 처리하여 개별 트레이더의 거래량이 시장에 큰 영향을 미치기 전에 숨겨진 상관관계를 찾아냅니다. 2. 에이전트 2: 실행기 (근접 전략 최적화 – PPO) 패턴 인식은 절반의 성공일 뿐입니다. 현재 시장 변동에 기반하여 올바른
Divergence Bomber
Ihor Otkydach
4.89 (94)
이 지표를 구매하신 분께는 다음과 같은 혜택이 무료로 제공됩니다: 각 거래를 자동으로 관리하고, 손절/익절 수준을 설정하며, 전략 규칙에 따라 거래를 종료하는 전용 도우미 툴 "Bomber Utility" 다양한 자산에 맞게 지표를 설정할 수 있는 셋업 파일(Set Files) "최소 위험", "균형 잡힌 위험", "관망 전략" 모드로 설정 가능한 Bomber Utility의 셋업 파일 이 전략을 빠르게 설치, 설정, 시작할 수 있도록 돕는 단계별 영상 매뉴얼 주의: 위의 모든 보너스를 받기 위해서는 MQL5 개인 메시지 시스템을 통해 판매자에게 연락해 주세요. 독창적인 커스텀 지표인 “Divergence Bomber(다이버전스 봄버)”를 소개합니다. 이 지표는 MACD 다이버전스(괴리) 전략을 기반으로 한 올인원(All-in-One) 거래 시스템입니다. 이 기술 지표의 주요 목적은 가격과 MACD 지표 간의 다이버전스를 감지하고, **향후 가격이 어느 방향으로 움직일지를 알려주
PainX GainX Blue Spike Fusion AI Advanced Synthetic Index Spike Detection Indicator for MetaTrader 5 Discover potential spike setups with a clear, organized, and professional trading interface. PainX GainX Blue Spike Fusion AI is a specialized indicator designed for traders who monitor synthetic indices and want a structured way to observe potential price spike opportunities. The indicator combines signal monitoring, market-condition analysis, visual alerts, and event tracking in one convenient
Volatility Master for MetaTrader is a real-time dashboard tool that scans up to  50 symbols  to identify high-volatility , trending markets instantly. With bullish/bearish signals, customizable alerts, and a user-friendly interface, it helps you avoid range-bound conditions and focus on high-probability trades. Clarity leads to confidence. Trade confidently and protect your capital effectively with this powerful dashboard. We don't offer free or bonus indicators in exchange of reviews from you.
Quantum TrendPulse
Bogdan Ion Puscasu
5 (26)
SuperTrend   ,   RSI   ,   Stochastic   의 힘을 하나의 포괄적인 지표로 결합하여 트레이딩 잠재력을 극대화하는 궁극의 트레이딩 도구   인 Quantum TrendPulse를   소개합니다. 정밀성과 효율성을 추구하는 트레이더를 위해 설계된 이 지표는 시장 추세, 모멘텀 변화, 최적의 진입 및 종료 지점을 자신 있게 식별하는 데 도움이 됩니다. 주요 특징: SuperTrend 통합:   주요 시장 추세를 쉽게 따라가고 수익성의 물결을 타세요. RSI 정밀도:   매수 과다 및 매도 과다 수준을 감지하여 시장 반전 시점을 파악하는 데 적합하며 SuperTrend 필터로 사용 가능 확률적 정확도:   변동성이 큰 시장에서 숨겨진 기회를 찾기 위해 확률적 진동   을 활용하고 SuperTrend의 필터로 사용 다중 시간대 분석:   M5부터 H1 또는 H4까지 다양한 시간대에 걸쳐 시장을 최신 상태로 유지하세요. 맞춤형 알림:   맞춤형 거래 조건이 충족되면
소개       Quantum Breakout PRO   , 브레이크아웃 존 거래 방식을 변화시키는 획기적인 MQL5 지표! 13년 이상의 거래 경험을 가진 숙련된 트레이더 팀이 개발한       퀀텀 브레이크아웃 PRO       혁신적이고 역동적인 브레이크아웃 존 전략으로 거래 여정을 새로운 차원으로 끌어올리도록 설계되었습니다. Quantum Breakout Indicator는 5개의 이익 목표 영역이 있는 브레이크아웃 영역의 신호 화살표와 브레이크아웃 상자를 기반으로 한 손절 제안을 제공합니다. 초보자 거래자와 전문 거래자 모두에게 적합합니다. Quantum EA 채널:       여기를 클릭하세요 중요한! 구매 후 설치 매뉴얼을 받으려면 개인 메시지를 보내주십시오. 추천: 기간: M15 통화쌍: GBPJPY, EURJPY, USDJPY,NZDUSD, XAUUSD 계정 유형: 스프레드가 매우 낮은 ECN, Raw 또는 Razor 브로커 시간: GMT +3 중개인 :
PZ Divergence Trading MT5
PZ TRADING SLU
3.71 (7)
Unlock hidden profits: accurate divergence trading for all markets Tricky to find and scarce in frequency, divergences are one of the most reliable trading scenarios. This indicator finds and scans for regular and hidden divergences automatically using your favourite oscillator. [ Installation Guide | Update Guide | Troubleshooting | FAQ | All Products  ] Easy to trade Finds regular and hidden divergences Supports many well known oscillators Implements trading signals based on breakouts Displays
Gartley Hunter Multi
Siarhei Vashchylka
5 (12)
Gartley Hunter Multi - An indicator for searching for harmonic patterns simultaneously on dozens of trading instruments and on all possible timeframes. Manual (Be sure to read before purchasing) | Version for MT4 Advantages 1. Patterns: Gartley, Butterfly, Shark, Crab. Bat, Alternate Bat, Deep Crab, Cypher 2. Simultaneous search for patterns on dozens of trading instruments and on all possible timeframes 3. Search for patterns of all possible sizes. From the smallest to the largest 4. All fou
Quantum Direction 은 시장 방향을 파악하고, 초기 추세 변화를 감지하며, 필터링된 진입 및 청산 신호를 제공하도록 설계된 전문 추세 추종 지표입니다. 이 지표에는 MQL5 Market에서 무료로 제공되는 전문 거래 관리 도구 Quantum Trade Assistant 가 포함되어 있습니다. Quantum Direction 에 직접 연결하여 유효한 신호가 발생하면 자동으로 거래를 실행하거나, 설정된 청산 조건이 충족되면 자동으로 거래를 종료할 수 있습니다. 무료 Quantum Trade Assistant 다운로드 이 지표의 주요 기능: 다중 로직 추세 감지 — 여러 시장 분석 조건을 결합하여 잠재적인 추세 시작과 추세 방향 변화를 감지합니다. 세션 필터 — 선택한 거래 세션에 신호를 집중하여 시장 활동과 변동성이 높은 시간대의 시장 기회를 분석하는 데 도움을 줍니다. 상위 타임프레임 필터 — 상위 타임프레임을 사용하여 시장 방향을 확인하고 단기 돌파 또는 일시적인 시장
M1 Quantum MT5
Hamed Dehgani
4.2 (10)
M1 Quantum을 이용한 실시간 트레이딩 신호 : 신호   ( Quantum Trade Assistant 에 의해 거래가 자동으로 실행되며, 이 제품에 무료 로 포함되어 있습니다.) 최신 소식: 버전 1.64가 출시되었습니다. 이제 모든 거래에는 해당 지지/저항 구간 뒤에 Stop Loss가 설정됩니다. 또한 이번 버전에서는 EA의 성능을 향상시키기 위해 Smart Close 기능이 개선되었습니다. 8월 9일부터 라이브 신호는 버전 1.64로 운영되고 있습니다. 가격 계획: 현재 가격: $169 (얼리 어답터 혜택) 다음 예정 가격: $189 예정 소매 가격: $299 개발자 안내: 구매 후 저에게 연락하시면 최신 권장 설정 파일(Set File) , 사용 팁, 그리고 다른 M1 Quantum 사용자들과 소통할 수 있는 VIP 지원 그룹 초대장을 받으실 수 있습니다. 자주 묻는 질문 - 설정 파일 - 설치 가이드 M1 Quantum 은 M1 전용 전문 트레이딩 시스템으로, 손
Advanced Currency Strength28 MT5
Bernhard Schweigert
5 (3)
초보자 또는 전문가 트레이더를 위한 최고의 솔루션! 이 지표는 우리가 독점 기능과 새로운 공식을 통합했기 때문에 독특하고 고품질이며 저렴한 거래 도구입니다. 단 하나의 차트로 28 Forex 쌍의 통화 강도를 읽을 수 있습니다! 새로운 추세 또는 스캘핑 기회의 정확한 트리거 포인트를 정확히 찾아낼 수 있기 때문에 거래가 어떻게 개선될지 상상해 보십시오. 사용 설명서: 여기를 클릭  https://www.mql5.com/en/blogs/post/697384 그것이 첫 번째, 원본입니다! 쓸모없는 지망생 클론을 사지 마십시오. 더 스페셜  강력한 통화 모멘텀을 보여주는 하위 창의 화살표 GAP가 거래를 안내합니다! 기본 또는 호가 통화가 과매도/과매도 영역(외부 시장 피보나치 수준)에 있을 때 개별 차트의 기본 창에 경고 표시가 나타납니다. 통화 강도가 외부 범위에서 떨어질 때 풀백/반전 경고. 교차 패턴의 특별 경고 추세를 빠르게 볼 수 있는 다중 시간 프레임 선택이 가능합
초보자 또는 전문가 트레이더를 위한 최고의 솔루션! 이 지표는 우리가 독점 기능과 비밀 공식을 통합했기 때문에 독특하고 고품질이며 저렴한 거래 도구입니다. 단 하나의 차트로 28개 통화 쌍 모두에 대한 경고를 제공합니다. 새로운 추세 또는 스캘핑 기회의 정확한 트리거 포인트를 정확히 찾아낼 수 있기 때문에 거래가 어떻게 개선될지 상상해 보십시오! 새로운 기본 알고리즘을 기반으로 구축되어 잠재적인 거래를 훨씬 더 쉽게 식별하고 확인할 수 있습니다. 이는 통화의 강세 또는 약세가 가속되는지 여부를 그래픽으로 표시하고 가속 속도를 측정하기 때문입니다. 자동차의 속도계처럼 생각하면 됩니다. 가속화할 때 Forex 시장에서 동일한 일이 분명히 더 빠르게 발생합니다. 즉, 반대 방향으로 가속화되는 통화를 페어링하면 잠재적으로 수익성 있는 거래를 식별한 것입니다. 통화 모멘텀의 수직선과 화살표가 거래를 안내합니다! 역동적인 Market Fibonacci 23 레벨은 경고 트리거로 사용되며
Trend Lines PRO MT5
Roman Podpora
5 (1)
트렌드 라인즈 프로       이 지표는 시장이 실제로 어떤 방향으로 전환되는지 파악하는 데 도움이 됩니다. 실제 추세 반전 지점과 주요 시장 참여자들이 다시 진입하는 지점을 보여줍니다. 보시다시피       BOS 라인       복잡한 설정이나 불필요한 노이즈 없이 더 높은 시간대의 추세 변화와 주요 레벨을 확인할 수 있습니다. 신호는 차트에 다시 그려지지 않고 캔들이 마감된 후에도 계속 표시됩니다. VERSION MT 4   -   RFI LEVELS PRO   표시기   와 결합할 때 최대 잠재력을 발휘합니다. 지표가 보여주는 내용: 실제 변화       추세(BOS 라인) 한 번 신호가 나타나면 그 신호는 계속 유효합니다! 이는 신호를 발생시킨 후 변경될 수 있는 리페인팅 방식의 지표와 중요한 차이점입니다. 리페인팅 방식의 지표는 잠재적으로 자금 손실로 이어질 수 있습니다. 이제 더욱 높은 확률과 정확도로 시장에 진입할 수 있습니다. 또한 화살표가 나타난 후 목표가(익절)
CRT Pro is a complete Candle Range Theory toolkit for MetaTrader 5. It finds the CRT model on up to three timeframes and adds the tools needed to read it: higher-timeframe candles, structure shifts, fair value gaps, liquidity sweeps, a bias table and SSMT divergence. Every module can be switched on or off. 1. CRT Model A CRT model is built from two candles of the chosen CRT timeframe. C1 is the range candle. C2 is the sweep candle: it takes the high or the low of C1 and closes back inside the
통화 강도 마법사는 성공적인 거래를 위한 올인원 솔루션을 제공하는 매우 강력한 지표입니다. 표시기는 여러 시간 프레임의 모든 통화 데이터를 사용하여 이 또는 해당 외환 쌍의 힘을 계산합니다. 이 데이터는 특정 통화의 힘을 확인하는 데 사용할 수 있는 사용하기 쉬운 통화 지수 및 통화 전력선의 형태로 표시됩니다. 필요한 것은 거래하려는 차트에 표시기를 부착하는 것뿐입니다. 표시기는 거래하는 통화의 실제 강세를 보여줍니다. 지표는 또한 추세와 거래할 때 유리하게 사용할 수 있는 구매 및 판매 거래량 압력의 극한값을 보여줍니다. 지표는 또한 피보나치에 기반한 가능한 대상을 보여줍니다. 표시기는 PUSH 알림을 포함한 모든 유형의 알림을 제공합니다. 구매 후 연락주세요. 나는 당신과 거래 팁을 공유하고 당신에게 무료로 훌륭한 보너스 지표를 줄 것입니다! 나는 당신에게 행복하고 유익한 거래를 기원합니다!
ICT PO3 (Power of 3) AMD Protocol Framework Indicator True Time & Structure Integration   |  Non-Repainting | Real-Time  | Multi-Asset  | MT4 Version Available Full Setup Guide & Strategy Playbook: https://www.mql5.com/en/blogs/post/768683 The ICT Power of Three (PO3): The Complete Guide to Accumulation, Manipulation, and Distribution https://www.mql5.com/en/blogs/post/771729 MT4 Version: https://www.mql5.com/en/market/product/171742 Indicator Overview The ICT PO3 AMD Protocol Framework i
RelicusRoad Pro MT5
Relicus LLC
4.96 (25)
거래를 더 이상 감으로 하지 마세요. 언제 진입할지, 어디서 청산할지, 시장이 어느 쪽으로 기울어 있는지를 한 차트에서 확인하세요. RelicusRoad Pro는 20개 가까운 도구를 인디케이터 하나에 담았고, 내 매매 방식에 맞는 도구만 켜서 쓰면 됩니다. 명확한 진입. 명확한 청산. 차트마다 확실한 계획. 이런 경험, 익숙하지 않으신가요? 매수하면 1분 뒤 가격이 반대로 돌아섭니다. 너무 일찍 청산하고, 그다음 움직임이 나 없이 이어지는 것을 지켜봅니다. 지표를 5개 띄우면 답도 5가지가 나옵니다. 손절(스톱로스)은 그냥 감입니다. 우리가 이걸 만든 이유 우리는 18년 동안 외환 거래를 해 왔습니다. RelicusRoad는 처음에 우리끼리 쓰려고, 전문 트레이더 모임을 위해 비공개로 만들었습니다. 이유는 개인적이었습니다. 같은 선을 손으로 계속 그리는 일에 지쳤고, 스스로 정한 규칙을 어기고, 차트에서 정말 중요한 한 가지를 놓치곤 했습니다. 우리에게 통한 것은 일관성입니다. 매
Bill Williams Advanced
Siarhei Vashchylka
5 (11)
Bill Williams Advanced is designed for automatic chart analysis using Bill Williams' "Profitunity" system. The indicator analyzes four timeframes at once. Manual (Be sure to read before purchasing) Advantages 1. Analyzes the chart using Bill Williams' "Profitunity" system. Signals are displayed in a table in the corner of the screen and on the price chart. 2. Finds all known AO and AC signals, as well as zone signals. Equipped with a trend filter based on the Alligator. 3. Finds "Divergence Bar
Advanced Supply Demand MT5
Bernhard Schweigert
4.53 (15)
현재 33% 할인! 초보자나 전문 트레이더를 위한 최고의 솔루션! 이 보조지표는 우리가 다수의 독창적 기능과 새로운 공식을 통합한 독특하고 고품질이며 저렴한 거래 도구입니다. 이 업데이트를 통해 이중 시간대를 표시할 수 있습니다. 더 높은 TF를 표시할 수 있을 뿐만 아니라 차트 TF와 더 높은 TF 모두를 표시할 수 있습니다: 중첩 영역 표시. 모든 Supply Demand 트레이더들이 좋아할 것입니다. :) 중요한 정보 공개 Advanced Supply Demand의 잠재력을 극대화하려면 다음을 방문하십시오. https://www.mql5.com/ko/blogs/post/720245   진입 또는 목표의 명확한 트리거 포인트를 정확히 찾아냄으로 해서 거래가 어떻게 개선될지 상상해 보십시오. 새로운 알고리즘을 기반으로 매수자와 매도자 간의 잠재적인 불균형을 훨씬 더 쉽게 분간할 수 있습니다. 왜냐하면 가장 강한 공급영역과 가장 강한 수요 영역과 과거에 어떻게 진행 되었는지를(이전
Boba Analysis Suite Boba Analysis Suite는 MetaTrader 5용 분석 지표입니다. 시장 구조, 주요 가격 영역, 전반적인 시장 상황을 하나의 차트 화면에 통합하여 표시합니다. 트레이더이자 트레이딩 코치로서의 실무 경험을 바탕으로 개발되었으며, 시장 방향 평가, 주요 가격 수준 식별, 여러 시간대의 종합적인 분석 등 체계적인 분석 과정을 지원합니다. 시장 맥락을 고려한 분석 개별 신호의 의미는 시장 상황에 따라 달라집니다. Boba Analysis Suite는 현재 차트 상황을 더 넓은 시장 구조와 연결하고, 사전에 정한 규칙에 따라 매매 아이디어를 검토할 수 있도록 돕습니다. 주요 분석 기능은 다음과 같습니다. 추세 및 시장 구조: 시장 방향과 관련 구조적 맥락을 평가합니다. 주요 가격 영역 및 수준: 추가 분석이 필요한 중요한 영역을 차트에 시각적으로 표시합니다. 여러 시간대: 서로 다른 시간대의 정보를 통합하여 전반적인 시장 상황을 평가합니다.
Superhero
Ihor Otkydach
5 (3)
SUPERHERO 지표는 “올인원” 방식으로 설계된 다중 통화 거래 시스템입니다. 이 지표는 시장을 독자적으로 분석하여 포지션을 개설하고 청산할 시점에 대한 신호를 제공합니다. 손절매(Stop Loss) 및 익절(Take Profit) 주문을 활용하며, 위험 대비 수익 비율(R:R)은 1:1입니다. 이 시스템은 스마트폰으로 푸시 알림을 전송할 수 있으므로, PC에 묶여 있을 필요 없이 “이동 중에도” 매매를 할 수 있습니다. 이는 자체 거래 전문 회사에 안성맞춤입니다. 모든 고객님께 드리는 특별 혜택: 이 지표를 구매하시는 모든 분께는 제가 특별히 준비한 유틸리티를 선물로 드릴 예정이며, 이 유틸리티는 다음과 같은 기능을 제공합니다: 손절매 및 익절 주문을 자동으로 설정합니다 가격이 목표 수준에 도달하면 자동으로 포지션을 청산합니다 미결제 주문 거래를 지원합니다 평균화 거래 모드를 지원합니다 이 훌륭하고 매우 편리한 유틸리티를 선물로 받고 싶으시다면, SUPERHERO 지표를 구매하
필터:
리뷰 없음
리뷰 답변