OracleTrading Candlestick Reversal Signals
- 지표
-
Ilia Makar
 Я Илья Макар — создатель нейробота Oracle Trading, финансовый эксперт, квалифицированный инвестор с 2013 года и практикующий инвестор с 2014 года.
13+ лет на финансовых рынках. $10+ млн в управлении. Обучил более 2140 трейдеров. - 버전: 4.0
- 업데이트됨: 11 7월 2026
OracleTrading Candlestick Reversal Signals — Smart Search for Reversal Patterns with Multi-Level Confirmation
The indicator detects 18 classic candlestick reversal patterns on the chart. Instead of simply drawing an arrow, it assigns each signal a strength rating from 1 to 10, based on trend alignment and confirmation from 10 popular indicators.
This is not another basic “arrow” indicator. It is a confluence analysis tool that filters out random formations and retains only those signals confirmed from multiple independent angles.
🕯 18 Candlestick Patterns
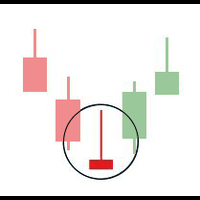
Single-candle and double-candle patterns: Hammer, Inverted Hammer, Hanging Man, Shooting Star, Bullish/Bearish Engulfing, Bullish/Bearish Harami, Piercing Line, Dark Cloud Cover, Tweezer Top/Bottom.
Strong three-candle and special patterns: Morning Star, Evening Star, Dragonfly Doji, Gravestone Doji, Three White Soldiers, Three Black Crows.
Each pattern can be enabled or disabled individually. The shapes of “hammer” and “shooting star” are automatically classified according to the preceding trend context (Hammer vs. Hanging Man, Shooting Star vs. Inverted Hammer). These are not separate algorithms — they represent contextual interpretation of the same candle geometry.
📊 Confluence System Based on 10 Indicators
Every detected pattern is additionally validated against the following:
- RSI — overbought/oversold zones + simplified price/RSI divergence
- Stochastic — reversal from the 20/80 zones
- Bollinger Bands — price touching the channel boundary
- EMA 50 / EMA 200 — alignment with the prevailing trend direction
- MACD — histogram reversal
- ADX — strength of the current trend
- Volume — volume spike relative to the average
- ATR — minimum volatility filter + automatic stop-loss suggestion
- Ichimoku Cloud — price position relative to the cloud
- CCI — extreme zones (±100)
Each confirmed condition adds +1 to the final signal strength score. The list of triggered confirmations can be displayed directly in the chart labels.
🎯 Signal Strength Rating (1–10)
Formula: base pattern strength + trend alignment bonus (+2) + strong ADX confirmation (+1) + confluence bonuses.
Signals with a rating below 3/10 are never displayed — this is a built-in protective filter that cannot be disabled through settings. You can additionally adjust the minimum threshold manually to match your personal trading style.
🔍 Smart Chart Display
- Pattern name and strength rating appear directly on the chart as text labels
- Choose between vertical or horizontal label orientation
- Non-max suppression (priority by strength): when several signals appear close to each other, only the strongest receives a label. Weaker neighboring signals do not create visual clutter
- Flexible settings for history depth and minimum distance between labels — the chart remains clean and readable even on dense timeframes
⏱ Multi-Timeframe Mode
The indicator can display reversal patterns from a higher timeframe directly on the current chart (for example, H4 patterns on an H1 chart). These signals appear in a distinct color with an enlarged arrow and include the source timeframe in the label.
🛡 Trend Filters
- Strict moving average filter (MA/EMA with adjustable period) — trade only in the direction of the trend
- Strict ADX filter — signals are generated only when the market is in a trending state
🔔 Alerts and Expert Advisor Integration
- Alert, push notifications, and email for every new signal
- Signal strength buffers (Buy Strength / Sell Strength) are available via iCustom()
- The indicator can serve as a ready-made signal source for building automated trading systems (Expert Advisors)
Who This Indicator Is For
- Traders who manually trade candlestick patterns and want to filter out weak or low-probability formations
- Traders who prefer a confluence-based approach (multiple confirming signals) rather than relying on a single indicator
- EA developers looking for a high-quality, pre-rated signal source with accessible buffers
⚠️ Important Notice
This indicator is a technical analysis and confluence filtering tool, not a “holy grail” trading system. It does not guarantee profits. Always apply proper risk management, use stop-losses, and combine the signals with your own market analysis.
It is strongly recommended to backtest the indicator thoroughly in the strategy tester before using it on a live account.