Auto Chart Patterns MT4
- 지표
- 버전: 1.0
- 활성화: 20

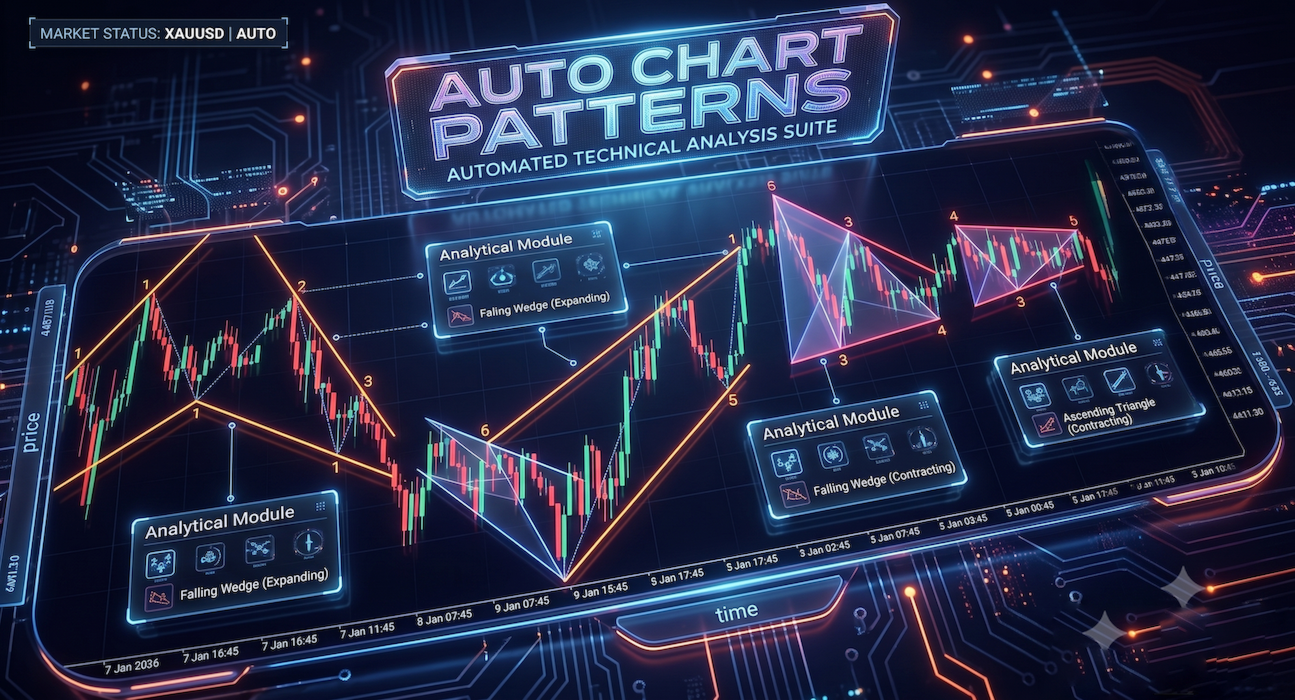
Auto Chart Patterns
This indicator is comprehensively designed to elevate technical chart analysis, making it systematic and highly accurate. It offers the following outstanding advantages:
-
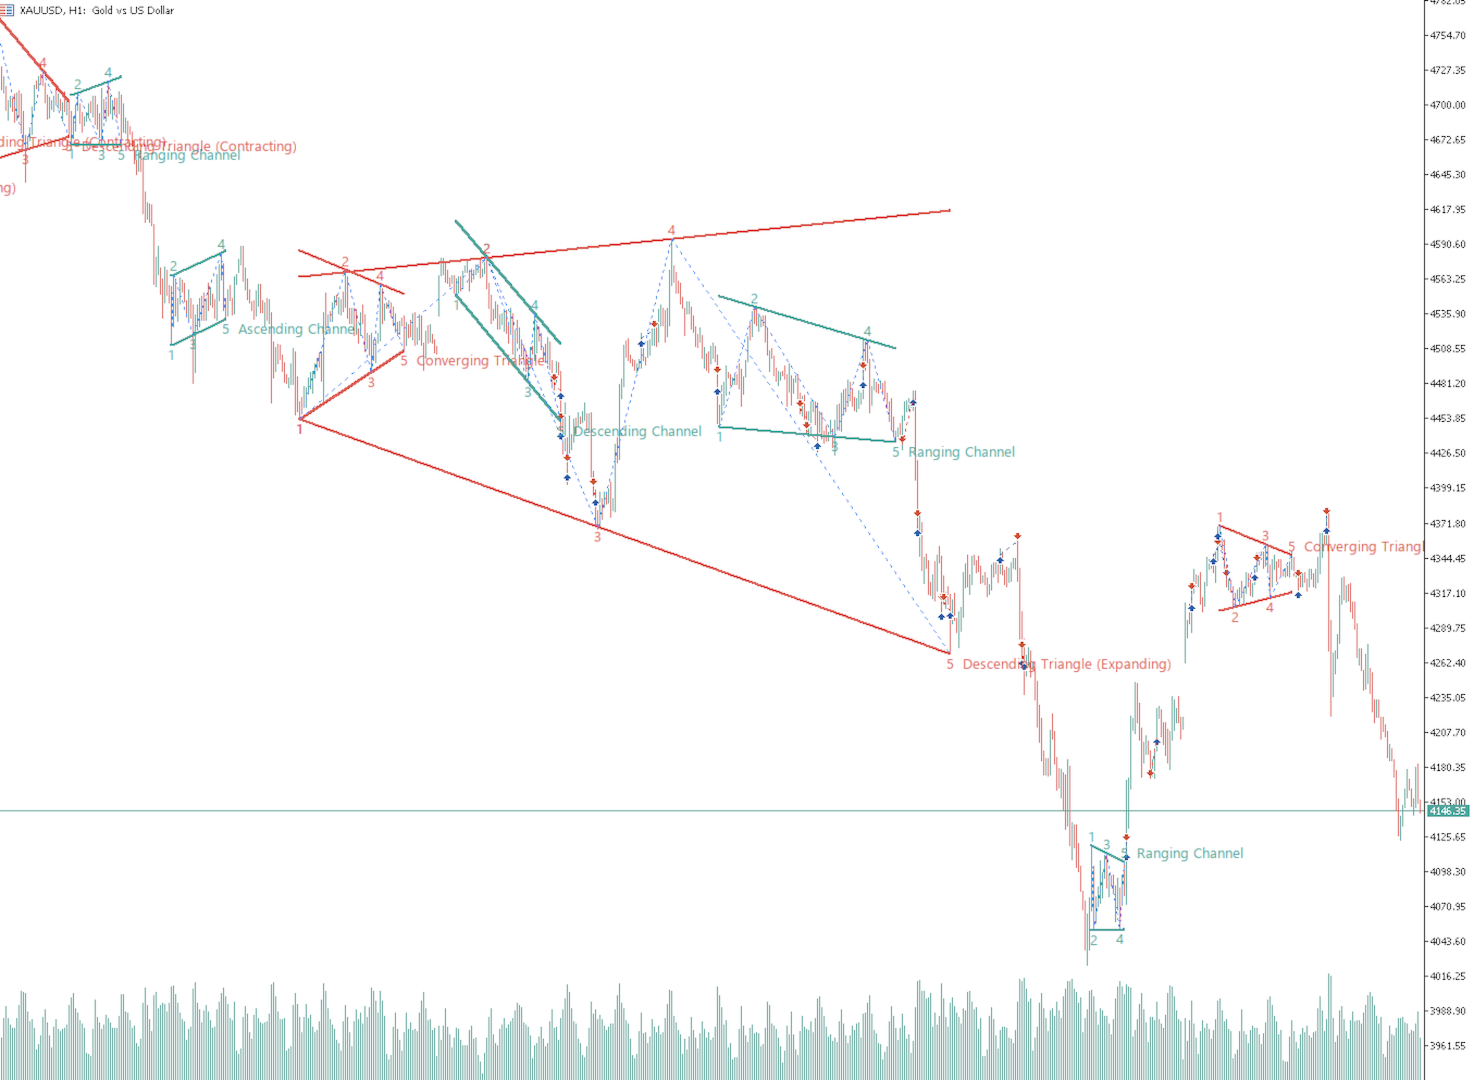
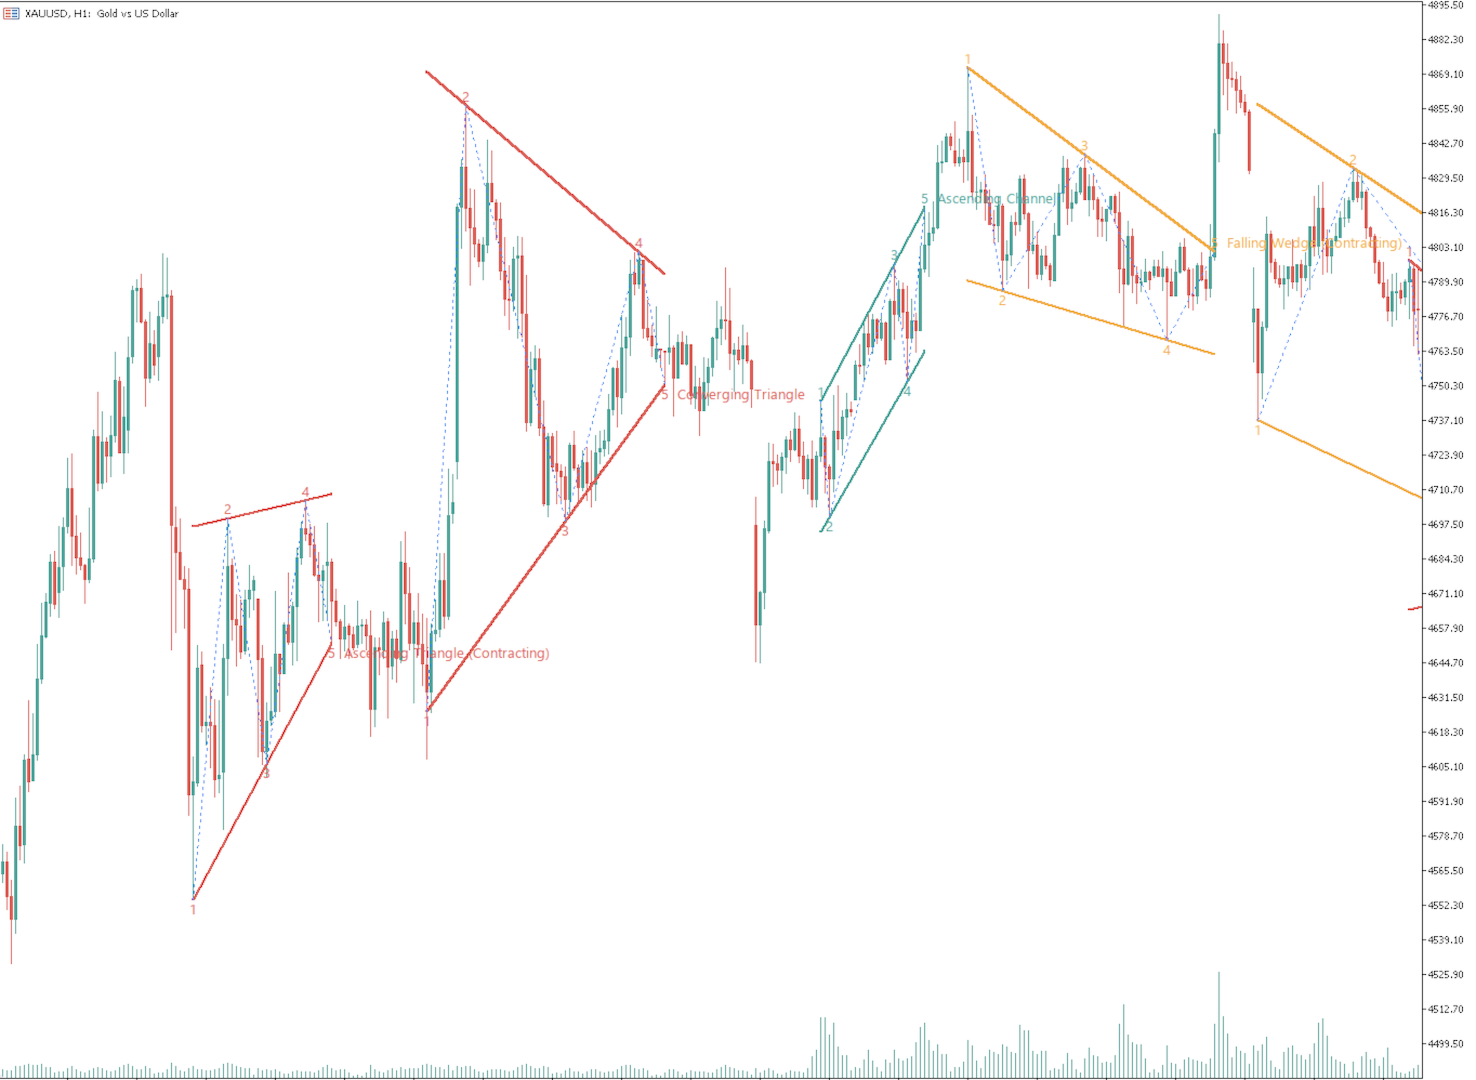
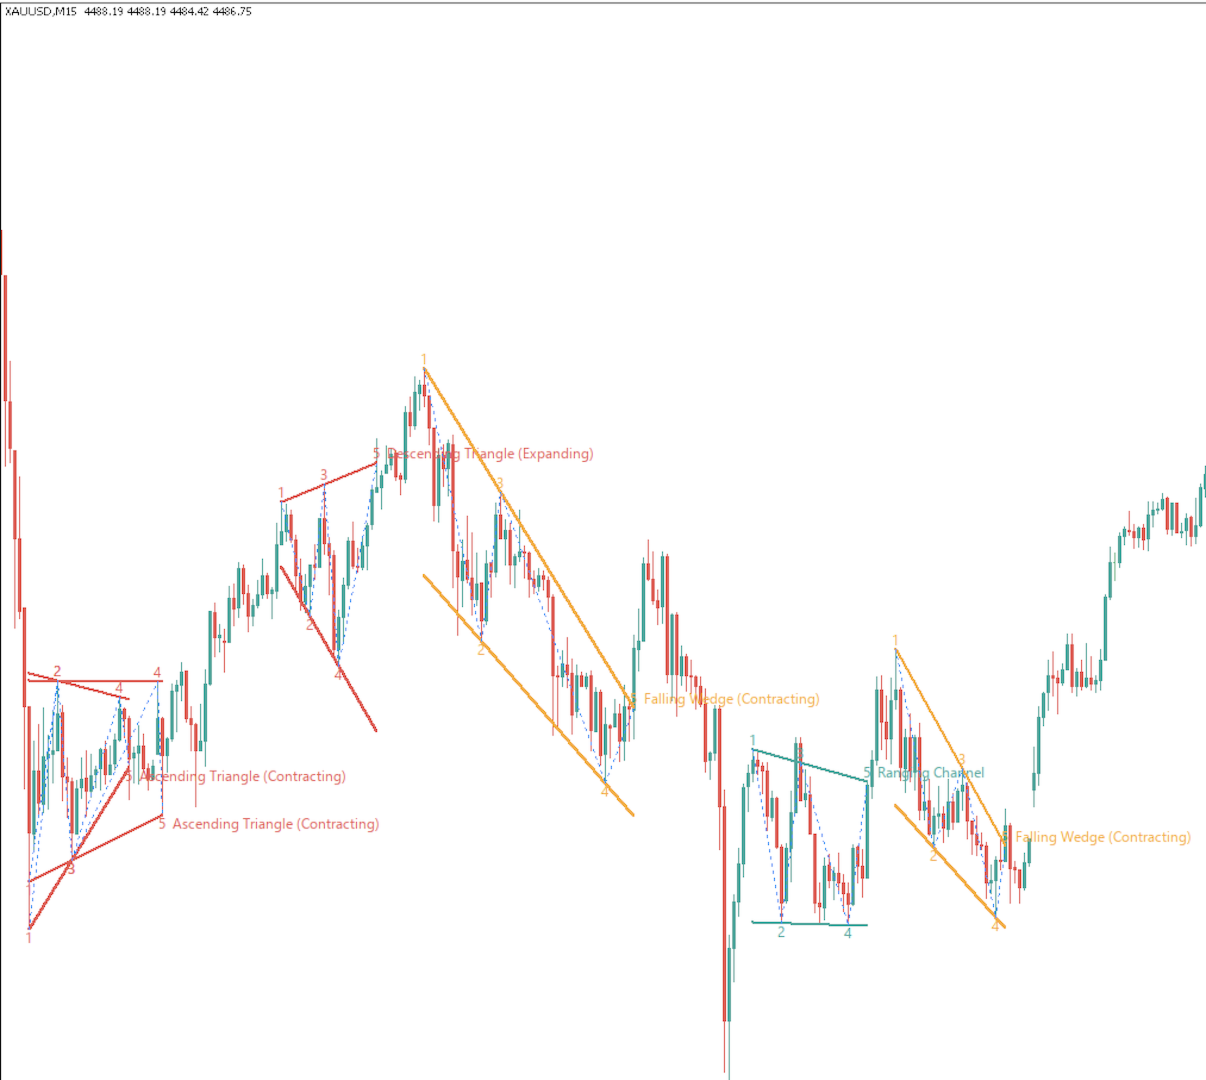
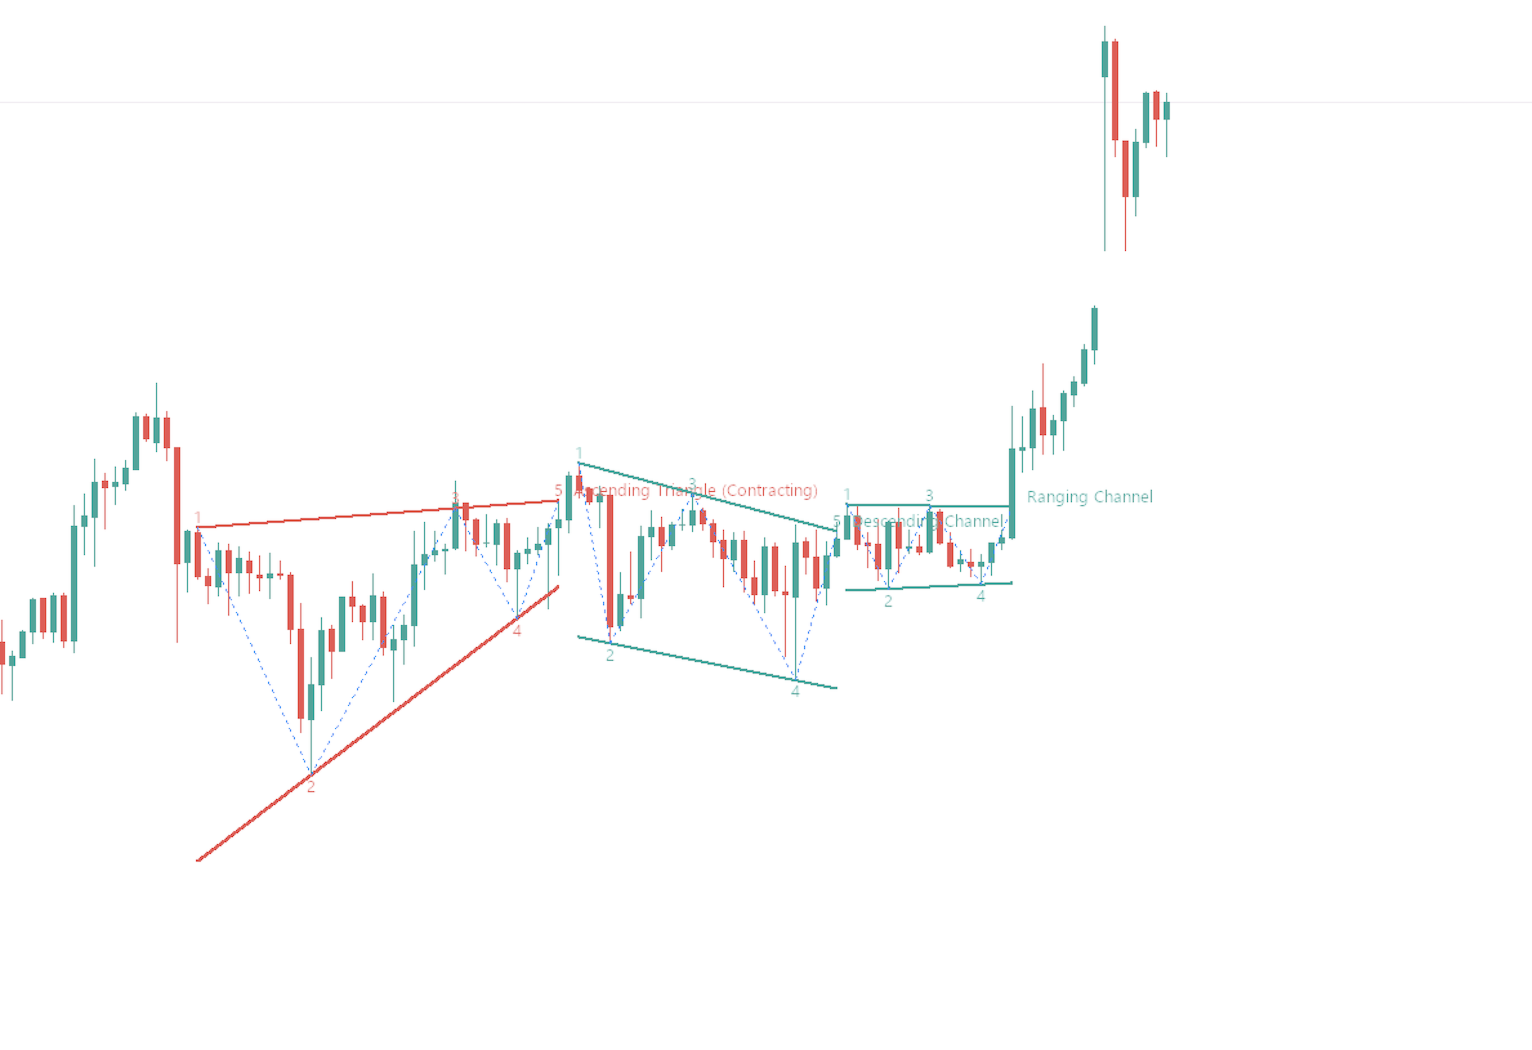
Automated Pattern Recognition: It can comprehensively detect key classic chart patterns, including Channels, Wedges, and Triangles. This saves time spent on manual drawing and is highly beneficial for finding trend-following breakout entries, especially in highly volatile and fast-moving markets or assets.
-
Multi-Term Scanning: The system can scan for price structures across up to 4 overlapping levels (ranging from short-term, medium-term, and long-term to ultra-long-term). This allows users to simultaneously observe the broader market macro-structure alongside developing short-term price behaviors.
-
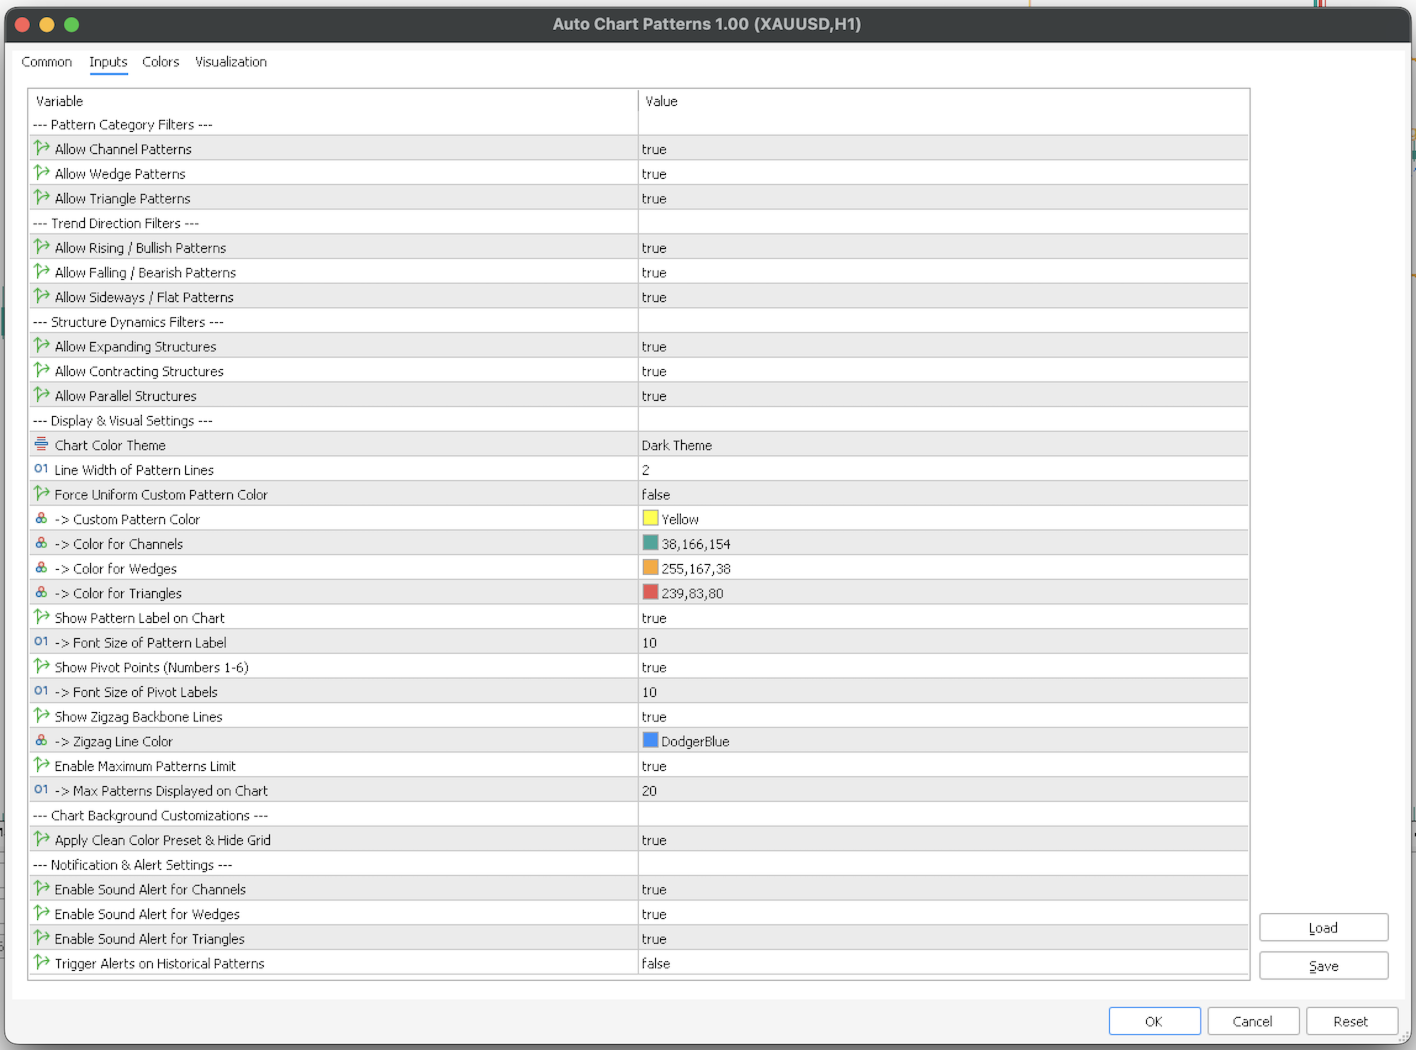
High Precision Filtering:
-
Incorporates Time/Bar Proportions filtering and Deviation Tolerance settings to ensure that the detected patterns are structurally sound and statistically reliable.
-
Features an Overlap Prevention algorithm to filter and display only the most significant chart patterns.
-
-
Market Phase Adaptability: Supports pattern detection across all price dimensions, whether in uptrends, downtrends, or sideways consolidations. It also analyzes price movement characteristics, including Expanding, Contracting, and Parallel structures.
-
Professional Visuals & UI:
-
Comes with perfectly matched color themes (Dark Theme / Light Theme). Users can also enable an automatic mode that adjusts background and candlestick colors for a clean, eye-friendly look.
-
Includes on-chart space management, allowing users to limit the maximum number of displayed patterns and automatically delete older ones as new ones emerge, keeping the chart from becoming cluttered.
-
-
Comprehensive Alert System: Never miss a crucial opportunity with customizable audio alerts categorized by pattern type (alerts specifically for Channels, Wedges, or Triangles). This helps you monitor potential entry points in a timely manner.
Overall, this indicator acts as a professional technical analysis assistant that minimizes human visual bias and presents straightforward price structure data. It is highly suitable for integration with advanced trading strategies.