RSI Reversal Signal Arrows

VP RSI Reversal Signal Arrows — Product Description

Short Description
VP RSI Reversal Signal Arrows is a clean MetaTrader 5 indicator that displays buy and sell reversal arrows when RSI exits oversold or overbought zones, with an optional moving average trend filter.

Main Description
VP RSI Reversal Signal Arrows is a visual technical analysis indicator for MetaTrader 5. It is designed for manual traders who want a simple RSI-based reversal assistant directly on the price chart. The indicator monitors RSI movement around configurable oversold and overbought levels and displays arrows when RSI leaves those extreme zones.

A buy reversal arrow can appear when RSI crosses upward out of the oversold zone. A sell reversal arrow can appear when RSI crosses downward out of the overbought zone. The indicator also includes an optional moving average trend filter. When the filter is enabled, buy arrows are allowed only when price is above or near the moving average, and sell arrows are allowed only when price is below or near the moving average.

This indicator does not trade automatically. It does not open orders, close orders, manage positions, use grid systems, martingale systems, DLL calls, file operations, or WebRequest. It is a chart-based analysis tool for manual decision-making.

Core Features
- RSI reversal arrows on the main chart.
- Optional moving average trend filter.
- Optional moving average display.
- Configurable RSI period.
- Configurable overbought and oversold levels.
- Configurable MA period, MA method, and applied price.
- Optional popup alerts.
- Closed-bar signal mode for more stable chart reading.
- Current-bar display option for aggressive monitoring.
- Lightweight and simple.
- Built for MetaTrader 5.

How It Works
The indicator calculates RSI using the selected RSI period and applied price. It then checks whether RSI crosses upward out of the oversold zone or crosses downward out of the overbought zone.

Buy Reversal Logic:
RSI was at or below the oversold level on the previous bar, and RSI moves above the oversold level on the current signal bar. If the trend filter is enabled, price should also be above or near the moving average.

Sell Reversal Logic:
RSI was at or above the overbought level on the previous bar, and RSI moves below the overbought level on the current signal bar. If the trend filter is enabled, price should also be below or near the moving average.

Input Parameters
RSI Period
Default: 14
Controls the RSI calculation period.

RSI Applied Price
Default: Close
Selects the price type used for RSI.

Overbought Level
Default: 70
The upper RSI level used for sell reversal detection.

Oversold Level
Default: 30
The lower RSI level used for buy reversal detection.

Use MA Trend Filter
Default: true
Enables or disables the moving average filter.

MA Period
Default: 100
Controls the moving average period.

MA Method
Default: EMA
Selects the moving average calculation method.

MA Applied Price
Default: Close
Selects the price type used for the moving average.

Arrow Offset, Points
Default: 25
Controls the visual distance between arrows and candles.

Show MA Line
Default: true
Shows or hides the moving average line.

Show Current Bar Signal
Default: false
If false, the indicator focuses on closed-bar signals. If true, it can show current forming bar conditions.

Enable Popup Alerts
Default: false
Enables popup alerts.

Alert On Current Bar
Default: false
Controls whether alerts are based on the current forming bar or the closed bar.

Suggested Use
1. Attach the indicator to any MetaTrader 5 chart.
2. Start with the default settings.
3. Use the moving average as a simple trend filter.
4. Watch for buy arrows after RSI exits oversold territory.
5. Watch for sell arrows after RSI exits overbought territory.
6. Confirm signals with your own market structure, support/resistance, timeframe bias, and risk management.
7. Test on a demo account before using in live trading.

Important Notes
VP RSI Reversal Signal Arrows is not a complete trading system. It is not financial advice and it does not guarantee profit. RSI reversal signals can fail during strong trends, news events, low-liquidity conditions, and sideways markets. Always use additional confirmation and proper risk management.

Recommended Settings
RSI Period: 14
Overbought Level: 70
Oversold Level: 30
MA Filter: true
MA Period: 100
MA Method: EMA
Closed-Bar Signals: true

Risk Disclaimer
Trading financial markets involves risk. This indicator is a technical analysis tool and cannot predict future price movement with certainty. Use it only after testing and only as part of a complete trading plan.

Suggested Tags
RSI, Reversal, Arrows, Signal, MT5, MetaTrader 5, Indicator, Overbought, Oversold, Moving Average, Manual Trading

추천 제품
Veltrion Smart Fibonacci   is a clean automatic Fibonacci structure overlay for MetaTrader 5. It automatically detects recent swing highs and swing lows, then draws key Fibonacci retracement levels directly on the chart. The indicator is designed to help traders visualize market structure, retracement zones, and the golden zone without manually drawing Fibonacci tools. Key Features Automatic swing high and swing low detection Clean Fibonacci retracement overlay Horizontal Fibonacci levels for a
Bid Price Timer Indicator — 정밀한 타이밍과 스마트한 가격 추적! Bid Price Timer Indicator 는 시간, 정확도, 명확성 을 중요시하는 트레이더를 위해 설계된 강력한 도구입니다. 주요 기능: 고정 타이머 표시 – 타이머는 항상 차트의 오른쪽 에 표시되며, X_Offset 으로 위치를 조정할 수 있습니다. 실시간 가격 추적 – 타이머는 매수 호가 (Bid 가격) 에 따라 위아래로 부드럽게 이동 합니다. 자동 위치 조정 – 가격이 변경되면 타이머가 자동으로 새로운 가격 수준에 맞게 이동 합니다. 선택 가능한 수평선 표시 – 정확한 Bid 가격 수준 을 시각적으로 보여줍니다. ️ 1초 단위 실시간 업데이트 – 타이머는 매초 갱신되며 , 다음 캔들까지의 카운트다운 을 실시간으로 보여줍니다. 트레이더들이 좋아하는 이유: 정확한 캔들 마감 타이밍 을 예측할 수 있습니다 차트를 깔끔하고 현대적이며 직관적 으로
Murphy Order Block is a highly optimized and visually clean indicator for identifying key institutional zones based on pure market structure logic. It is designed for traders who follow Smart Money Concepts (SMC), ICT-style OB trading, and structure-based break & retest strategies. This indicator dynamically detects and draws: - **1 valid Bullish Order Block (Buy Zone)** - **1 valid Bearish Order Block (Sell Zone)** ### Key Features: **Market Structure-Based Logic**   - Uses swing high
Title:   Bollinger Bands & RSI Strategy Indicator Description:   This indicator combines Bollinger Bands and the RSI to analyze price action. It plots the middle, upper, and lower Bollinger bands directly on your chart. Additionally, it provides visual signals (arrows and triangles) for RSI overbought/oversold conditions and price breakouts beyond the bands. It is an ideal tool for trend following and reversal strategies.
Market session with fibonacci
Batsukh Sumchin Khuyagbaatar
이 지표는 우리가 매일 사용하는 가장 일반적인 지표로, 가장 많이 사용하는 전략인 ICT와 SMC, 거래소 개장 및 폐장 시간에 발생하는 손절매 한도와 유동성 한도, 피보나치와 확대 및 축소를 통한 거래소 거래량, 보고 싶은 거래소 움직임을 선택하고 피보나치를 당기는 등 가장 일반적으로 보고 싶은 행동을 완전 자동으로 보여주는 지표입니다. 이 지표를 사용하여 모든 유형의 거래를 분석하는 법을 배우면 다시는 이 지표 없이 일할 수 없을 거라고 100% 확신합니다. 이 지표는 우리가 매일 사용하는 가장 일반적인 지표로, 가장 많이 사용하는 전략인 ICT와 SMC, 거래소 개장 및 폐장 시간에 발생하는 손절매 한도와 유동성 한도, 피보나치와 확대 및 축소를 통한 거래소 거래량, 보고 싶은 거래소 움직임을 선택하고 피보나치를 당기는 등 가장 일반적으로 보고 싶은 행동을 완전 자동으로 보여주는 지표입니다. 이 지표를 사용하여 모든 유형의 거래를 분석하는 법을 배우면 다시는 이 지표 없이 일할
CDV Candle Engine Pro
The Hung Ngo
5 (1)
CDV Candle Engine Pro is a MetaTrader 5 indicator designed to visualize Cumulative Delta Volume (CDV) directly on the price chart. It helps traders read market pressure more clearly by showing the balance between buying and selling activity in a clean, customizable layout. If you trade on MetaTrader 4, the MT4 edition is available here:  CDV Candle Engine Pro MT4 Public channel:   CLICK HERE Main Features CDV candle visualization on the main chart for easy reading in real time. Optional subwind
A useful scanner/dashboard that shows the RSI values for multiple symbols and Time-frames. It can be easily hidden/displayed with a simple click on the scanner man top left of the dashboard. You can input upper and lower RSI values and the colours can be set to show when above/below these values. The default values are 70 and 30. There are also input colours for when the RSI is above or below 50 (but not exceeding the upper/lower levels Symbols and time-frames are input separated by commas. S
If you are unsure how to use this indicator, please feel free to reach out to me. I will explain it to you and provide reading materials to help you make the most of it. TD Sequential Scanner: An Overview The TD Sequential scanner is a powerful technical analysis tool designed to identify potential price exhaustion points and trend reversals in financial markets. Developed by Tom DeMark, this method is widely used by traders to gauge market cycles and potential turning points with precision. Ho
Opulence Levels
Tokunbo Greatpath Adebowale
Opulence Levels is a precision-engineered, non-repainting indicator that automatically identifies the most critical price levels on any chart — the exact zones where smart money reacts, liquidity is hunted, and the next big move is born. Powered by swing-based structure analysis and multi-timeframe intelligence, Opulence Levels cuts through chart noise to deliver clean, high-probability BUY LEVELS and SELL LEVELS with surgical accuracy. No guesswork. No repainting. Just levels that matter. What
Fair Value Gap (FVG) & Inversion Fair Value Gap (iFVG) – TradingLabs ID In the ICT (Inner Circle Trader) and Smart Money Concepts (SMC) methodology, a Fair Value Gap (FVG)—also known as an Imbalance—occurs when the price moves with extreme momentum, leaving behind a void of liquidity. These unfilled gaps act as magnets for future price action, making them the most high-probability retracement and entry zones for professional traders. Discounted   Price   $50  !!     Secure your lifetime access  
DYNAMIC SR TREND CHANNEL Dynamic SR Trend Channel is a simple indicator for trend detection as well as resistance/support levels on the current timeframe. It shows you areas where to expect possible change in trend direction and trend continuation. It works with any trading system (both price action and other trading system that use indicators) and is also very good for renko charting system as well. In an uptrend, the red line (main line) serves as the support and the blue line serves as the r
ICT Time Cycle MT5
Robby Suhendrawan
ICT Market Time Cycle MT5 – Complete Session & Time Window Discounted   Price   $50  !!     Secure your lifetime access   now   before it switches to   subscription-only ! ICT Market Time Cycle is a professional trading indicator designed to help traders follow the ICT (Inner Circle Trader) methodology with ease. It automatically displays the main market sessions (Asia, London, and New York), along with Killzones, Silver Bullet windows, and Macro times directly on your chart. With this tool, you
Bos Choch Signal Scanner
Emma-ekong Ben Eshiet
N/B: All our product purchase comes with our free ‘’DAILY   SCALPER EA’’ -   bit.ly/4qlFLNh Whatsapp Developer for yours after successful purchase BOS / CHoCH Signals Scanner Indicator (MT5) See What Smart Money Is Doing — Before the Move Happens Most traders lose because they enter too late, trade against structure, or miss institutional confirmations. The BOS / CHoCH Signals Scanner Indicator was built to solve exactly that. This professional MT5 indicator automatically reads market struc
Heiken Ashi Supertrend Combine
Tri Yasin Satrio Adji Pranoto
Headline: Stop Guessing, Start Winning. Unleash the Power of the Heiken Ashi Supertrend Indicator. Body: Are you tired of market noise, confusing charts, and missed opportunities? The Heiken Ashi Supertrend Indicator is the ultimate tool designed to bring clarity and confidence to your trading, once and for all. We've combined two of the most powerful concepts in technical analysis into one seamless, easy-to-use indicator: Crystal-Clear Trends with Heiken Ashi: Say goodbye to choppy price action
Owl Smart Levels MT5
Sergey Ermolov
4.03 (32)
추세를 따라 거래할 때 가장 어려운 점은 레벨을 찾는 것이 아니라, 어디에서 진입이 실제로 유효한지를 이해하는 것입니다. 가격은 종종 레벨에 반응하지만 움직임이 이어지지 않는 경우가 많으며, 이는 잘못된 진입이나 기회 상실로 이어집니다. Owl Smart Levels는 단순히 레벨만 표시하는 것이 아니라 , 시장 구조와 되돌림을 기반으로 형성된 구간을 보여줍니다. 이를 통해 진입 포인트를 다르게 평가할 수 있으며 일부 잘못된 신호를 피할 수 있습니다. Owl Smart Levels 시스템 구성 Owl Smart Levels 는 단순한 레벨 표시가 아니라, 각 요소가 서로 보완하는 완전한 트레이딩 모델 입니다. 구성 요소: Owl Smart Levels (지표) 추세 방향, 되돌림 구간, 그리고 사전에 정의된 진입, StopLoss, TakeProfit 레벨을 표시 시스템 가이드 실제 거래에서 신호를 어떻게 활용할지 설명: 어떤 상황을 고려하고 어떤 상황을 건너뛸지, 그리고 거래
N/B: All our product purchase comes with our free ‘’DAILY   SCALPER EA’’ -   bit.ly/4qlFLNh Whatsapp Developer for yours after successful purchase UNLEASH THE SPARTAN-ARROW SPIKE DETECTOR The Ultimate Boom & Crash Trading Weapon That Never Sleeps --- ️ THIS IS NOT JUST AN INDICATOR - IT'S YOUR PERSONAL 300 SPARTAN ARMY SPECIAL BONUS (VALID TILL JUNE 2026)- OUR DAILY SCALPER EA for BTCUSD and VIX75 •·································································•
TrendPulse Signal Pro는 추세 반전을 감지하고, 차트에 LONG 및 SHORT 진입을 직접 표시하며, 모든 신호에 대해 손절·진입·3개 익절 레벨을 자동으로 그리는 완전한 시그널 엔진입니다. 내장 성과 대시보드는 시뮬레이션된 승률, 현재 거래 거리, 3레이어 리스크 관리 시뮬레이션 결과를 보여줍니다. 레이어 1은 TP1에서 청산되어 이익을 확보하고, 레이어 2는 TP2 또는 TP1 잠금에서 청산되며, 레이어 3은 TP3부터 트레일링 스톱을 실행합니다. 모든 신호는 확인된 추세 변화를 기반으로 하므로 어떤 시장에서도 명확하고 리페인트 없는 워크플로를 제공합니다. 주요 기능: 확인된 추세 반전에서 LONG·SHORT 라벨 자동 SL, 진입, TP1, TP2, TP3 라인 3레이어 시뮬레이션: TP1 잠금, TP2 청산, 트레일링 TP3 승률과 레이어 상태를 표시하는 성과 대시보드 ATR 기반 리스크 거리와 트레일링 승수 진폭, 채널 편차, 색상 설정 가능 설정: 진폭,
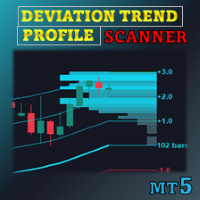
특별 할인 : ALL TOOLS , 개당 $35 ! 새로운 도구   는   $30   (   첫 주   또는   첫 3회 구매 한정)입니다!  MQL5 Trading Tools 채널 : 최신 소식을 받으려면 채널에 참여하세요 Deviation Trend Profile Scanner (DTPS) 는 트렌드 방향을 감지하고 변동성을 측정하며, 여러 종목/시간대의 정보를 하나의 표로 정리하는 지표입니다. 설정 가능한 이동 평균, 적응형 표준편차 영역, 분포 히스토그램을 사용하여 가격 행동을 통계적으로 간결하게 보여줍니다. MT4 버전 보기:  Deviation Trend Profile MT4 Scanner 다른 제품 보기:   All P roducts 1. 개요 이 지표는 세 가지 구성요소를 결합합니다: 이동 평균 (MA) 표준편차 영역 (±1, ±2, ±3 × ATR) 트렌드 분포 프로필 (히스토그램) 2. 핵심 개념 MA 기울기 (|Slope| > 0.1):  트렌드 변화를 감지 —
DoubleBB MARSI — 당일 매매에 최적화된 통합 차트 도구 가격의 현재 위치 · 시장 분위기 · 진입 시그널을 한 화면에서 한 줄 요약 당일 매매(데이트레이딩)에 필요한 핵심 정보 — 일별 가격 기준선 · RSI 분위기 · 더블 볼린저 밴드 시그널 — 을 한 화면에 통합해, 트레이더가 빠르고 정확한 의사결정을 할 수 있게 도와줍니다. 트레이더가 얻는 3가지 이점 DoubleBB MARSI 는 단순한 보조지표가 아니라, 하루 매매 사이클 전체에 필요한 정보를 한 화면에 제공합니다. 1. "지금 가격이 어디에 있는가?" — 일별 핵심 레벨 자동 표시 차트에 다음 세 라인이 자동으로 그려집니다. · DO (Day Open · 오늘 시가) · PDH (Previous Day High · 전일 고가) · PDL (Previous Day Low · 전일 저가) 현재가가 매수/매도 우위 구간 어디에 있는지 즉시 판단할 수 있습니다. "오늘 시가 위에서 거래
Deviation trend
VLADISLAV AKINDINOV
Indicator of trend deviation with a static level. The deviation coefficient is set for the trend histogram. Signals are the intersection of the level trend histogram in the direction of the trend or during a trend reversal - the option is selected in the indicator settings by the "Revers" parameter. There are all the necessary settings for the design of the indication and sending messages to mail or a mobile terminal. All input parameters have an intuitive name. Analog for MT4: https://www.mql5.
这是一个基于前一个交易日的最高价、最低价和收盘价来计算的枢轴点指标,具体公式如下: 计算前一日的 Pivot Point (枢轴点): Pivot = (High + Low + Close) / 3 计算 Resistance 1 (R1) 、 Support 1 (S1) ​ 等: R1 = (2 * Pivot) - Low S1 = (2 * Pivot) - High R2 = Pivot + (High - Low) S2 = Pivot - (High - Low) 与市面上其他的枢轴点指标相比,该指标主要有以下4个特点: 1、可以修改交易日的开始时间; 2、可以设定支撑压力线的颜色; 3、可以设定是否显示各个支撑压力线对应的价格; 4、可以设定天数用以显示枢轴点的历史记录; 开发这个指标的最初目的是为了解决设定交易日开始时间的问题,接下来会进一步说明。基于计算公式,我们需要获得上一个交易日的最高价、最低价和收盘价,在夏令时,北京时间6点是开市时间,大多数交易平台服务器的0点对应的是北京时间的6点,但是香港的服务器6点才是对应的是北京时间的6点。如果你有多个平台,且存在
BCSpikes
Shamsul Arfeen
Modern Spike Indicator Features: 1. Support and Resistance Lines: Displays dynamic horizontal dashed lines on the chart representing current support and resistance levels calculated from recent price swings. 2. Spike Detection Arrows: Shows up arrows (green) for potential upward spikes and down arrows (red) for potential downward spikes, triggered when price breaks S/R levels with RSI confirmation. 3. Trend Analysis: Incorporates ADX (Average Directional Index) to determine market trend stre
MT5용 Crypto_Forex 지표 "추세 진입 히스토그램", 리페인트 없음. - 추세 진입 히스토그램 지표는 Entry_bar가 나타나면 추세 방향 진입 신호를 찾는 데 사용할 수 있습니다. - 이 지표는 가격과 거래량을 모두 고려하여 계산하는 고유한 특징을 가지고 있습니다. - 추세 진입 히스토그램은 두 가지 색상으로 제공됩니다. 빨간색은 약세 추세, 파란색은 강세 추세입니다. - 안정적인 추세(동일한 색상의 히스토그램 막대가 최소 10개 연속 표시)가 나타나면 Entry_bar가 표시될 때까지 기다리세요. - 진입 신호는 히스토그램에서 반대 색상의 열 하나와 초기 추세 색상의 다음 열입니다(그림 참조). - 숏 목표가를 사용하세요. 현재 추세에 따라 차트에서 가장 가까운 고가/저가를 사용하세요. - 지표에는 모바일 및 PC 알림 기능이 내장되어 있습니다. 사용 방법: - 매수 신호: 안정적인 강세 추세(파란색 히스토그램 막대) + 히스토그램의 빨간색 막대 1개 + 파란색
ADR 경보 대시보드는 가격이 일반적인 일일 평균 범위와 관련하여 현재 거래되고 있는 위치를 한 눈에 보여줍니다. 가격이 평균 범위를 초과하고 선택한 수준보다 높을 때 팝업, 이메일 또는 푸시를 통해 즉각적인 알림을 받을 수 있으므로 신속하게 철회 및 반전에 뛰어들 수 있습니다. 대시는 빈 차트에 배치되도록 설계되었으며 배경에 앉아서 레벨에 도달하면 경고하므로 앉아서 보거나 전혀 볼 필요가 없습니다! MT4 버전은 여기에서 사용 가능: https://www.mql5.com/en/market/product/62756 새로운 기능: 이제 평균 WEEKLY 및 MONTHLY 범위와 경고도 표시됩니다! 여기에서 차트의 수준을 나타내는 ADR 반전 표시기를 얻으십시오. https://www.mql5.com/en/market/product/64477 시간의 약 60%는 가격이 정상적인 일일 평균 범위(ADR) 내에서 거래되고 이 수준 이상으로 상승하면 일반적으로 급격한 가격 변동의 지
How it works –   Pool detection — equal highs/lows (within an ATR-scaled tolerance), unswept swing highs/lows, session and daily/weekly extremes, and trendline liquidity (3+ touch diagonal clusters where stops accumulate). –   Pool weighting — each pool scored by touch count, age, round-number proximity and origin timeframe, then drawn with thickness/opacity proportional to score. The chart literally shows where the fuel is. –   Sweep engine — a sweep registers when price wicks through a pool an
God Spike Boom
Pedro Luis Oiaz Villamar
MFOP Market Forecast
Oscar Josue Pin Bacuzoy
Develop this indicator for periods of 30 minutes or more, focus on getting market trends right and making sure they are met. MFOP v8.1 gets straight to the point: it scans the market and tells you exactly when there is enough strength to enter a trade. This indicator doesn't do magic, it uses mathematical algorithms to filter out market noise, not enter into false breakouts and show you clear BUY (blue arrow) and SELL (red arrow) opportunities. It is designed and optimized specifically to take
BTFX Pivot Points
Bradley Thomas Farrington
The BTFX Pivot Points is an indicator which calculates the Support and Resistance levels for each day. By using this indicator the pivot levels point out clear targets to aim for. The resistance levels are shown in purple above the silver pivot line. The support levels are shown in Orange and can be found below the silver pivot line. This indicators works very well when used with The BTFX Daybreak Indicator. For a more in depth explanation of these indicators please watch the Youtube video attac
VVWAP Bandas
Edipaulo Zanella
Daily VWAP, continues for a period of hours (eg, 10 hours of history), with color to indicate change of direction and bands to map good entry and exit points. The indicator was created to map the center of the market, and find good buying moments, trend analysis or market correction points are easily detected, allowing you to understand moments of exhaustion and buying and selling points Copyright (c) <year> <copyright holders> Permission is hereby granted, free of charge, to any person obtaini
Full Prop Firm Traders Utility Dashboard
Opengates Success International
한국어  PROP-FIRM TRADERS MONITOR DASHBOARD (프로프 트레이더 유틸리티 대시보드) 이 도구는 MetaTrader 5용으로 개발된 강력하고 종합적인 리스크 관리 및 성과 모니터링 대시보드입니다. 프로프 펌(Prop Firm) 트레이더와 개인 트레이더 모두를 위해 설계되었으며, 거래 활동을 실시간으로 완전히 파악하고 제어할 수 있도록 도와줍니다. 대시보드는 계정의 모든 열린 거래와 종료된 거래를 동적으로 분석하고, 핵심 지표를 깔끔하고 읽기 쉬운 인터페이스로 차트 위에 직접 표시합니다. 주요 기능: 통화 및 타임프레임 변경 기능 (외부 파라미터에서 비활성화 가능 – 선택 사항) 브로커 서버 시간 차트 표시 (선택 사항) 캔들 카운트다운 타이머 (선택 사항) 다양한 기능을 갖춘 전체 대시보드: 외부 파라미터 (사용자 입력): 계정 이름: 계정 소유자 이름 계정 유형: 프로프 펌 계정, 개인 계정 등 초기 계정 잔고: 사용자가 입력 일일 드로우다운
이 제품의 구매자들이 또한 구매함
이 제품은 2026년 시장에 맞게 업데이트되었으며 최신 MT5 빌드에 최적화되었습니다. 가격 업데이트 안내: Smart Trend Trading System은 현재 $99 에 제공됩니다. 다음 30회 구매 후 가격은 $199 로 인상됩니다. 특별 혜택: Smart Trend Trading System 구매 후 저에게 개인 메시지를 보내시면 Smart Universal EA를 무료 로 받을 수 있으며, Smart Trend 신호를 자동 거래로 전환할 수 있습니다. Smart Trend Trading System은 리페인트 없음, 재그리기 없음, 지연 없음의 완전한 트레이딩 시스템으로, 더 깨끗한 신호, 더 나은 추세 방향, 그리고 더 체계적인 시장 거래 방식을 원하는 트레이더를 위해 제작되었습니다.   [User Manual]   ,  [PDF]  ,   [Installation manual]   and  [Online course] 이 시스템은 추세 감지, 반전 구간, Smart
Trend Sniper X
Sarvarbek Abduvoxobov
5 (11)
Trend Sniper X 는 MetaTrader 5용 멀티 타임프레임 추세 추종 지표로, 트레이더가 추세 방향과 잠재적 반전 지점을 명확하고 정확하게 식별하도록 돕습니다. 가격 정보: 현재 가격은 프로모션 가격이며, 향후 업데이트 및 새로운 기능 출시 시 변경될 수 있습니다. Code2Profit 채널 멀티 타임프레임 분석으로 시장을 마스터하세요! Trend Sniper X로 승률을 극대화하는 방법: 핵심 규칙 및 세션 팁 기술 사양 플랫폼 MetaTrader 5 지표 유형 멀티 타임프레임 추세 지표 운용 타임프레임 모든 차트 타임프레임 지원, 독립적으로 선택 가능한 상위 타임프레임(M1–MN1) 주요 상품 외환, 금(XAUUSD) 및 기타 CFD 권장 계좌 모든 계좌 유형 시각화 색상별 추세 캔들(매수/매도/약세/변경) + 매수/매도 화살표 추가 모듈 세션 시장 박스(시드니, 도쿄, 런던, 뉴욕) 주요 기능 멀티 타임프레임 추세 분석: 상위 타임프레임의 추세 방향을 현재 차트에
Welcome to ENTRY IN THE ZONE AND SMC MULTI TIMEFRAME Entry In The Zone and SMC Multi Timeframe is a real-time market analysis tool based on Smart Money Concepts (SMC), designed to analyze market structure, price direction, and key trading zones. It supports both Single-Timeframe Analysis and Multi-Timeframe Analysis, providing a clearer view of the overall market structure across multiple timeframes, with real-time BUY / SELL signals that do not repaint. It is designed to help filter trading opp
Divergence Bomber
Ihor Otkydach
4.89 (94)
가끔은 제가 직접 이 시스템을 이용해 거래를 하곤 합니다. 실계좌에서 제가 직접 수행하는 BOMBER 트레이딩을 확인해 보세요 - LIVE SIGNAL 이 지표를 구매하신 분께는 다음과 같은 혜택이 무료로 제공됩니다: 각 거래를 자동으로 관리하고, 손절/익절 수준을 설정하며, 전략 규칙에 따라 거래를 종료하는 전용 도우미 툴 "Bomber Utility" 다양한 자산에 맞게 지표를 설정할 수 있는 셋업 파일(Set Files) "최소 위험", "균형 잡힌 위험", "관망 전략" 모드로 설정 가능한 Bomber Utility의 셋업 파일 이 전략을 빠르게 설치, 설정, 시작할 수 있도록 돕는 단계별 영상 매뉴얼 주의: 위의 모든 보너스를 받기 위해서는 MQL5 개인 메시지 시스템을 통해 판매자에게 연락해 주세요. 독창적인 커스텀 지표인 “Divergence Bomber(다이버전스 봄버)”를 소개합니다. 이 지표는 MACD 다이버전스(괴리) 전략을 기반으로 한 올인원(All-in-On
Neuro Poseidon MT5
Daria Rezueva
4.85 (54)
Neuro Poseidon is a new indicator by Daria Rezueva. It combines precise trading signals with adaptive TP/SL levels - creating best possible trades as a result! Message me and get  Neuro Poseidon Assistant  as a gift to automize your trading process! What makes it stand out? 1. Proven profitability on all assets and timeframes 2. Only confirmed BUY and SELL signals present on the chart 3. Adaptive TP & SL levels generated by the software for each trade 4. Easy to understand - suitable for al
Entry Points Pro for MT5
Yury Orlov
4.51 (148)
전설이 돌아왔습니다: Entry Points Pro 10. MQL5 마켓 Top-3 자리를 3년간 지켜온 전설적인 지표의 재출시입니다. 수백 개의 호평 리뷰(두 버전 합산 589개), 매일 이 지표로 거래하는 수천 명의 트레이더, 31,000회 이상의 데모 다운로드   MT4+MT5 . 지난 5년간 여러분이 남긴 리뷰를 하나도 빠짐없이 읽었고, 약속 대신 그 답을 버전 10에 담았습니다. 1999년부터 시장에서 활동하며 정직함과 자신의 평판, 그리고 고객을 소중히 여기는 개발자가 만들었습니다. Entry Points Pro의 진입 시그널은 절대 리페인팅되지 않습니다. 그리고 이번에는 개발자의 말뿐이 아니라 검증 가능한 사실입니다: 확정 시그널은 캔들 종가에서만 표시되며, 자동화 테스트에서 리페인팅 0건 이 확인되었습니다(EURUSD, XAUUSD, BTCUSD에서 2,486,568회의 불변조건 검사 — 위반 0건). 검증 방법은 공개되어 있으니 전략 테스터에서 직접 재현해 보실 수
SuperScalp Pro
Van Minh Nguyen
4.61 (31)
SuperScalp Pro – 전문 멀티 레이어 컨플루언스 스캘핑 시스템 SuperScalp Pro 는 다중 컨플루언스를 기반으로 한 전문 스캘핑 시스템으로, 트레이더가 더 높은 확률의 매매 기회를 식별할 수 있도록 설계되었습니다. 명확한 진입 신호 확인, ATR 기반 손절(Stop Loss) 및 목표가(Take Profit), 그리고 XAUUSD, BTCUSD 및 주요 외환 통화쌍에 대한 유연한 신호 필터링 기능을 제공합니다. 전체 문서는 제품 블로그에서 확인할 수 있습니다:   [User Guide] SuperScalp Pro Auto Trader EA를 통해 자동 매매를 지원합니다:   [Auto Trader] 제품 업데이트, 뉴스 및 공지사항을 확인하려면 SuperScalp Pro 공식 MQL5 채널을 팔로우하세요: [Official Channel] SuperScalp Pro 는 Supertrend, VWAP, EMA, RSI, ADX, 거래량 분석, 볼린저 밴드 및 M
GoldenX Entry MT5
Kareem Abbas
5 (15)
GoldenX Entry는 MT5용 인디케이터로, 적응형 Smart Entry Trend 알고리즘, 신호 스코어링 시스템, 시장 레짐 감지 기능, 그리고 변동성 필터를 포함합니다. 각 신호에는 계산된 진입 레벨, 3개의 익절(TP1, TP2, TP3) 레벨, 그리고 손절(Stop-Loss) 레벨이 포함됩니다. 이 인디케이터는 다양한 시장 환경에 적응하도록 설계된 다중 분석 레이어 구조 위에 구축되어 있으며, 내장 최적화기와 통계 추적 시스템을 결합합니다. 또한 Risk-to-Reward(RR) 지표와 과거 거래 행동 기반의 정량 분석을 제공합니다. 시작은 간단합니다 — 선택한 타임프레임에서 최적화기를 실행한 뒤 차트에서 바로 인디케이터를 사용하면 됩니다. 핵심 기능 GoldenX Entry는 하나의 차트에서 신호 엔진, 트레이드 관리 기능, 그리고 과거 통계 추적을 통합합니다: - 내장 최적화기: 최적화기는 차트에서 원클릭으로 실행됩니다. 200개의 파라미터 조합을 두 단계 탐색
M1 Sniper MT5
Oleg Rodin
5 (6)
M1 SNIPER 는 사용하기 쉬운 거래 지표 시스템입니다. M1 시간대에 맞춰 설계된 화살표 지표입니다. 이 지표는 M1 시간대 스캘핑을 위한 단독 시스템으로 사용할 수 있으며, 기존 거래 시스템의 일부로도 사용할 수 있습니다. 이 거래 시스템은 M1 시간대 거래용으로 특별히 설계되었지만, 다른 시간대에도 사용할 수 있습니다. 원래는 XAUUSD와 BTCUSD 거래를 위해 이 방법을 설계했지만, 다른 시장 거래에도 유용하다는 것을 알게 되었습니다. 이 지표의 신호는 추세 방향과 반대로 거래될 수 있습니다. 저는 지표의 신호를 활용하여 양방향으로 거래할 수 있도록 돕는 특별한 거래 기법을 알려드립니다. 이 방법은 특별한 동적 지지선과 저항선 가격 영역을 활용하는 것을 기반으로 합니다. 구매하시면 M1 SNIPER 화살표 지표를 바로 다운로드하실 수 있습니다. 또한, 아래 스크린샷에 표시된 Apollo Dynamic SR 지표는 M1 SNIPER 도구를 사용하는 모든 사용자에게 무료로
SMC Intraday Formula
Kareem Abbas
5 (22)
먼저 솔직하게 말하겠습니다. 어떤 인디케이터도 단독으로 당신을 수익성 있게 만들어주지 않습니다. 누군가 그렇게 말한다면, 그는 당신에게 꿈을 파는 것입니다. 완벽한 매수/매도 화살표를 보여주는 모든 인디케이터는 완벽하게 보이도록 만들 수 있습니다 — 단지 올바른 과거 구간을 확대하고 승리한 거래만 캡처하면 됩니다. 우리는 그렇게 하지 않습니다.  SMC Intraday Formula는 도구입니다. 시장 구조를 읽고, 가장 높은 확률의 가격 구간을 표시하며, 현재 스마트 머니의 흐름이 어떻게 보이는지 아주 단순한 언어로 보여줍니다. 최종 결정은 여전히 당신이 합니다. 실행도 당신이 합니다. 하지만 이제는 희망이 아니라 정확성으로 거래하게 됩니다. 우리는 이 인디케이터를 지난 약 3년 동안 골드(XAUUSD) 및 주요 외환 통화쌍의 데이 트레이딩 스캘핑에 사용해 왔습니다. M1, M5, M15, M30에서 우리의 핵심 도구입니다. 이 도구는 미래를 예측하려 하지 않습니다 — 지금 형성
Zoryk Gold
Reda El Koutbane
5 (6)
ZORYK — MetaTrader 5용 XAUUSD 전문 신호 및 트레이드 플래닝 시스템 이런 경험이 있을 것입니다. 골드를 분석하고 진입을 기다린 뒤 마침내 포지션을 열었지만 가격이 곧바로 반대 방향으로 움직입니다. 너무 일찍 청산하거나 Stop Loss를 옮기거나 몇 초 동안 망설입니다. 그 후 시장은 내가 없이도 처음 예상했던 목표까지 정확히 움직입니다. 문제는 항상 방향이 아니었습니다. 진짜 문제는 불확실성이었습니다. 정확한 진입 위치를 몰랐습니다. 어느 지점에서 원래의 트레이드 아이디어가 무효가 되는지 몰랐습니다. 가까운 수익을 확보해야 할지 더 큰 움직임을 기다려야 할지 판단하기 어려웠습니다. 현재 setup이 정말 강한지 아니면 단지 새로운 거래를 억지로 찾고 있는지도 확신하기 어려웠습니다. 골드는 매우 빠르게 움직입니다. 명확한 계획이 없다면 좋은 분석도 몇 초 만에 나쁜 결정으로 바뀔 수 있습니다. ZORYK는 이 문제를 해결하기 위해 개발되었습니다.
UZFX {SSS} 스캘핑 스마트 시그널 v4.0 MT5는 급변하는 시장에서 정확한 실시간 시그널을 필요로 하는 스캘퍼, 데이 트레이더, 스윙 트레이더를 위해 설계된 리페인팅이 없는 고성능 트레이딩 지표입니다. (UZFX-LABS)에서 개발한 이 지표는 가격 움직임 분석, 추세 확인 및 스마트 필터링을 결합하여 모든 통화 쌍과 시간대에서 높은 확률의 매수 및 매도 신호, 경고 신호, 추세 지속 기회를 생성합니다. 거래에 대한 의구심을 떨쳐버리고, 명확성, 정밀성, 그리고 규율 있는 시장 실행을 원하는 트레이더를 위해 설계된 체계적인 신호 시스템을 따르기 시작하세요. 제 추천* 최적의 시간대: 15분 이상. {H1}이 제가 가장 선호하는 시간대입니다. 그리고 그 결과는 정말 놀라울 정도입니다...!! 주요 기능 업데이트 • 자동 매수 및 매도 신호 감지 • 고급 반전 인식 로직 • 잠재적인 시장 반전 전 조기 경고 신호 • 추세 지속 확인 신호 • 진입, 손절, TP1, TP2,
Superhero
Ihor Otkydach
5 (2)
SUPERHERO 지표는 “올인원” 방식으로 설계된 다중 통화 거래 시스템입니다. 이 지표는 시장을 독자적으로 분석하여 포지션을 개설하고 청산할 시점에 대한 신호를 제공합니다. 손절매(Stop Loss) 및 익절(Take Profit) 주문을 활용하며, 위험 대비 수익 비율(R:R)은 1:1입니다. 가끔 저는 이 시스템의 신호를 바탕으로 직접 거래를 하는데, 그 결과는 다음과 같습니다— 실시간 신호 이 시스템은 스마트폰으로 푸시 알림을 전송할 수 있으므로, PC에 묶여 있을 필요 없이 “이동 중에도” 매매를 할 수 있습니다. 이는 자체 거래 전문 회사에 안성맞춤입니다. 모든 고객님께 드리는 특별 혜택: 이 지표를 구매하시는 모든 분께는 제가 특별히 준비한 유틸리티를 선물로 드릴 예정이며, 이 유틸리티는 다음과 같은 기능을 제공합니다: 손절매 및 익절 주문을 자동으로 설정합니다 가격이 목표 수준에 도달하면 자동으로 포지션을 청산합니다 미결제 주문 거래를 지원합니다 평균화 거래 모드를
Session High Low Lines Indicator that plots key intraday reference levels directly on the chart: the previous day's high/low and the current day's high/low, updated automatically as the new day forms. An optional previous week high/low can also be displayed. These levels are widely used as reference points for potential support and resistance zones, breakout confirmation, and range context during a trading session. Features Previous day High/Low lines Current day High/Low lines (updates in real
Atomic Analyst MT5
Issam Kassas
4.44 (54)
이 제품은 2026년 시장에 맞게 업데이트되었으며 최신 MT5 빌드에 최적화되었습니다. 가격 업데이트 안내: Atomic Analyst는 현재 $99 에 제공됩니다. 다음 30회 구매 후 가격은 $199 로 인상됩니다. 특별 혜택: Atomic Analyst 구매 후 저에게 개인 메시지를 보내시면 Smart Universal EA를 무료 로 받을 수 있으며, Atomic Analyst 신호를 자동 거래로 전환할 수 있습니다. Atomic Analyst는 리페인트 없음, 재그리기 없음, 지연 없음의 Price Action 거래 인디케이터로, 수동 거래, 신호 명확성, EA 자동화를 위해 설계되었습니다. User manual: settings, inputs and strategy.   &   User Manual PDF . 가격 움직임, 강도, 모멘텀, 다중 시간대 방향 및 고급 필터를 분석하여 트레이더가 노이즈를 줄이고 약한 세팅을 피하며 더 체계적인 거래 결정을 내릴 수 있도록
Gann Made Easy MT5
Oleg Rodin
5 (9)
Gann Made Easy 는 mr.의 이론을 사용하여 최고의 거래 원칙을 기반으로 하는 전문적이고 사용하기 쉬운 Forex 거래 시스템입니다. W.D. 간. 이 표시기는 Stop Loss 및 Take Profit Levels를 포함하여 정확한 BUY 및 SELL 신호를 제공합니다. PUSH 알림을 사용하여 이동 중에도 거래할 수 있습니다. 구매 후 거래 방법 안내 및 유용한 추가 지표를 무료로 받으시려면 저에게 연락주세요! 아마도 Gann 거래 방법에 대해 이미 여러 번 들었을 것입니다. 일반적으로 Gann의 이론은 초보자 거래자뿐만 아니라 이미 거래 경험이 있는 사람들에게도 매우 복잡한 것입니다. Gann의 거래 방식은 이론적으로 적용하기 쉽지 않기 때문입니다. 나는 그 지식을 연마하고 Forex 지표에 최고의 원칙을 적용하기 위해 몇 년을 보냈습니다. 표시기는 적용하기가 매우 쉽습니다. 차트에 첨부하고 간단한 거래 권장 사항을 따르기만 하면 됩니다. 지표는 지속적으로 시장 분석
Crystal Heikin Ashi Signals
Muhammad Jawad Shabir
5 (3)
Crystal Heikin Ashi Signals - Professional Trend & Signal Detection Indicator Advanced Heikin Ashi Visualization with Intelligent Signal System for Manual & Automated Trading Final Price: $149 ---------> Price goes up $10 after every 10 sales . Limited slots available — act fast . Overview Crystal Heikin Ashi Signals is a professional-grade MetaTrader 5 indicator that combines pure Heikin Ashi candle visualization with an advanced momentum-shift detection system. Designed for both manual traders
SkyHammer Signal Pro
Shengzu Zhong
5 (4)
SkyHammer Signal Pro Entry, SL, TP 레벨이 고정되는 전문 No-Repaint 추세 신호 인디케이터 SkyHammer Signal Pro는 명확하고 고정되며 검증 가능한 신호를 원하는 트레이더를 위해 설계된 구조적인 추세 및 모멘텀 신호 인디케이터입니다. 특히 M1 및 M5 같은 낮은 시간대에서 가장 효과적으로 작동합니다. 이 인디케이터는 시장의 고점이나 저점을 예측하려고 하지 않습니다. 대신 신호를 생성하기 전에 확인된 시장 구조, 추세 방향, 모멘텀 강도, 건강한 변동성, 그리고 목표까지의 충분한 공간을 기다립니다. 주요 기능 고정 신호 메커니즘 신호가 확인되면 화살표, Entry, Stop Loss, TP1, TP2 레벨이 차트에 영구적으로 고정됩니다. 이후 캔들 움직임 때문에 신호가 사라지거나, 이동하거나, 변경되지 않습니다. 이를 통해 트레이더는 각 신호를 명확하게 검토할 수 있으며, 실시간 시장에서 신호가 사라지는 일반적인 문제를 피할 수 있습니다
The Oracle Pro
Ottaviano De Cicco
5 (1)
The Oracle Pro: Synthetic Multi-Timeframe Bias Engine for MT5 ️ Summer Launch Offer — Get The Oracle Pro for USD 199 (early buyers). Price rises with traction; final price USD 399. The Oracle Pro is a premium multi-timeframe bias engine for MetaTrader 5, built for demanding and professional traders. It answers one question with discipline: what is the directional bias on each timeframe right now, how strong is it, and how much do the timeframes agree? Everything is computed on closed bars only
Trend Catcher ind mt5
Ramil Minniakhmetov
5 (18)
트렌드 캐처 인디케이터 트렌드 캐처 인디케이터는 개발자가 자체 개발한 맞춤형 적응형 트렌드 분석 지표들을 조합하여 시장 가격 움직임을 분석합니다. 단기적인 노이즈를 제거하고 근본적인 모멘텀 강도, 변동성 확대, 가격 구조 움직임에 집중하여 진정한 시장 방향을 파악합니다. 또한 이동 평균, RSI, 변동성 필터와 같은 맞춤형 지표들을 활용하여 가격을 평활화하고 트렌드를 필터링합니다. 실제 운영 모니터링 및 기타 제품은 다음 링크에서 확인하실 수 있습니다:   https://www.mql5.com/en/users/mechanic/seller 텔레그램에서는 EA나 설정 파일을 판매하지 않습니다. 사기이니 주의하세요. 모든 설정 파일은 블로그에서 무료로 제공됩니다. 중요! 구매 후 즉시 연락 주시면 사용 방법 및 보너스를 드립니다!
Power Candles MT5
Daniel Stein
5 (9)
Power Candles V3 - 자체 최적화 강도 지표 파워 캔들 V3는 적용된 모든 차트에서 통화 및 상품의 강세를 실행 가능한 거래 계획으로 전환합니다. 단순히 캔들에 색상을 입히는 대신, 백그라운드에서 실시간 자동 최적화를 수행하여 현재 보고 있는 종목에 대한 최적의 손절매, 익절 및 신호 임계값을 제공합니다. 한 번의 클릭으로 실시간 거래에 적용할 수 있으며, 진입점, 손절매 및 익절 선이 정확한 가격에 맞춰 차트에 표시되고, 방향과 함께 알림이 발령됩니다. 이 도구는 Stein Investments 에코시스템의 일부입니다. 18개 이상의 도구와 함께 당신의 1대1 AI 트레이딩 멘토 Max.  항상 대기 중, 모든 인디케이터를 깊이 있게 이해, 무언가를 차근차근 생각해보고 싶은 순간에 도움을 줍니다.  https://stein.investments 에서 만나보세요 매 종가 바마다 3,000회 이상의 트레이딩 시뮬레이션. 9가지 강도 상태. 2가지 전략을 병렬로 테스트.
Azimuth Pro
Ottaviano De Cicco
5 (7)
Azimuth Pro V2: Synthetic Fractal Structure and Confirmed Entries for MT5 Overview Azimuth Pro is a multi-level swing structure indicator by Merkava Labs . Four nested swing layers, swing-anchored VWAP, ABC pattern detection, three-timeframe structural filtering, and closed-bar confirmed entries — one chart, one workflow from micro-swings to macro-cycles. This is not a blind signal product. It is a structure-first workflow for traders who care about location, context, and timing. ️ Summer Sale
이 제품은 2026년 시장에 맞게 업데이트되었으며 최신 MT5 빌드에 최적화되었습니다. 가격 업데이트 안내: Smart Price Action Concepts는 현재 $200 에 제공됩니다. 다음 30회 구매 후 가격은 $299 로 인상됩니다. 특별 혜택: 구매 후 저에게 개인 메시지를 보내시면 무료 보너스 + 선물 을 받을 수 있습니다. 먼저, 이 트레이딩 도구는 리페인트 없음, 재그리기 없음, 지연 없음의 인디케이터이므로 전문적인 트레이딩에 적합하다는 점을 강조하고 싶습니다. [Online course] ,   [User Manual]  ,  [How to Install]  ,   [PDF] Smart Price Action Concepts Indicator는 초보자와 경험 많은 트레이더 모두에게 매우 강력한 도구입니다. 20개 이상의 유용한 인디케이터를 하나로 결합하고, Inner Circle Trader Analysis와 Smart Money Concepts Trading
SR Liquidity MT5
Oleg Rodin
5 (2)
SR Liquidity 는 시장 유동성이 집중되고 가격이 가장 강력하게 반응하는 숨겨진 구간을 포착하도록 설계된 트레이딩 지표입니다. 이러한 특수 유동성 구간은 강력한 지지 및 저항선 역할을 하며, 시장 반전 가능성이 가장 높은 지점을 명확하게 보여주는 지도가 되어 줍니다. SR Liquidity는 일반적인 지지 및 저항선을 단순히 그리는 대신, 실제 가격 움직임을 분석하여 매수 및 매도 압력이 집중되는 구간을 포착합니다. 이러한 구간은 실질적인 시장의 흐름을 주도하는 유동성 풀(liquidity pools)에 해당합니다. 이 지표는 해당 구간을 차트에 직접 시각화하여, 가격 반응이 실제로 나타나기 전에 이를 미리 예측할 수 있도록 돕습니다. 즉, 가격 추세가 전환될 가능성을 사전에 파악하게 해주는 것입니다. 결과적으로 이 지표는 가공되지 않은 가격 움직임(price action)을 시장의 핵심 가격대, 다시 말해 추세 전환점이 될 수 있는 지점들을 보여주는 명확하고 실용적인 로드맵
M1 Quantum MT5
Hamed Dehgani
4.27 (11)
M1 Quantum을 이용한 실시간 트레이딩 신호 : 신호   ( Quantum Trade Assistant 에 의해 거래가 자동으로 실행되며, 이 제품에 무료 로 포함되어 있습니다.) 최신 소식: 버전 1.64가 출시되었습니다. 이제 모든 거래에는 해당 지지/저항 구간 뒤에 Stop Loss가 설정됩니다. 또한 이번 버전에서는 EA의 성능을 향상시키기 위해 Smart Close 기능이 개선되었습니다. 8월 9일부터 라이브 신호는 버전 1.64로 운영되고 있습니다. 가격 계획: 현재 가격: $169 (얼리 어답터 혜택) 다음 예정 가격: $189 예정 소매 가격: $299 개발자 안내: 구매 후 저에게 연락하시면 최신 권장 설정 파일(Set File) , 사용 팁, 그리고 다른 M1 Quantum 사용자들과 소통할 수 있는 VIP 지원 그룹 초대장을 받으실 수 있습니다. 자주 묻는 질문 - 설정 파일 - 설치 가이드 M1 Quantum 은 M1 전용 전문 트레이딩 시스템으로, 손
Crystal Quantum Pro
Muhammad Jawad Shabir
5 (2)
CRYSTAL QUANTUM PRO Institutional Signal & Trade Intelligence for MetaTrader 5 Final Price: 199 USD ----> Price goes up 10 USD after every 10 sales. Limited launch slots available, act fast. Most indicators give you an arrow and leave you alone. A naked arrow is a gamble. Winning consistently requires CONFLUENCE , a clear STOP and TARGET , and honest PROOF that the system works. Crystal Quantum Pro delivers all three in one clean, no-repaint package. Crystal Quantum Pro is a complete decision sy
Market Structure Order Block Dashboard MT5는 시장 구조와 주요 가격 반응 구역을 차트에서 직접 읽고자 하는 트레이더를 위해 설계된 MT5 지표입니다. BOS, ChoCH, 오더 블록, Fair Value Gap (FVG), 유동성, Kill Zones, Volume Profile 그리고 빠른 분석을 위한 콤팩트한 대시보드를 결합합니다. 이 지표는 시장 구조, ICT 및 Smart Money 개념을 의사결정 프레임워크로 사용하는 트레이더를 대상으로 합니다. 추세 지속, 가능한 반전, 가격 불균형, 유동성 타겟 및 관심 구역을 보다 체계적으로 식별하는 데 도움을 줄 수 있습니다. 구매자를 위한 포함 리소스 구매 후 MQL5 개인 메시지로 요청하시면 완전한 PDF 사용 설명서와 파라미터 설정 팁을 제공해 드립니다. MQL5 개인 메시지를 통한 직접 기술 지원. 1.20 버전은 두 가지 주요 추가 기능을 제공합니다: Pending BOS / Pending
Axiom Matrix
Issam Kassas
5 (6)
AXIOM MATRIX MT5 출시 가격: $99 Axiom Matrix는 출시 가격 $99에 제공됩니다. 첫 30회 구매 이후 가격은 $199로 인상됩니다. 구매 후, 안내 사항을 받고 독점 선물 보너스를 받기 위해 저에게 직접 DM을 보내주세요. Axiom Matrix는 MetaTrader 5용 전문 멀티 심볼, 멀티 타임프레임 시장 스캐너이자 의사결정 대시보드입니다. Axiom Matrix는 사용자의 Market Watch를 스캔하고, 여러 타임프레임을 분석하며, 여러 근거 엔진을 읽고, 가장 강한 기회를 비교하여 하나의 깔끔한 매트릭스 대시보드 안에서 최적의 BUY, SELL, WAIT 또는 차단 상태를 보여줍니다. 저는 무거운 시장 스캔 작업을 대신 처리해 줄 수 있는 하나의 도구가 필요했기 때문에 Axiom Matrix를 만들었습니다. 저는 RSI만 따로 확인하고 싶지 않았습니다. 그다음 MACD만 따로 확인하고. 그다음 이동평균. 그다음 거래량. 그다음 변동성. 그다음
FiboSniper Pro
Van Minh Nguyen
5 (1)
FiboSniper Pro – 전문 멀티 필터 Fibonacci Grid 트레이딩 시스템 FiboSniper Pro는 Fibonacci Envelopes와 ADX, EMA, RSI, ATR 및 Time Filter를 포함한 다중 필터를 결합한 고급 기술 분석 지표 시스템입니다. 이를 통해 필터링된 진입 기회를 식별하고 ATR 변동성을 기반으로 Stop Loss 및 Take Profit 수준을 자동으로 계산할 수 있습니다. 특히 M5 스캘핑 전략을 사용하는 트레이더를 위해 설계되었습니다. 구매 후 Auto Trader X를 사용하여 FiboSniper Pro 신호를 자동으로 거래하는 방법에 대한 안내가 필요하시면 저에게 문의해 주세요. Auto Trader X를 통한 자동 매매 지원: [Auto Trader X] 사용자 가이드 및 권장 설정 파일 보기: [Click here] 업데이트 및 뉴스를 확인하려면 FiboSniper Pro MQL5 공개 채널에 참여하세요: [Click her
통화 강도 마법사는 성공적인 거래를 위한 올인원 솔루션을 제공하는 매우 강력한 지표입니다. 표시기는 여러 시간 프레임의 모든 통화 데이터를 사용하여 이 또는 해당 외환 쌍의 힘을 계산합니다. 이 데이터는 특정 통화의 힘을 확인하는 데 사용할 수 있는 사용하기 쉬운 통화 지수 및 통화 전력선의 형태로 표시됩니다. 필요한 것은 거래하려는 차트에 표시기를 부착하는 것뿐입니다. 표시기는 거래하는 통화의 실제 강세를 보여줍니다. 지표는 또한 추세와 거래할 때 유리하게 사용할 수 있는 구매 및 판매 거래량 압력의 극한값을 보여줍니다. 지표는 또한 피보나치에 기반한 가능한 대상을 보여줍니다. 표시기는 PUSH 알림을 포함한 모든 유형의 알림을 제공합니다. 구매 후 연락주세요. 나는 당신과 거래 팁을 공유하고 당신에게 무료로 훌륭한 보너스 지표를 줄 것입니다! 나는 당신에게 행복하고 유익한 거래를 기원합니다!
필터:
Findolin
2670
Findolin 2026.05.26 09:07 
 

사용자가 평가에 대한 코멘트를 남기지 않았습니다

Ali Çelik
447
Ali Çelik 2026.05.22 19:35 
 

사용자가 평가에 대한 코멘트를 남기지 않았습니다

리뷰 답변